Abstract
Cancer stem cells (CSCs) are the subpopulation of cells within a tumor that can self-renew, differentiate into multiple lineages, and drive tumor growth. Here we describe a two-pronged approach for the identification and characterization of CSCs from colorectal cancer cell lines, using a Matrigel-based differentiation assay, and cell surface markers CD44 and CD24. About 20 to 30% of cells from the SW1222 cell line form megacolonies in Matrigel that have complex 3D structures resembling colonic crypts. The megacolonies’ capacity to self-renew in vitro is direct evidence that they contain the CSCs. Furthermore, just 200 cells from SW1222 megacolonies initiate tumors in NOD/SCID mice. We also showed that CD44+CD24+ cells enriched for colorectal CSCs in the HT29 and SW1222 cell lines, which can self-renew and reform all four CD44/CD24 subpopulations, are the most clonogenic in vitro and can initiate tumors in vivo. A single SW1222 CD44+CD24+ CSC, when grown in Matrigel, can form large megacolonies that differentiate into enterocyte, enteroendocrine, and goblet cell lineages. The HCT116 line does not differentiate or express CDX1, nor does it contain subpopulations of cells with greater tumor-forming capacity, suggesting that HCT116 contains mainly CSCs. However, forced expression of CDX1 in HCT116 leads to reduced clonogenicity and production of differentiating crypt-containing colonies, which can explain the selection for reduced CDX1 expression in many colorectal cancers. In summary, colorectal cancer cell lines contain subpopulations of CSCs, characterized by their cell surface markers and colony morphology, which can self-renew and differentiate into multiple lineages.
Keywords: clonogenicity, matrigel, CD44, goblet cells
The idea that cancers are driven by cancer stem cells (CSCs) that may differentiate into a variety of cell types corresponding to the tissue of origin of the cancer, while maintaining the ability to self-renew, is now widely accepted for essentially all cancers (1). Most CSC assays have so far depended on the use of a variety of different cell surface markers, including CD133, CD44, and CD24, to enrich for CSCs from primary tumor tissue using FACS technology, and then testing propagation in immunodeficient mice (2 –4). Such assays are cumbersome and expensive, and do not readily enable either the characterization of the CSCs or their functional study. A reliable in vitro assay for CSCs derived from cell lines would have many advantages; for example, enabling relatively high throughput testing of drugs and antibody effects, as well as gene knockdown and re-expression studies on specific CSC functions, rather than on all of the cells in a cancer. An in vitro assay would also enable the unequivocal identification of the specific genes that control the stem-cell state, which has so far proved relatively elusive.
Cell lines represent a valuable resource that can be reused repeatedly over time, unlike primary human tissue. They can readily be characterized with respect to mutational content (5) and mRNA expression. They are not contaminated with stromal tissue, which can affect the interpretation of data obtained from primary human tissue (6). There is strong evidence that cell lines represent the tumors from which they were originally isolated (7) and can develop structures similar to those found in the original tissue (8). The same percentages of mutations in genes seen in primary colonic cancers are also seen across our panel of cell lines. Furthermore, data from our laboratory demonstrate that duplicate cell lines obtained from different laboratories continue to have the same mutations and their microarray-expression profiles cluster together.
Our aim in this article is to show how the CSCs in colorectal cancer-derived cell lines can be clearly identified. We concentrate on three colorectal cell lines with contrasting abilities to differentiate, which correlate inversely with the proportion of CSCs found within them. We demonstrate that colorectal cell lines contain CSC populations that can be enriched by the use of an in vitro Matrigel-based differentiation assay together with selection for expression of the CD44 and CD24 cell surface markers. We show that “megacolonies” from one of the lines, SW1222, containing complex internal crypt-like structures, must be derived from the CSC population, and that cells from these colonies are able to self-renew and initiate tumors in immunodeficient NOD/SCID mice. Furthermore, the CD44+CD24+ cells are the most clonogenic in vitro, form the greatest numbers of megacolonies, and can initiate tumors in NOD/SCID mice.
Results
Single Cells from the SW1222 Cell Line Form Colonies with Different Morphologies when Grown in Matrigel.
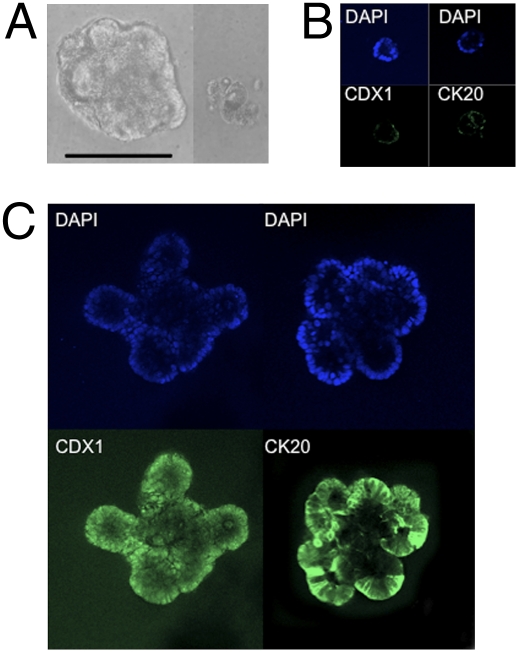
Earlier work from our laboratory showed that the colorectal carcinoma cell line SW1222 could form lumen like glandular structures when grown in three dimensions, either in collagen I gels or in Matrigel (9, 10). The two main types of colonies formed by single SW1222 cells, obtained by filtration and plated by limiting dilution in Matrigel, are shown in Fig. 1A. Approximately 20% of the cells give rise to large, complex structured colonies with clear internal crypt-like formations and these we call “megacolonies.” Another ≈15% of cells form smaller unstructured colonies less than 400 micrometers in diameter. Megacolonies increase significantly in size between 7 and 14 days, and express increasing amounts of two key markers of differentiation, CDX1 and CK20 (11), at day 14 as compared to day 7 (Fig. 1 B and C). The small colonies, however, have limited growth potential. When live megacolony colonies were examined using multiphoton microscopy, they contained clear central lumens, with adjacent secretory vesicles and outlines of goblet cells (Fig. S1, Movie S1 and Movie S2).
Fig. 1.
Immunofluorescence of SW1222 cell line colonies. (A) The SW1222 cell line can differentiate and form two distinct colony types: megacolonies with complex 3D lumen-like structures and small colonies. (Scale bar, 400 μm.) (B) Immunofluorescence of SW1222 megacolonies in Matrigel shows low levels of CDX1 and CK20 expression at day 7. (C) By day 14, megacolonies express much higher levels of CDX1 and CK20. Magnification: 20×.
Staining using fluorescein diacetate/propidium iodide to detect viable and dead cells within the megacolonies showed that most of the cells within these structures were still viable, even after 4 weeks in culture (Fig. S2). These data suggest that the megacolonies arise from CSCs in the cell line. To test this hypothesis, megacolonies and small colonies were subcloned in Matrigel.
SW1222 Megacolonies Give Rise to Megacolonies and Small Colonies, Although Small Colonies only Give Rise to More Small Colonies.
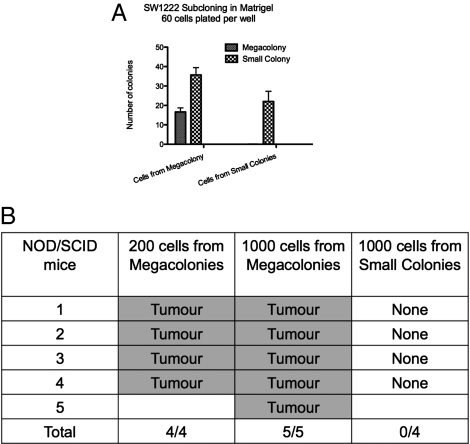
SW1222 single cells obtained by filtration were plated in limiting dilutions in 96-well Matrigel-containing plates. Megacolonies and small colonies growing in single wells were pooled separately, disaggregated, and filtered into a single-cell suspension and then replated into Matrigel. Fig. 2A shows that cells from megacolonies were able to reform megacolonies (27.8% on average), as well as small colonies (59.4%), although cells from small colonies could only reform themselves (36.7%) and could not form megacolonies. Cells from both types of colonies were next injected into NOD/SCID mice. As few as 200 cells from megacolonies were able to initiate tumors; however, even 1,000 cells from small colonies were unable to do so (Fig. 2B). These results strongly support the view that the megacolonies are formed from CSCs in the SW1222 cell line. Xenografts derived from megacolonies are able to recapitulate a well-differentiated adenocarcinoma (Fig. S3).
Fig. 2.
SW1222 subcloning in Matrigel. (A) Megacolonies and small colonies growing in single wells in a 96-well plate were pooled separately, disaggregated into a single-cell suspension, and then replated in Matrigel in 96-well plates, at a concentration of 60 cells per well. Megacolonies are able to reform themselves, as well as small colonies, but small colonies can only reform themselves. (B) Cells from megacolonies are able to initiate tumors in NOD/SCID mice, but cells from small colonies are not tumorigenic.
SW1222 FACS-Sorted CD44+CD24+ Cells Are the Most Clonogenic Subpopulation, Form the Greatest Number of Megacolonies, Which Self-Renew and Differentiate, and Are the Most Efficient in Producing Tumors in NOD/SCID Mice.
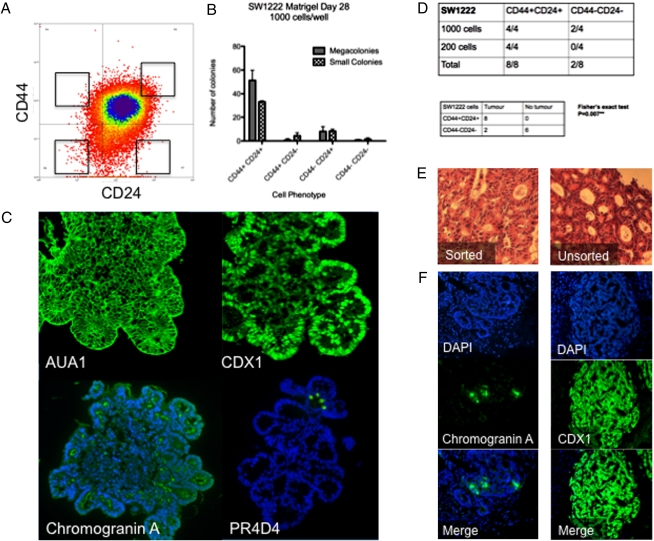
Using the markers CD44 and CD24 to enrich for putative colorectal CSCs from the SW1222 cell line by FACS sorting, we showed that the CD44+CD24+ cells (Fig. 3A, upper 0.5–1%,) were the most clonogenic and gave rise to the highest proportion of megacolonies (Fig. 3B). Immunofluorescence analysis of megacolonies derived from single CD44+CD24+ sorted cells expressed markers of all three types of differentiated colonic epithelial cells, namely columnar, goblet, and enteroendocrine cells (Fig. 3C). The chromogranin-A staining was particularly strong around the lumen-like structures, suggesting that the product was secreted. The overall pattern of staining is as expected on the assumption that these megacolonies, containing multiple lineages, originally arise from single CD44+CD24+ CSCs present in the SW1222 cell line.
Fig. 3.
Characterization of CD44/CD24 selected SW1222 cells. (A) The extreme 0.5 to 1% of each CD44/CD24 subgroup by FACS analysis was taken for further experiments. (B) CD44+CD24+ SW1222 cells are the most clonogenic and form the greatest numbers of megacolonies when grown in Matrigel, compared to other CD44/CD24 subgroups. (C) A single CD44+CD24+ cell can give rise to a megacolony forming multiple differentiated cell types: AUA-1 (anti-EpCam pan-epithelial marker), CDX1 (enterocyte), chromogranin A (enteroendocrine), and PR4D4 (mucin, see Fig. S6). Nuclei stained blue with DAPI. Megacolonies grown in Matrigel for 4 weeks. (D) CD44+CD24+ sorted cells are more tumorigenic in NOD/SCID mice: 200 and 1,000 cells of CD44+CD24+ and CD44−CD24− cells were injected into NOD/SCID mice (Upper) and assessed for tumor forming capacity. The results of the 200 and 1,000 cell groups were combined together in a 2 × 2 contingency table (Lower), and analyzed statistically using Fisher’s exact test (P = 0.007). (E) Both CD44+CD24+ sorted and unsorted SW1222 cells are able to form well-differentiated adenocarcinomas that are histologically indistinguishable when injected into NOD/SCID mice (H&E stain, magnification 20×). (F) Xenografts derived from SW1222 CD44+CD24+ sorted cells express the differentiation markers chromogranin A (enteroendocrine) and CDX1 (enterocyte).
The sorted CD44+CD24+ cells were also the most efficient at producing tumors in NOD/SCID mice, as would be expected if this subpopulation enriched the most for CSCs from the SW1222 cell line (Fig. 3D).
Cells from megacolonies analyzed by FACS for CD44 and CD24 produced all four combinations of CD44±CD24± expression. Reanalysis of megacolonies derived from single CD44+CD24+ cells again produced all four combinations of CD44±CD24± expression, and isolation of CD44+CD24+ cells derived from this second cell sort were capable of reforming megacolonies for a further generation. The ability of megacolonies to self-renew and differentiate is again consistent with their containing the CSC subpopulation (Fig. S4).
FACS analysis of xenografts derived from an initial injection of CD44+CD24+ cells showed that these tumors were able to express all four CD44±CD24± subpopulations (Fig. S5). The histology of the SW1222-derived xenograft tumors was similar to that of a well-differentiated primary human lumen-forming tumor, whether it was from a SW1222 CD44+CD24+ sorted cell population or from unsorted SW1222 cells (Fig. 3E). The tumors from the SW1222 CD44+CD24+ cells contained differentiated cells, just as did the megacolonies studied in vitro (Fig. 3F).
The overall results both from the clonal analysis of SW1222 cells and from the analysis of the SW1222 CD44+CD24+ sorted cells provide, in our view, unequivocal evidence for the existence and identification of CSCs in the SW1222 cell line.
CSC Analysis in the HCT116 and HT29 Cell Lines.
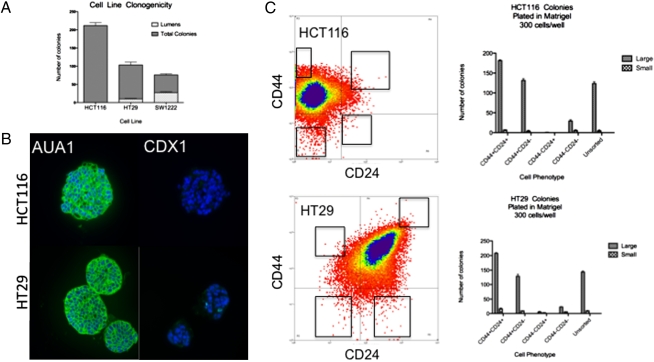
Two additional CRC lines were chosen for CSC analysis along the same lines as that described above for SW1222. HCT116 is known to be a highly aggressive cell line with little or no capacity to differentiate, although HT29 has an intermediate capacity to differentiate into enterocytes and mucin-expressing lineages (12 –14). The colony-forming abilities of HCT116 and HT29 in Matrigel are shown in Fig. 4A. In this case, colony morphology was classified by whether or not they formed lumens. The colonies that were able to differentiate to form lumens were comparable to those that developed into megacolonies in the SW1222 cell line. The data are consistent with the characterization of HCT116 as highly aggressive and nondifferentiating, giving rise to no lumen-forming colonies; however, HT29 has retained at least some capacity to differentiate.
Fig. 4.
Cell line clonogenicity. (A) Clonogenicity of HCT116, HT29, and SW1222 in Matrigel. Numbers of lumen-forming and total colonies counted per well. One thousand cells plated in Matrigel per well in 96-well plates, grown for 2 weeks. (B) HCT116 and HT29 colonies grown in Matrigel for 2 weeks stain positive for AUA1. HCT116 colonies are CDX1-negative, and HT29 colonies weakly express CDX1. Nuclei stained blue with DAPI. Magnification, 20×. (C) The CD44+CD24+ and CD44+CD24− subpopulations are of comparable clonogenicity for HCT116 and HT29 cells grown in Matrigel. Three hundred cells seeded per well in 24-well plates.
Immunofluorescence analysis of colonies derived from these cell lines, seeded in Matrigel and using the antibodies CDX1 and AUA1, is consistent with the above observations and the known lack of CDX1 expression in HCT116 (11) (Fig. 4B). Both cell lines produced colonies that were negative for PR4D4 staining. A few cells in HT29 colonies expressed CDX1, consistent with HT29’s limited capacity for differentiation.
The FACS analyses of the CD44±CD24± subpopulations of cells from these two cell lines, grown in Matrigel, are shown in Fig. 4C. For these two cell lines, the CD44+CD24− population has only slightly less clonogenic capacity than the CD44+CD24+ subpopulation, suggesting that, for these two lines, CD44 is the more important determinant with respect to enriching for CSCs (15).
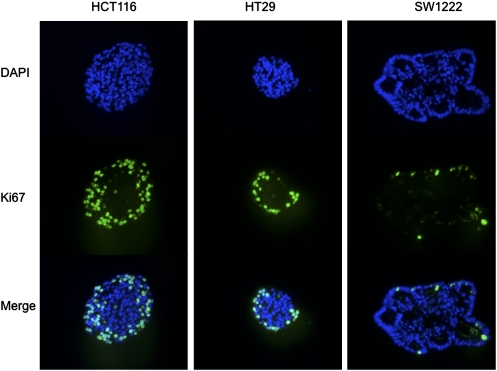
Immunofluorescence staining with the Ki67 antibody, a well known marker of dividing cells (16, 17), provides a further assessment of clonogenicity, as well as indicating the position of the most rapidly dividing cells in a colony. As shown in Fig. 5, the number of Ki67-positive cells correlates precisely with the aggressiveness of the cell lines and inversely with their propensity to differentiate. The Ki67 cells are in all cases found at the periphery of the colonies. This finding is a priori where the most rapidly dividing cells might be expected to be found. This could be the case even in differentiating colonies, where the peripheral cells are likely to be progenitor cells that divide more rapidly, but to a more limited extent, than the stem cells that might be expected to be found nearer the center of a colony.
Fig. 5.
Ki-67 staining for HCT116, HT29, and SW1222 colonies grown in Matrigel. Magnification, 20×.
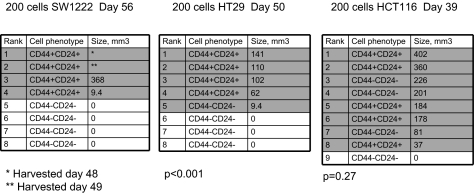
CD44+CD24+ and CD44−CD24− cells from the HCT116 and HT29 lines cells were injected into NOD/SCID mice, as before for SW1222. The results show that the selection does not seem to affect the tumor forming capacity of HCT116 cells, as there is no significant difference in the tumor sizes between the CD44+CD24+ and CD44−CD24− subpopulations. For HT29, on the other hand, there is a significant difference in size between these two cell subpopulations, although it is not as great as for the SW1222 cell line (Fig. 6). These results suggest that HCT116 contains a high proportion of CSCs that have lost the capacity to differentiate. This finding is exactly what might be expected for an aggressive and poorly differentiated tumor and correlates clinically with lymph node metastases (18, 19) and reduced survival (20, 21). HT29, on the other hand, is in general similar to SW1222, with a detectable proportion of stem cells with the capacity to differentiate.
Fig. 6.
Xenograft data ranked by size of tumor. SW1222 CD44+CD24+ cells are more tumourigenic than CD44−CD24− cells (Fig. 3D). Tumors derived from HT29 CD44+CD24+ cells are significantly larger than those derived from CD44−CD24− cells (unpaired t test, P < 0.001), but that is not the case for the HCT116 cell line (P = 0.27). Shaded rows highlight individual mice that developed tumors.
Increased Expression of CDX1 in HCT116 Reduces Clonogenicity and Induces Lumen Formation Within Colonies.
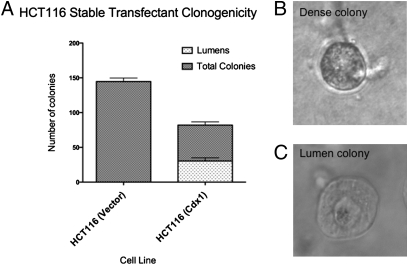
We have previously shown that CDX1 expression regulates the differentiation of crypt progenitor cells into mature intestinal epithelial cells (22) and, in particular, directly controls the expression of CK20 and probably other markers of differentiation of colonic epithelial cells as well (11). To test whether increasing the expression of CDX1 in a nonexpressing cell line decreases clonogenicity and increases the capacity to differentiate, we compared the clonogenic capacity of the HCT116 cell line stably transfected with a CDX1-expressing vector with that of the HCT116 cell line transfected with a vector control (11) (Fig. 7). The CDX1-expressing HCT116 cells are much less clonogenic, and also induce lumen formation within colonies, which is absent from the vector control. This supports the role of CDX1 in controlling colonic epithelial cell differentiation and shows that CDX1 expression may enable the CSCs in HCT116 to differentiate at least to some extent. The results also help to explain why loss of CDX1 expression (by methylation) is relatively frequently selected for in colorectal cancers (22).
Fig. 7.
HCT116 stable-transfectant clonogenicity. (A) Forced CDX1 expression in HCT116 colonies reduces clonogenicity and results in the development of lumen-forming colonies. (B) HCT116 vector control cell line produces no lumen-forming colonies. (C) Forced CDX1 expression induces lumen formation within HCT116 colonies.
Discussion
Through a combination of colony formation and surface marker selection, we have shown how CSCs can be recognized in the colorectal cancer-derived cell line SW1222. Thus, between 20 and 30% of SW1222 cells can form megacolonies containing crypt-like structures with multiple markers of differentiation when grown in Matrigel. The 3D structure of these megacolonies is strikingly similar to the morphology of organoids that can be generated from normal intestinal stem cells (23), suggesting that normal and cancer stem cells have similar mechanisms for self-renewal and differentiation. The expression of the differentiation marker, CDX1, increases with time in these colonies and cells from these colonies can self-renew, differentiate, and initiate tumors in immunocompromised NOD/SCID mice. Putative CSC markers, such as CD44, CD24 and, notably CD133, have been used to enrich for CSCs in colorectal and other tumors, although mainly in fresh tumor material (3, 4, 24, 25). CD44 siRNA knockdown in colorectal cancer cells has been associated with suppression of xenograft growth in nude mice (26). However, CD133 is not expressed in SW1222 and so cannot be a universal marker for CSC enrichment, at least in colorectal cancer, and the combination of CD44 with CD24 has not been examined before in colorectal cancer cell lines nor in primary colorectal cancer tissue. The upper 0.5 to 1% of CD44+CD24+ cells from SW1222 gives rise to the highest proportion of crypt-forming megacolonies; cells from these colonies can self-renew after several rounds of selection and continue to produce all four combinations of CD44±CD24± cells, as well as be the most efficient subset of SW1222 CD44±CD24± cells in forming tumors in NOD/SCID mice. This finding is consistent with selection for CD44+CD24+ cells in SW1222 enriching significantly for CSCs in the SW1222 cell line. However, not all CD44+CD24+ cells are clonogenic, and a few CD44−CD24− cells are also able to form colonies. More specific markers, including perhaps aldehyde dehydrogenase 1 (27), are needed for enriching for CSCs. The more differentiated cells, including goblet and enteroendocrine cells, appear to be located toward the periphery of the megacolonies, and the less differentiated cells more toward the center of the colonies, where there are reduced levels of CDX1, chromogranin A, and mucin. This finding suggests that the center of the megacolony may contain the major part of the CSC population.
Our results with SW1222 are consistent with earlier work on the HRA-19 colorectal carcinoma cell line, which was shown to be able to differentiate into multiple lineages, including columnar, goblet, and enteroendocrine cells, from a single original clone (28). Both sets of observations are consistent with evidence that normal colonic crypts in both mice (29) and humans (30) are clonal, and so have normal stem cells that can give rise to all of the three types of differentiated cells found in colorectal crypts. These tumor-derived cell lines are therefore recapitulating, in a deranged manner, the situation in a normal crypt.
The results for SW1222 have been extended to two other cell lines, HCT116 and HT29, which represent different extents of differentiation, or the lack of it. HCT116 is a highly aggressive cell line that shows no ability to differentiate and does not express CDX1; HT29 has an intermediate capacity to differentiate. Compared with HCT116, SW1222 retains the ability to differentiate and express high levels of CDX1, consistent with the hypothesis that SW1222 contains a lower proportion of undifferentiated cancer stem cells. This result confers a less aggressive phenotype, as demonstrated by a lower clonogenic and tumorigenic potential than HCT116. HCT116 cells do not significantly separate into different types of colony-forming cells, nor into different categories with respect to the ability to form tumors in NOD/SCID mice. This finding is consistent with the HCT116 cell line containing almost only CSCs, as also found by Kai et al. (31). HT29, however, behaves in an analogous way to SW1222, although with a higher proportion of clonogenic cells and a lesser propensity to differentiate. The relative numbers of dividing cells in the three lines are proportional both to their clonogenicity and tumor-formation capacity.
It is now becoming quite clear that the proportion of CSCs in a tumor can vary from very high and with little capacity to differentiate, as in HCT116, to much lower with much more differentiation, as in SW1222. The possibility that CSCs may in some cases constitute a relatively high proportion of the cells in a cancer is supported by recent data on highly efficient tumor formation from primary cells from melanoma patients in NOD/SCID Il2rg−/− mice (32). Melanomas are, however, notoriously aggressive tumors.
Theoretical models (33) can readily explain substantial variation in the proportion of CSCs versus differentiated cells in a cancer. The ratio between CSCs and differentiated cells can be shown, on reasonable assumptions, to depend on the rate of differentiation relative to the turnover rate of the CSCs. This is exactly as might be expected, namely that the less the propensity to differentiate, in general, the more aggressive the tumor and the higher the proportion of CSCs in it. The CSC field has been dogged by the assumption that CSCs are necessarily a small proportion of the cells in a cancer, which is clearly not the case.
It was suggested by Wong et al. (22) that selection for reduced expression of CDX1 in colorectal cancers (by methylation) is likely to be associated with a reduced capacity of the CSCs to differentiate and so contributing to an increased rate of growth. Following this suggestion, Chan et al. (11) provided evidence that CDX1 expression is a key switch for intestinal epithelial differentiation, probably mainly of columnar cells, so that studying the patterns of expression of CDX1 should enable better characterization of CSCs both in colorectal cancer cell lines and in primary colorectal cancer. The data presented in this article corroborate that suggestion, especially in showing that forced expression of CDX1 in HCT116 leads to reduced clonogenicity and, most significantly, a substantial proportion of crypt-forming colonies. This finding is consistent with the control of columnar cell differentiation by CDX1 and directly explains the advantage of selection for CDX1 down-regulation.
In preliminary further studies we have extended the classification of our cell-line panel into crypt colony-forming versus not, and are using this classification for the search for further markers for stem cell characterization and enrichment. We will also explore developing our colony-forming assays using the more sophisticated cell culture conditions described by Ootani et al. (34) and for the application to fresh tumor tissue.
We have obtained preliminary evidence, using our CSCs from the cell lines, that hypoxia inhibits differentiation and so maintains stemness, as has been shown in neuroblastoma tumors (35). There are clearly many advantages to working with CSCs from cell lines, both for basic investigation of the properties of CSCs and through those findings, identification of novel targets for drug development, as well as for the possible development of relatively high-throughput drug-response assays for CSCs. We suggest that the data presented in this article provide a basis for these important developments.
Materials and Methods
Detailed discussion can be found in the SI Materials and Methods.
Cell Lines.
HCT116 and HT29 colorectal cancer cell lines were originally obtained from the American Type Culture Collection (ATCC). The SW1222 cell line was a generous gift from Meenhard Herlyn, Wistar Institute, Philadelphia. All three cell lines were cultured in complete DMEM supplemented with 10% FBS and 1% penicillin/streptomycin (Invitrogen). Cells were incubated at 37 °C in a humidified 10% CO2 environment and were grown to 50 to 80% confluence before the next passage or further experiments. Cellular suspensions were obtained through trypsinization (0.5% trypsin for 2–5 min) and single cells were obtained by passing cells through a 20-μm filter (Celltrics; Partec). The stably transfected HCT116-CDX1 and vector-control cell lines were previously generated in our laboratory and maintained with geneticin selection pressure (11). All colony counts are based on the counts from three wells.
Immunohistochemistry and Confocal Immunofluorescence.
Immunohistochemistry was performed according to standard procedures. Dilutions of antibody used were: anti-CDX1 mAb (in-house; 1:100), anti-KRT20 mAb (Dako; 1:100), AUA1 anti-EpCam mAb (in-house; 1:100), PR4D4 mAb (in-house; 1:10), chromogranin A pAb (Dako; 1:500) and anti-Ki67 mAb (Dako; 1:100)
Fluorescent-Activated Cell Sorting.
Fluorescent-activated cell sorting was performed using standard protocols. Cells were labeled with mouse anti-human CD44-PE and mouse anti-human CD24-FITC (Caltag; Invitrogen). Cells were analyzed using a DakoCytomation Cyan machine, or sorted using a MoFlo cell sorter (Beckman Coulter). The top or bottom 0.5 to 1% of each CD44/CD24 subpopulation was collected for further experiments.
Matrigel Colony Morphology Assay.
Single cell suspensions were obtained using filtration and resuspended in a 1:1 mixture of Matrigel (BD Biosciences) and medium, and plated in 96-well plates in a limiting dilution. After 4 weeks of incubation, wells with single colonies were identified and colonies were retrieved using Matrigel Recovery Solution (BD Biosciences) as per manufacturer’s protocol. Viability of the cells was checked using Trypan Blue before being used for further experiments.
Live and Dead Cell Staining in Matrigel.
Cells were grown in a 1:1 mixture of Matrigel and medium at a density of 500 cells per 50 μL in each chamber of the Nunc 8-well slides. Colonies were grown for up to 4 weeks. Cells were incubated with both fluorescein diacetate (Fluka) and propidium iodide (BD Pharmagen), and then visualized under fluorescence.
In Vivo Tumorigenic Assays.
Single cells were resuspended in a 1:1 mixture of Matrigel and serum-free medium (DMEM with 1% penicillin/streptomycin). A 100-μL suspension containing between 200 and 1,000 cells was injected s.c. into the flanks of 6- to 10-week-old female NOD/SCID immunodeficient mice, obtained from the John Radcliffe Hospital Biomedical Services, Oxford, United Kingdom. Animal studies were conducted according to the University of Oxford institutional guidelines and within the limits of the Project License issued by the Home Office, United Kingdom.
Statistical Analysis.
All data are shown as mean ± SEM. For 2 × 2 contingency tables, Fisher’s exact test was used.
Supplementary Material
Acknowledgments
We thank Kevin Clark and Craig Waugh for their expertise on cell sorting, Joy Winter for processing histological specimens, Fillitsia Ntouroupi for her help with immunofluorescent microscopy, Peter Thomas for his help on the confocal microscope, Professor Zhanfeng Cui for the use of the multiphoton microscope, and Sally Hill, Karla Watson, Osama Al-assar, and Thomas Brunner for their help with animal work. This work was mainly funded by a Cancer Research U.K. program grant (to W.F.B. as Principal Investigator), by a Rhodes Scholarship (S.C.G.), and by support from the Jacqueline Seroussi Memorial Foundation for Cancer Research. T.M.Y. is a Royal College of Surgeons of England Research Fellow.
Footnotes
The authors declare no conflict of interest.
This article contains supporting information online at www.pnas.org/cgi/content/full/0915135107/DCSupplemental.
References
- 1.Reya T, Morrison SJ, Clarke MF, Weissman IL. Stem cells, cancer, and cancer stem cells. Nature. 2001;414:105–111. doi: 10.1038/35102167. [DOI] [PubMed] [Google Scholar]
- 2.Bonnet D, Dick JE. Human acute myeloid leukemia is organized as a hierarchy that originates from a primitive hematopoietic cell. Nat Med. 1997;3:730–737. doi: 10.1038/nm0797-730. [DOI] [PubMed] [Google Scholar]
- 3.O’Brien CA, Pollett A, Gallinger S, Dick JE. A human colon cancer cell capable of initiating tumour growth in immunodeficient mice. Nature. 2007;445:106–110. doi: 10.1038/nature05372. [DOI] [PubMed] [Google Scholar]
- 4.Ricci-Vitiani L, et al. Identification and expansion of human colon-cancer-initiating cells. Nature. 2007;445:111–115. doi: 10.1038/nature05384. [DOI] [PubMed] [Google Scholar]
- 5.Liu Y, Bodmer WF. Analysis of P53 mutations and their expression in 56 colorectal cancer cell lines. Proc Natl Acad Sci USA. 2006;103:976–981. doi: 10.1073/pnas.0510146103. [DOI] [PMC free article] [PubMed] [Google Scholar]
- 6.Volchenboum SL, et al. Comparison of primary neuroblastoma tumors and derivative early-passage cell lines using genome-wide single nucleotide polymorphism array analysis. Cancer Res. 2009;69:4143–4149. doi: 10.1158/0008-5472.CAN-08-3112. [DOI] [PMC free article] [PubMed] [Google Scholar]
- 7.Douglas EJ, et al. Array comparative genomic hybridization analysis of colorectal cancer cell lines and primary carcinomas. Cancer Res. 2004;64:4817–4825. doi: 10.1158/0008-5472.CAN-04-0328. [DOI] [PubMed] [Google Scholar]
- 8.Willson JK, Bittner GN, Oberley TD, Meisner LF, Weese JL. Cell culture of human colon adenomas and carcinomas. Cancer Res. 1987;47:2704–2713. [PubMed] [Google Scholar]
- 9.Richman PI, Bodmer WF. Control of differentiation in human colorectal carcinoma cell lines: epithelial-mesenchymal interactions. J Pathol. 1988;156:197–211. doi: 10.1002/path.1711560305. [DOI] [PubMed] [Google Scholar]
- 10.Pignatelli M, Bodmer WF. Genetics and biochemistry of collagen binding-triggered glandular differentiation in a human colon carcinoma cell line. Proc Natl Acad Sci USA. 1988;85:5561–5565. doi: 10.1073/pnas.85.15.5561. [DOI] [PMC free article] [PubMed] [Google Scholar]
- 11.Chan CW, et al. Gastrointestinal differentiation marker Cytokeratin 20 is regulated by homeobox gene CDX1. Proc Natl Acad Sci USA. 2009;106:1936–1941. doi: 10.1073/pnas.0812904106. [DOI] [PMC free article] [PubMed] [Google Scholar]
- 12.Demers MJ, et al. Intestinal epithelial cancer cell anoikis resistance: EGFR-mediated sustained activation of Src overrides Fak-dependent signaling to MEK/Erk and/or PI3-K/Akt-1. J Cell Biochem. 2009;107:639–654. doi: 10.1002/jcb.22131. [DOI] [PubMed] [Google Scholar]
- 13.Choi SR, et al. Biological properties and expression of mucins in 5-fluorouracil resistant HT29 human colon cancer cells. Int J Oncol. 2000;17:141–147. doi: 10.3892/ijo.17.1.141. [DOI] [PubMed] [Google Scholar]
- 14.Chakrabarty S. Regulation of human colon-carcinoma cell adhesion to extracellular matrix by transforming growth factor beta 1. Int J Cancer. 1992;50:968–973. doi: 10.1002/ijc.2910500624. [DOI] [PubMed] [Google Scholar]
- 15.Li C, et al. Identification of pancreatic cancer stem cells. Cancer Res. 2007;67:1030–1037. doi: 10.1158/0008-5472.CAN-06-2030. [DOI] [PubMed] [Google Scholar]
- 16.Cattoretti G, et al. Monoclonal antibodies against recombinant parts of the Ki-67 antigen (MIB 1 and MIB 3) detect proliferating cells in microwave-processed formalin-fixed paraffin sections. J Pathol. 1992;168:357–363. doi: 10.1002/path.1711680404. [DOI] [PubMed] [Google Scholar]
- 17.Scholzen T, Gerdes J. The Ki-67 protein: from the known and the unknown. J Cell Physiol. 2000;182:311–322. doi: 10.1002/(SICI)1097-4652(200003)182:3<311::AID-JCP1>3.0.CO;2-9. [DOI] [PubMed] [Google Scholar]
- 18.Chung CK, Zaino RJ, Stryker JA. Colorectal carcinoma: evaluation of histologic grade and factors influencing prognosis. J Surg Oncol. 1982;21:143–148. doi: 10.1002/jso.2930210302. [DOI] [PubMed] [Google Scholar]
- 19.Berti Riboli E, et al. Colorectal cancer: relationship of histologic grading to disease prognosis. Tumori. 1983;69:581–584. doi: 10.1177/030089168306900616. [DOI] [PubMed] [Google Scholar]
- 20.Halvorsen TB, Seim E. Degree of differentiation in colorectal adenocarcinomas: a multivariate analysis of the influence on survival. J Clin Pathol. 1988;41:532–537. doi: 10.1136/jcp.41.5.532. [DOI] [PMC free article] [PubMed] [Google Scholar]
- 21.Bjerkeset T, Morild I, Mørk S, Søreide O. Tumor characteristics in colorectal cancer and their relationship to treatment and prognosis. Dis Colon Rectum. 1987;30:934–938. doi: 10.1007/BF02554279. [DOI] [PubMed] [Google Scholar]
- 22.Wong NA, et al. Loss of CDX1 expression in colorectal carcinoma: promoter methylation, mutation, and loss of heterozygosity analyses of 37 cell lines. Proc Natl Acad Sci USA. 2004;101:574–579. doi: 10.1073/pnas.0307190101. [DOI] [PMC free article] [PubMed] [Google Scholar]
- 23.Sato T, et al. Single Lgr5 stem cells build crypt-villus structures in vitro without a mesenchymal niche. Nature. 2009;459:262–265. doi: 10.1038/nature07935. [DOI] [PubMed] [Google Scholar]
- 24.Vermeulen L, et al. Single-cell cloning of colon cancer stem cells reveals a multi-lineage differentiation capacity. Proc Natl Acad Sci USA. 2008;105:13427–13432. doi: 10.1073/pnas.0805706105. [DOI] [PMC free article] [PubMed] [Google Scholar]
- 25.Haraguchi N, et al. CD133+CD44+ population efficiently enriches colon cancer initiating cells. Ann Surg Oncol. 2008;15:2927–2933. doi: 10.1245/s10434-008-0074-0. [DOI] [PubMed] [Google Scholar]
- 26.Subramaniam V, Vincent IR, Gilakjan M, Jothy S. Suppression of human colon cancer tumors in nude mice by siRNA CD44 gene therapy. Exp Mol Pathol. 2007;83:332–340. doi: 10.1016/j.yexmp.2007.08.013. [DOI] [PubMed] [Google Scholar]
- 27.Huang EH, et al. Aldehyde dehydrogenase 1 is a marker for normal and malignant human colonic stem cells (SC) and tracks SC overpopulation during colon tumorigenesis. Cancer Res. 2009;69:3382–3389. doi: 10.1158/0008-5472.CAN-08-4418. [DOI] [PMC free article] [PubMed] [Google Scholar]
- 28.Kirkland SC. Clonal origin of columnar, mucous, and endocrine cell lineages in human colorectal epithelium. Cancer. 1988;61:1359–1363. doi: 10.1002/1097-0142(19880401)61:7<1359::aid-cncr2820610714>3.0.co;2-0. [DOI] [PubMed] [Google Scholar]
- 29.Ponder BA, et al. Derivation of mouse intestinal crypts from single progenitor cells. Nature. 1985;313:689–691. doi: 10.1038/313689a0. [DOI] [PubMed] [Google Scholar]
- 30.Novelli MR, et al. Polyclonal origin of colonic adenomas in an XO/XY patient with FAP. Science. 1996;272:1187–1190. doi: 10.1126/science.272.5265.1187. [DOI] [PubMed] [Google Scholar]
- 31.Kai K, et al. Maintenance of HCT116 colon cancer cell line conforms to a stochastic model but not a cancer stem cell model. Cancer Sci. 2009;100:2275–2282. doi: 10.1111/j.1349-7006.2009.01318.x. [DOI] [PMC free article] [PubMed] [Google Scholar]
- 32.Quintana E, et al. Efficient tumour formation by single human melanoma cells. Nature. 2008;456:593–598. doi: 10.1038/nature07567. [DOI] [PMC free article] [PubMed] [Google Scholar]
- 33.Johnston MD, Edwards CM, Bodmer WF, Maini PK, Chapman SJ. Examples of mathematical modeling: tales from the crypt. Cell Cycle. 2007;6:2106–2112. doi: 10.4161/cc.6.17.4649. [DOI] [PMC free article] [PubMed] [Google Scholar]
- 34.Ootani A, et al. Sustained in vitro intestinal epithelial culture within a Wnt-dependent stem cell niche. Nat Med. 2009;15:701–706. doi: 10.1038/nm.1951. [DOI] [PMC free article] [PubMed] [Google Scholar]
- 35.Jögi A, et al. Hypoxia alters gene expression in human neuroblastoma cells toward an immature and neural crest-like phenotype. Proc Natl Acad Sci USA. 2002;99:7021–7026. doi: 10.1073/pnas.102660199. [DOI] [PMC free article] [PubMed] [Google Scholar]
Associated Data
This section collects any data citations, data availability statements, or supplementary materials included in this article.


