

Abstract
The programmed death (PD)-1 interacts with its ligand (PDL-1) delivering a negative signal to T cells. During human immunodeficiency virus (HIV)-1 infection PD-1 and PDL-1 expression are increased. Here we show that monocytes and CCR5+ T cells of HIV-uninfected donors upregulated PDL-1 upon in vitro exposure to HIV. HIV-induced PDL-1 required interferon (IFN)-α, but not IFN-γ, production. Inhibition of endocytosis, required for HIV-induced IFN-α production, prevented PDL-1 upregulation. IFN-α-inducing Toll-like receptor (TLR) agonists increased PDL-1 on monocytes and CCR5+ T cells. CD80 and CD86 were also increased on monocytes and CCR5+ T cells after HIV exposure, but only CD80 was IFN-α-dependent. IFN-α-receptor subunit 2 (IFNAR2), was expressed only by CCR5+ T cells and monocytes, explaining why these leukocytes responded to HIV-induced IFN-α. Finally, T cell proliferation was improved by PDL-1 blockade in HIV-treated PBMC. In the setting of HIV infection, IFN-α may negatively affect T cell responses by inducing PDL-1.
Keywords: HIV-1, PDL-1, IFN-α, CCR5, T lymphocytes, monocytes, plasmacytoid dendritic cells, antigen-presenting cells, proliferation
INTRODUCTION
The network of costimulatory molecules (B7 family), expressed on the surface of antigen presenting cells (APC), and their receptors on T lymphocytes, constitutes a major positive and negative regulatory system of T cell activation [1; 2]. B7.1 (CD80) and B7.2 (CD86), the first described member of the B7 family, bind to the same receptors CD28 and cytotoxic T lymphocyte antigen (CTLA)-4, which respectively deliver activating and suppressing signals to the T cell [1; 2]. Other B7 ligands have been described [1], including B7-H1 (homolog 1), which was initially identified by sequence homology to B7.1 and B7.2 [3]. B7-H1 does not interact with CD28 or CTLA-4, but was shown to bind programmed death (PD)-1, hence the B7-H1 alternate name PD ligand 1 (PDL-1). The binding of PDL-1 to PD-1 delivers a negative costimulatory signal to T cells [4] and contributes to the induction of an anergic phenotype in self-reactive T cells [5; 6]. PDL-1 is expressed on both hematopoietic and nonhematopoietic cells, and can be induced by interferon (IFN)-γ on different cell type [1; 7; 8]. Although PDL-1/PD-1 ligation has been shown to inhibit T cell activation [4; 9] and to induce production of the downregulatory cytokine interleukin (IL)-10 [3], a potential stimulatory effect has been suggested under certain experimental conditions [3; 10]. In addition, PD-1 has a second ligand, namely PDL-2 (or B7-DC), which is expressed mainly on macrophages and dendritic cells (DC), has higher affinity for PD-1 than PDL-1 does and can be induced by interleukin (IL)-4 [1]. However, the consequences of ligation of PD-1 by either PDL-1 or PDL-2 are still not fully understood [1].
During chronic viral infections, the PDL-1/PD-1 system has been suggested to play a role in suppressing efficient anti-viral T cell responses [5; 11; 12; 13; 14]. In particular, the human immunodeficiency virus type 1 (HIV) establishes a chronic infection characterized by the progressive loss of T cell function in humans [15; 16]. CD4+ and CD8+ T cells from HIV-infected patients, including HIV-specific T cells, express increased levels of PD-1, which contribute to what has been referred to as “exhaustion” of protective immunity [17; 18; 19; 20]. Similarly, high PD-1 expression is associated with impaired proliferative response of simian immunodeficiency virus (SIV)-specific CD8+ T cells during both acute and chronic infection [21]. We previously reported that increased PDL-1 expression on monocytes, B cells and T cells from HIV-infected individuals is associated with increased production of IL-10 and correlates directly with plasma viral load and inversely with CD4 count [22]. Furthermore sustained expression of PDL-1 on T cells was described even in patients undergoing successful antiretroviral therapy [23]. Chronic T cell stimulation has been proposed to cause increased PD-1 expression on HIV-specific T cells [17; 18; 19], whereas the causes of increased PDL-1 expression during HIV infection are still obscure. In particular, T cell responses associated with production of the PDL-1-inducing cytokine IFN-γ are progressively impaired in HIV-infected patients [24; 25], suggesting that other immune mediators may contribute to the altered expression pattern of PDL-1 on immune cells.
In the present study we investigated PDL-1, as well as CD80 and CD86, expression in peripheral blood mononuclear cells (PBMC) from HIV-uninfected donors after in vitro exposure to reverse transcription-deficient (treated with aldrithiol-2, AT-2) or infectious HIV. We found that AT-2 HIV increased PDL-1 in monocytes (CD14+) and CCR5+ T cells (CD3+CCR5+), but not B cells (CD19+) or CCR5− T cells. Importantly, PDL-1 induction was mediated by IFN-α signaling, rather than IFN-γ. PDL-1 induction was also achieved using other IFN-α-inducing stimuli, such as Toll-like receptor (TLR) agonists. AT-2 HIV-induced PDL-1 expression was prevented by chloroquine-mediated inhibition of endosomal acidification, suggesting a role for TLR activation and IFN-α production by plasmacytoid DC (pDC). Similar AT-2 HIV-induced increases were observed for CD80 and CD86 on monocytes and CCR5+ T cells, but only the effect on CD80 appeared to be IFN-α-dependent. We observed that the expression of the IFN-α receptor subunit 2 (IFNAR2) was restricted to CCR5+ T cells and monocytes, possibly explaining their unexpected responsiveness to HIV-induced IFN-α. Finally, we demonstrated that AT-2 HIV-induced PDL-1 inhibited T cell proliferative responses in vitro.
MATERIAL & METHODS
Isolation and culture of blood leukocytes
Blood samples were obtained from healthy donors under an NIH IRB-approved protocol developed by the Department of Transfusion Medicine, NIH, Bethesda, MD; and HIV-infected patients (N=14) who were involved in the USAF Natural History Study. All blood samples were collected under protocols that were reviewed and approved by the Institutional Review Boards of the USAF Wilford Hall Medical Center, Lackland AFB, TX and of the National Cancer Institute, Bethesda, MD. Nine of the HIV-infected patients were receiving highly-active antiretroviral therapy (HAART), consisting of a combination of two reverse-transcriptase inhibitors and one protease inhibitor, at the time of enrollment. Five of the HIV-infected patients were HAART-free at the time of enrollment. Plasma viral loads and CD4 counts for all HIV-infected patients included in the study are summarized in Table 1. HAART-treated patients had significantly lower viral load compared to HAART-free patients (P=0.019), whereas CD4 counts were not significantly different between the two groups. In vitro experiments were performed using peripheral blood mononuclear cells (PBMC) isolated by density centrifugation from peripheral blood lymphocyte separation medium (Cambrex, Gaithersburg, MD). Cells were cultured in RPMI 1640 (Invitrogen, Gaithersburg, MD) containing 10% fetal bovine serum (Hyclone, Logan, UT) and 1% Pen-Strep-Glut (Invitrogen). Monocytes were isolated from healthy donor PBMC by positive selection using a CD14 isolation kit (Miltenyi Biotech, Auburn, CA).
Table 1.
Clinical data of HIV-infected patients.
| Patient | Viral Load | CD4 count | HAART |
|---|---|---|---|
| 1 | 8,030 | 69 | 16 years |
| 2 | <50 | 402 | 5 years |
| 3 | <50 | 1235 | 10 years |
| 4 | <50 | 423 | years not available |
| 5 | <50 | 1022 | 8 years |
| 6 | <50 | 664 | 2 years |
| 7 | <50 | 692 | 6 years |
| 8 | <50 | 1461 | 9 years |
| 9 | >100,000 | 367 | 13 years |
| 10 | 45,200 | 258 | No HAART |
| 11 | 25,400 | 552 | No HAART |
| 12 | 19,700 | 359 | No HAART |
| 13 | 94,200 | 540 | No HAART |
| 14 | 55,500 | 640 | No HAART |
Viral load: HIV RNA copies / ml
CD4 Count: Cells / mm3
Preparation of noninfectious AT-2 HIV-1
All virus preparations were kindly provided by Dr. Jeffrey D. Lifson, National Cancer Institute, Frederick, MD. HIV-1MN (X4-tropic) and HIV-1Ada (R5-tropic) were inactivated with 1 mM Aldrithiol-2 (AT-2) for 18h at 4°C (AT-2 HIV-1), as described [26]. Microvesicles, isolated from uninfected cell cultures were employed as a negative control (mock) [26].
Stimulation and culture of PBMC
PBMC were cultured with noninfectious AT-2 HIVMN (TCID50 = 106), AT-2 HIVAda (TCID50 = 1000) or their non-AT-2-treated infectious counterparts at 300 ng/mL p24CA equivalent overnight as previously described [27], unless otherwise specified. Experiments conducted using AT-2 HIVMN, AT-2 HIVAda or non AT-2-treated infectious HIV-1MN or HIV-1Ada gave comparable results. Only results obtained using AT-2 HIVMN are shown. A mixture of 12 different species of rIFN-α (IFN-α sampler kit, R&D Systems) was used at the final concentration of 1000 U/ml. rIFN-γ (Peprotec, Rocky Hill, NJ) was used at 1 ng/ml. Endotoxin-free class A CpG-ODN 2216 (5′-ggGGGACGATCGTCgggggG-3′), class B CpG-ODN 2006 (5′-TCGTCGTTTTGTCGTTTTGTCGTT-3′), and class C CpG-ODN 2395 (5′-TCGTCGTTT-TCG-GCGCGCGCCG-3′) were provided by Coley Pharmaceutical Group, Inc. (Wellesley, MA). Class A CpG-ODN was used at a concentration of 4 μg/ml while the class B and class C CpG-ODN were used at a concentration of 1.5 μg/ml, based on previous experiments in which optimal concentrations for these CpG-ODN were determined [28]. Agonists for TLR7 (3M-001), TLR8 (3M-002) and TLR7/8 (3M-011) were provided by 3M Pharmaceutical (St. Paul, MN. The TLR7 agonist was used at a concentration of 0.3μM while the TL8 and TLR7/8 agonists were used at 3.0 μM, in which optimal concentrations were determined previously [29].
Blocking assays
Blocking of type I or type II IFN was performed by pre-incubating PBMC with 5 μg/ml anti-IFNAR (Invitrogen) or 10 μg/ml anti-IFNGR (R&D systems, Minneapolis, MN) for 30 min before addition of AT-2 HIV.
Flow cytometry
After stimulation in culture, cells were washed and incubated for 20 min at room temperature in PBS containing 2% mouse serum (Sigma) with different combinations of the following antibodies: Peridinn chlorophyll protein (PerCP)-conjugated anti-CD3 (BD Biosciences), Phycoerythrin-Cy7 (PE-Cy7)-conjugated or fluorescein isothiocyanate (FITC)-conjugated anti-CD14 (all from BD Biosciences), PE-Cy7-conjugated anti-CD19 (BD Biosciences), Allophycocyanin Cy7 (APC-Cy7)-conjugated or PE-conjugated anti-CCR5 (all from BD Biosciences), APC-conjugated or APC-Cy7-conjugated anti-CD4 (BD Biosciences), APC-conjugated anti-PDL-1 (eBioscience), FITC-conjugated CD86 (BD Biosciences), PE-conjugated anti-CD80 (BD Biosciences), APC-Cy7-conjugated anti-HLA-DR, PE-conjugated anti-IFNAR2 (Invitrogen). Cells were washed twice in ice-cold DPBS and FACS analysis was performed on a FACSCanto flow cytometer using FACSDiva software (BD Biosciences). Proliferation was measured by flow cytomtery using carboxyfluorescein diacetate succinimidyl ester (CFSE) as described previously [30]. FlowJo software (Treestar, Ashland, OR) was used to analyze flow cytometry data.
Cytokine detection
Culture supernatants were tested for soluble IFN-α (Cell Sciences, Canton, MA) or IFN-γ (R&D Systems) by ELISA according to the manufacturer’s instructions.
Proliferation experiment
CFSE-labeled PBMC from three different donors were cultured in presence or absence of AT-2 HIV as described above. After 24 hours cells were washed twice with DPBS and incubated for 30 min with 10 μg/ml anti-PDL-1 antibody (eBioscience) before addition of 1μg/ml OKT3 anti-CD3 (eBioscience). Proliferation was measured by flow cytometry on CD3+ CD4+ (CD4 T cells) and CD3+ CD8+ (CD8 T cells) gated PBMC. Calculation of division index (number of cell divisions/total cell number) and proliferation index (number of cell divisions/number of divided cells) was performed using FlowJo software (Treestar).
Statistical analysis
All experiments were repeated on PBMC from at least three different donors. Statistical analyses were performed using the SPSS 13.0 software (SPSS Inc., Chicago, IL, USA). Differences between treated and untreated cells were assessed using a two-tailed paired Student’s t-test. Differences between HIV-1-infected and uninfected donors were assessed using a non-parametric two-tailed Mann-Whitney U test. In all cases P<0.05 was considered statistically significant. Univariate distributions of flow cytometric data were performed by probability binning, in 300 bins using FlowJo software [31].
RESULTS
Increased PDL-1 expression on monocytes and CCR5+ T cells after exposure to AT-2 HIV
We previously reported that monocytes, T cells and B cells from HIV-infected patients express increased levels of PDL-1 [22]. Therefore, we investigated whether in vitro exposure of PBMC from HIV-uninfected donors to AT-2 HIV would result in PDL-1 induction in these same cell types. PDL-1 surface expression was analyzed on monocytes (CD14+), B cells (CD19+) and T cells (CD3+) using flow cytometry (Fig. 1A). Exposure to AT-2 HIV increased PDL-1 expression on monocytes and CCR5+ T cells, but induced only minor changes on B cells and CCR5− T cells (Fig. 1A). Of note, after exposure to AT-2 HIV, the vast majority of monocytes and CCR5+ T cells became positive for PDL-1 (monocytes: 94.95±4.73%; CCR5+ T cells: 83.80±14.56%) (Fig. 1A).
Figure 1. HIV induces PDL-1 expression on monocytes and CCR5+ T cells.
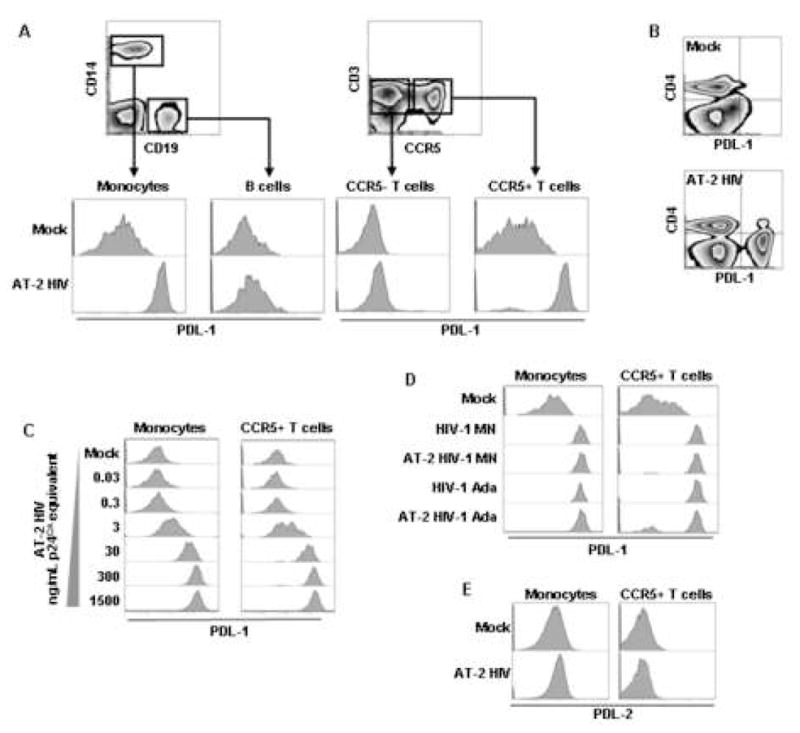
(A) Flow cytometry contour plot showing gating on monocytes (CD14+ cells) and B cells (CD19+) (left upper panel), or CCR5+ and CCR5− T cells (CD3+ cells) (right upper panel); lower panels show flow cytometry histograms of PDL-1 expression in the gated subpopulations after 24 hours of culture of PBMC in presence of AT-2 HIVMN (experiments conducted using AT-2 HIVAda or non-AT-2-treated HIV-1MN or HIV-1Ada gave comparable results) or control microvescicles (Mock). (B) Flow cytometry contour plot showing simultaneous expression of CD4 and PDL-1 in PBMC after 24 hours of culture in presence of AT-2 HIV or control microvescicles (Mock). (C) Flow cytometry histograms of PDL-1 expression gated on monocytes (CD14+ cells) or CCR5+ T cells (CD3+ cells) after 24 hours of culture in presence of different concentrations of AT-2 HIV. (C) Flow cytometry histograms of PDL-1 expression gated on monocytes (CD14+ cells) or CCR5+ T cells (CD3+ cells) after 24 hours of culture in presence of AT-2 HIVMN AT-2 HIVAda or their infectious counterparts. (E) Flow cytometry histograms of PDL-2 expression gated on monocytes (CD14+ cells) or CCR5+ T cells (CD3+ cells) after 24 hours of culture of PBMC in presence of AT-2 HIV or control microvescicles (Mock). In all cases one example characteristic of at least five independent experiments is shown.
Because HIV directly interacts with CD4-expressing cells through the envelope glycoprotein gp120, we analyzed whether the HIV-induced increase in PDL-1 was restricted to CD4+ cells within the PBMC. We did not find any association between expression of CD4 and upregulation of PDL-1 in the AT-2 HIV-treated PBMC, in that CD4+ and CD4− cells responded to HIV-exposure with comparable increases of PDL-1 expression (Fig. 1B), quantified both as mean fluorescence intensity (MFI) and as proportion of PDL-1+ cells (data not shown). Even among T cells, the level of PDL-1 induction was comparable between CD4 and CD8 T cells, provided that they expressed CCR5, suggesting that the direct interaction of T cells with HIV through engagement of CD4 by gp120 is not required for PDL-1 upregulation. This result is consistent with the hypothesis that the induction of PDL-1 may be mediated by the induction of immune mechanisms not limited to CD4+ cells.
PDL-1 expression was affected by AT-2 HIV in a dose-dependent manner on both monocytes and CCR5+ T cells (Fig. 1C). These results suggest that exposure to HIV is responsible for the increased PDL-1 expression on monocytes and T cells in PBMC from HIV-infected patients.
All results shown throughout the study were obtained using AT-2 HIVMN (X4-tropic) virus; comparable results were obtained when AT-2 HIVMN, AT-2 HIVAda (R5-tropic) or their non-AT-2-treated, infectious counterparts were used (Fig. 1D). The fact that both X4- and R5-tropic viruses induced similar PDL-1 upregulation on CD4 and CD8 T cells suggests that the selective effect on CCR5+ T cells does not depend on signaling through this chemokine receptor, which may be engaged by R5-, but not X4-tropic HIV.
PD-1 can bind both PDL-1 and PDL-2. Therefore, we investigated whether PDL-2 was also induced on monocytes and CCR5+ T cells in AT-2 HIV-treated PBMC. No change of PDL-2 expression was observed on monocytes or CCR5+ T cells after exposure to AT-2 HIV (Fig. 1E).
Increased PDL-1 expression in monocytes and CCR5+ T cells from HIV-infected patients
We analyzed PDL-1 expression in PBMC from a group of HIV-infected patients (N=14; Table 1) and uninfected donors (N=8). Monocytes from HIV-infected patients showed increased levels of PDL-1 expression compared to uninfected healthy control donors (Fig. 2A) measured as MFI (Fig. 2B) or frequency of PDL-1+ subpopulation (Fig. 2C). Similar, CCR5+ T cells from HIV-infected patients showed increased levels of PDL-1 expression compared to uninfected controls (Fig. 2A, 2B and 2C). These results confirm our previous findings of increased PDL-1 expression in HIV-infected patients [22] and better define their phenotype based on CCR5 expression.
Figure 2. Increased PDL-1 on monocytes and CCR5+ T cells form HIV-infected parients.
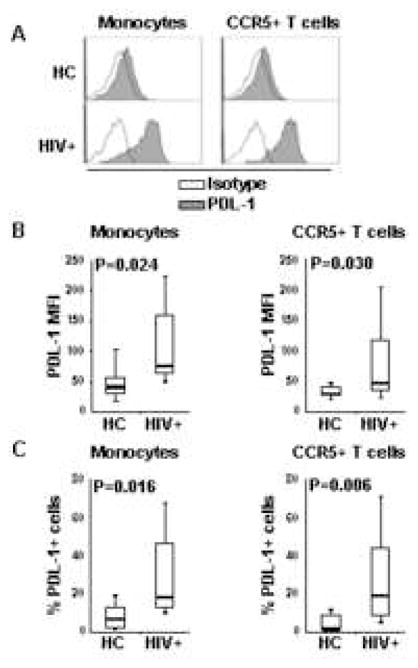
(A) Flow cytometry histograms of PDL-1 expression gated on monocytes (CD14+ cells) or CCR5+ T cells (CD3+ cells) from PBMC of one HIV-uninfected healthy control (HC) and one HIV-infected (HIV+); open lines represent the baseline fluorescence of staining with isotype antibody, solid lines represent fluorescence of staining with anti-PDL-1 antibody. (B) Box plots showing PDL-1 MFI in monocytes and CCR5+ T cells measured in 14 HIV+ and 8 HC. (C) Box plots showing frequency of PDL-1-expressing cells within monocytes and CCR5+ T cells measured in 14 HIV+ and 8 HC. In (B) and (C) horizontal bars represent median values; upper and lower limits of boxes are 75th and 25th percentiles; vertical lines extend to 90th and 10th percentiles.
IFN-γ is not required for AT-2 HIV-mediated induction of B7 molecules
IFN-γ is a known regulator of PDL-1 [1; 7; 8] and we have previously shown that AT-2 HIV induces IFN-γ mRNA expression in PBMC [30]. Here we found that IFN-γ production, measured by ELISA, was increased approximately 5-fold by AT-2 HIV (Fig. 3A). We then investigated whether blocking antibodies against the IFN-γ receptor (anti-IFNGR) would block the effect of AT-2 HIV on PDL-1. Anti-IFNGR did not prevent AT-2 HIV-induced PDL-1 on either monocytes or CCR5+ T cells (Fig. 3B). This lack of effect was not due to inefficient blocking, because in the same experiments anti-IFNGR inhibited PDL-1 induction by rIFN-γ (1 ng/ml, approximately 25–50 fold higher than the amount of IFN-γ induced by AT-2 HIV in PBMC) (Fig. 3B). In addition, no increase in PDL-1 expression was observed when PBMC were cultured in presence of rIFN-γ at concentrations comparable to those observed in supernatants of AT-2 HIV-treated cells (10–100 pg/ml) (data not shown), suggesting that the amount of IFN-γ produced by PBMC in response to AT-2 HIV is not sufficient to produce an effect on PDL-1 expression on monocytes and CCR5+ T cells.
Figure 3. IFN-γ-signaling is not required for AT-2 HIV-induced PDL-1, CD80 and CD86.

(A) Detection of IFN-γ by ELISA in supernatants from PBMC cultured in presence of AT-2 HIV or control microvescicles (Mock). (B) Surface expression of PDL-1, CD80 and CD86 analyzed by flow cytometry, gating on monocytes (CD14+ cells) or CCR5+ T cells (CD3+ cells), in PBMC cultured for 24 hours in presence of control microvescicles (Mock), AT-2 HIV alone or in presence of blocking antibodies against the cellular receptor for IFN-γ (anti-IFNGR), as well as rIFN-γ alone or in presence of anti-IFNGR. Flow cytometry histograms for one example characteristic of four independent experiments are shown.
We also investigated whether expression of other surface proteins of the B7 family, namely B7.1 (CD80) and B7.2 (CD86), was affected by AT-2 HIV. CD80, and to a lesser extent CD86, were upregulated on both monocytes and CCR5+ T cells after exposure of PBMC to AT-2 HIV (Fig. 3B). Similar to PDL-1, anti-IFNGR did not inhibit HIV-induced CD80 and CD86 on either monocytes or CCR5+ T cells (Fig. 3B). In addition, stimulation of PBMC with rIFN-γ (1 ng/ml) had no effect on CD80 and CD86 expression on monocytes and CCR5+ T cells (Fig. 3B). These results suggest that stimuli other than IFN-γ are involved in HIV-mediated induction of PDL-1, CD80 and CD86 on monocytes and CCR5+ T cells.
Type I IFN regulates PDL-1 expression on monocytes and CCR5+ T cells
Recent evidence suggests that IFN-α may induce PDL-1 in different cell types [20; 32], and HIV activates pDC to produce IFN-α [27]. Therefore, we investigated whether IFN-α-signaling was involved in AT-2 HIV-mediated PDL-1 induction. We measured IFN-α production in supernatants of AT-2 HIV-treated PBMC and observed an approximate 20-fold increase compared to mock-treated PBMC (Fig. 4A). Furthermore, rIFN-α induced PDL-1 on monocytes and CCR5+ T cells, which was partially inhibited by anti-IFNAR (Fig. 4B).
Figure 4. AT-2 HIV-induced PDL-1 and CD80, but not CD86, is IFN-α-dependent.
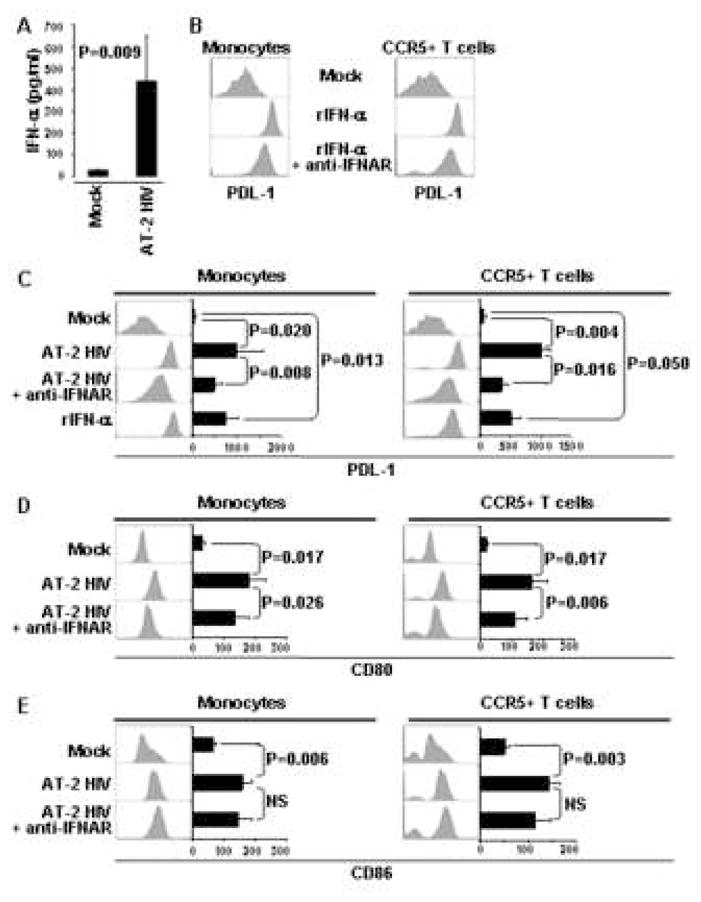
Detection of IFN-α (A) by ELISA in supernatants from PBMC cultured in presence of AT-2 HIV or control microvescicles (Mock). (B) Surface expression of PDL-1 analyzed by flow cytometry, gating on monocytes (CD14+ cells) or CCR5+ T cells (CD3+ cells), in PBMC cultured for 24 hours with rIFN-α alone or in presence of blocking antibodies against the cellular receptor for IFN-α (anti-IFNAR). Surface expression of PDL-1 (C), CD80 (D) and CD86 (E) analyzed by flow cytometry, gating on monocytes (CD14+ cells) or CCR5+ T cells (CD3+ cells), in PBMC cultured for 24 hours in presence of control microvescicles (Mock), AT-2 HIV alone or in presence of blocking antibodies against the cellular receptor for IFN-α (anti-IFNAR), as well as rIFN-α. Flow cytometry histograms for one example experiment are shown beside bar graphs, which summarize mean fluorescence intensity (MFI) obtained for the same conditions in five independent experiments. Mean values ± standard error are shown in the bar graphs. P<0.05 was considered statistically significant; NS = not significant
Subsequently, PBMC from HIV-uninfected donors were cultured with AT-2 HIV in presence or absence of antibodies blocking the cellular receptor for IFN-α (anti-IFNAR). Incubation with anti-IFNAR greatly reduced AT-2 HIV-induced PDL-1 on both monocytes (2-fold) and CCR5+ T cells (3-fold) (Fig. 4C). Thus, monocytes and CCR5+ T cells upregulate PDL-1 in response to IFN-α, and IFN-α is partially responsible for AT-2 HIV-induced PDL-1.
Type I IFN is required for AT-2 HIV-induced CD80, but not CD86 expression, on monocytes and CCR5+ T cells
We investigated whether expression of other surface proteins of the B7 family, namely B7.1 (CD80) and B7.2 (CD86), was affected by AT-2 HIV in a type I IFN-dependent manner. Interestingly, anti-IFNAR reduced AT-2 HIV-induced expression of CD80 (Fig. 4D), but not CD86 (Fig. 4E), on monocytes and CCR5+ T cells. These results suggest that, although the expression of all the B7 molecules analyzed is increased by exposure to AT-2 HIV, CD86 differs from CD80 and PDL-1 in that its regulation is not strictly dependent on IFN-α.
Role of TLR agonists and endocytosis in PDL-1 induction
pDC are responsible for IFN-α production in AT-2 HIV-exposed PBMC [27] and HIV-mediated activation of pDC requires endocytosis [33]. Therefore, we investigated whether inhibition of endocytotic pathways by incubation with chloroquine, an inhibitor of endosomal acidification, would prevent AT-2 HIV-mediated PDL-1 induction. Chloroquine prevented the increase of PDL-1 expression induced by AT-2 HIV in both monocytes and CCR5+ T cells (Fig. 5A). We then tested whether other stimuli which induce IFN-α could mimic the effect of AT-2 HIV on PDL-1 expression. PBMC from HIV-1-uninfected donors were cultured in the presence of agonists of different TLR. We found that TLR9 agonists which target pDC to induce IFN-α production (class A and class C CpG oligodeoxynucleotide (ODN) [34; 35]), but not those targeting B cells (class B CpG ODN [36]), also induced increased expression of PDL-1 on monocytes (Fig. 5B and 5C). Similarly, agonists targeting TLR7 (3M-001), TLR8 (3M-002) or TLR7/8 (3M-011), which also induced IFN-α production (Fig. 5B), resulted in upregulation of PDL-1 on monocytes (Fig. 5C). Surprisingly, when CCR5+ T cells were analyzed under the same conditions, we found a bimodal distribution of PDL-1 expression after TLR stimulation (Fig. 5C). However, when CCR5 and PDL-1 expression were analyzed simultaneously on T cells from PBMC treated with TLR agonists, we observed that PDL-1 was upregulated only on T cells with the highest levels of CCR5 expression (Fig. 5D). Thus, although TLR agonists and HIV induced a different pattern of PDL-1 expression on T cells, in both cases high expression of CCR5 was characteristic of the subpopulation of T cells which upregulate PDL-1. TLR9-, TLR7- and AT2-HIV-dependent increases of PDL-1 expression were also observed in mDC (Lin1−/HLA-DR+/CD11c+) and pDC (Lin1−/HLA-DR+/CD123+) (data not shown), confirming previous reports of IFN-α- and TLR-induced PDL-1 on mDC [20] and pDC [37], respectively. Notably, PDL-1 induction in response to AT-2 HIV or TLR agonists was also observed at the mRNA expression level in unseparated PBMC (data not shown), suggesting that PDL-1 upregulation involves modulation of gene expression. Thus, exposure to stimuli which activate pDC, similar to HIV, may lead to upregulation of PDL-1 on monocytes and CCR5+ T cells via mediation by type I IFN. These results also clarify why also CD8 T cells, which do not directly interact with HIV, upregulated PDL-1 upon exposure of PBMC to HIV. Thus, HIV-induced type I IFN production is sufficient to induce PDL-1 upregulation in the CCR5-expressing subset of T cells, independent of whether they express CD4 and directly interact with the virus.
Figure 5. AT-2 HIV-induced PDL-1 is endocytosis-dependent and can be mimicked by TLR agonists which induce IFN-α production.
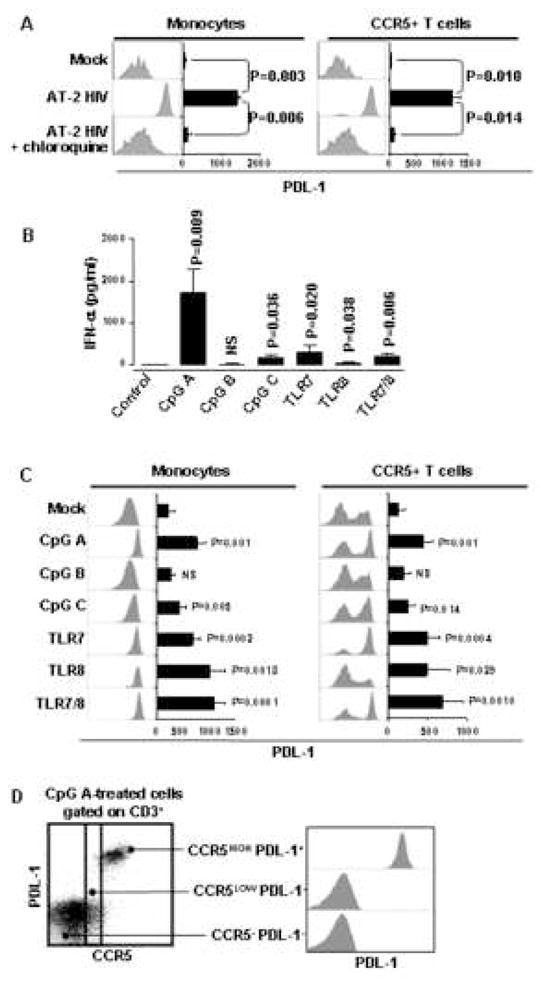
(A) Surface expression of PDL-1 analyzed by flow cytometry, gating on monocytes (CD14+ cells) or CCR5+ T cells (CD3+ cells), in PBMC cultured for 24 hours in presence of control microvescicles (Mock), AT-2 HIV alone or in presence of chloroquine. (B) Detection of IFN-α by ELISA in supernatants from PBMC cultured in presence or absence of different TLR agonists. (C) Surface expression of PDL-1 analyzed by flow cytometry, gating on monocytes (CD14+ cells) or CCR5+ T cells (CD3+ cells), in PBMC cultured for 24 hours in presence or absence of different TLR agonists. (D) Left panel: dot plot flow cytometry graph of one example experiment showing staining for PDL-1 and CCR5 on gated T cells (CD3+ cells) from PBMC cultured for 24 hours in presence of the TLR9 agonist class A CpG ODN; right panel: detail of PDL-1 expression shown by flow cytometry histograms in the three populations of T cells defined in the left panel according to different patterns of CCR5 expression. In (A) and (C) flow cytometry histograms for one example experiment are shown beside bar graphs, which summarize mean fluorescence intensity (MFI) obtained for the same conditions in five independent experiments. Mean values ± standard error are shown in the bar graphs in (A), (B), (C). All P values indicated in (B) and (C) refer to comparison with the control. P<0.05 was considered statistically significant; NS = not significant.
IFNAR2 expression is restricted to CCR5-expressing leukocytes
Because we found that HIV-induced IFN-α had an effect only on certain leukocytes subsets, we analyzed the expression of the IFN-α-specific subunit of the IFN-α/β receptor IFNAR2 in relation to CCR5. We found that monocytes, which express CCR5, and CCR5+ T cells stained positive for IFNAR2, both in presence and in absence of HIV (Fig. 6A). Therefore, the MFI of IFNAR2 staining was significantly higher in CCR5+ T cells compared to their CCR5− counterpart, irrespective of exposure to HIV (Fig. 6B). No IFNAR2 expression was detected on B cells and no difference in IFNAR2 expression was observed between CCR5+ CD8+ and CCR5+ CD4+ T cells (data not shown), confirming that T cell sensitivity to IFN-α/β signaling, rather than direct interaction with the virus through gp120-CD4 engagement, accounts for their susceptibility to PDL-1 upregulation.
Figure 6. IFNAR2 expression is restricted to CCR5-expressing cells.
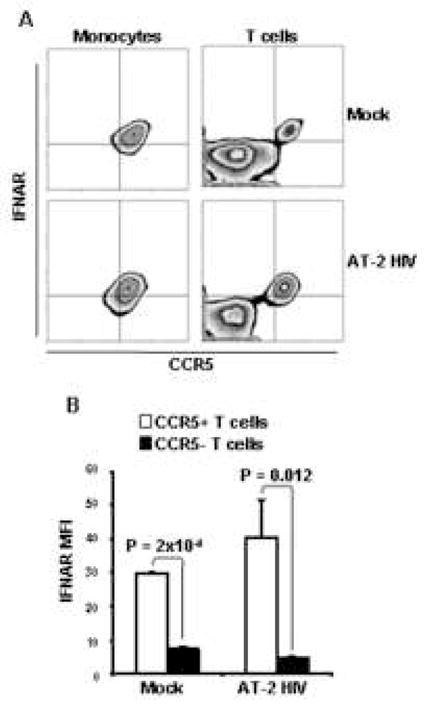
A) Flow cytometry contour plots showing CCR5 and IFNAR2 expression on monocytes (CD14+ cells; left panels) and T cells (CD3+ cells; right panels) from PBMC exposed to mock (upper panels) or AT-2 HIV (lower panels). One example of three independent experiments is shown. B) Bar graphs showing MFI of IFNAR2 staining in CCR5+ CD3+ cells (open bars) and CCR5− CD3+ cells (solid bars) from PBMC exposed to mock or AT-2 HIV. Mean values ± standard error are shown.
HIV-induced PDL-1 inhibits T cell proliferation
We tested whether AT-2 HIV-induced PDL-1 exerted inhibitory activity in the context of T cell stimulation. Therefore, CFSE-labeled PBMC from three HIV-uninfected donors were cultured in the presence or absence of AT-2 HIV for 24 hours. These cells were then stimulated with anti-CD3 (OKT3) antibodies, in presence of antibodies blocking PDL-1 (anti-PDL-1) or isotype control antibodies. Proliferation of CD4+ and CD8+ T cells was evaluated after 3 days by CFSE dilution. Pre-treatment with AT-2 HIV significantly inhibited proliferation of both CD4 and CD8 T cells, expressed by both division and proliferation indices (Fig. 7A, upper panels and Fig. 7B). Anti-PDL-1 significantly increased the proliferation of CD4 and CD8 T cells in AT-2 HIV-pretreated PBMC (Fig. 7A, lower panels and Fig. 7B). Considered together, these data suggest that HIV-induced PDL-1 exerts a downmoduatory effect on CD4 and CD8 T cell function.
Figure 7. AT-2 HIV-induced PDL-1 inhibits CD4 and CD8 T cell proliferation.
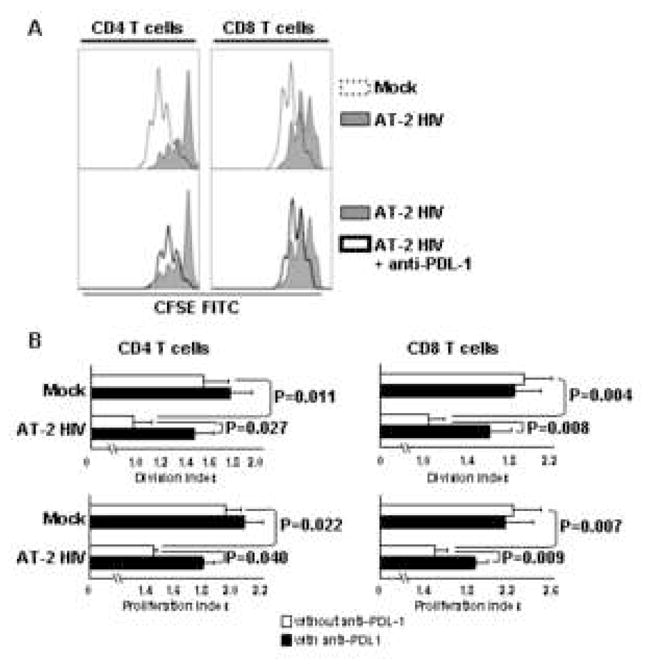
PBMC from three different donors were cultured with AT-2 HIV or control microvescicles (Mock). After 24 hours, T cell proliferation was induced by addition of anti-CD3 Ab, in presence or absence of blocking antibodies against PDL-1 (anti-PDL-1). Dilution of the CFSE staining was analyzed by flow cytometry for CD4+ and CD8+ T cells (CD3+ cells). A) Upper panels: flow cytometry histograms showing proliferative responses of CD4 (left panel) and CD8 T cells (right panel) in PBMC pre-treated with AT-2 HIV (tinted line) or mock (dotted line). Lower panels: flow cytometry histograms showing proliferative responses of CD4 (left panel) and CD8 T cells (right panel) in PBMC pre-treated with AT-2 HIV and stimulated in presence (heavy line) or absence (tinted line) of anti-PDL-1. One representative of 3 independent experiment is shown. B) Bar graphs showing division index (number of cell divisions/total cell number) and proliferation index (number of cell divisions/number of divided cells) of CD4 (left panels) and CD8 T cells (right panels) pretreated with AT-2 HIV or mock and stimulated with anti-CD3 in presence (solid bars) or absence (open bars) of anti-PDL-1. Mean values ± standard error are shown.
DISCUSSION
Increased expression of PD-1 contributes to the impairment of cytotoxic function of HIV-specific CD4+ and CD8+ T cells in HIV-infected individuals [17; 18; 19; 21]. The inhibitory effect of PD-1 requires engagement by its ligand PDL-1, which we previously reported to be increased in monocytes, B cells and T cells during HIV infection [22]. Here we show that exposure of PBMC from HIV-uninfected donors to reverse-transcription deficient AT-2 HIV, or to its infectious counterpart, activates PDL-1 expression on monocytes and CCR5+ T cells. Type I IFN, rather than IFN-γ, was required for HIV-mediated PDL-1 induction and other stimuli inducing IFN-α production, as well as rIFN-α, resulted in similar PDL-1 upregulation. The restriction of IFNAR2 expression to CCR5+ monocytes and CCR5+ T cells may explain the selective effect of IFN-α on to these cell subsets. Although AT-2 HIV exposure induced production of low levels of IFN-γ (<50pg/ml), no increase of PDL-1 expression was observed when rIFN-γ was used at a similar concentration (10–100 pg/ml) to stimulate PBMC, suggesting that AT-2 HIV-induced IFN-γ may not reach levels sufficient to induce PDL-1 expression. This finding is particularly interesting in the setting of HIV infection, during which immune responses associated with IFN-γ production are progressively impaired [15; 16; 24; 25], while high levels of IFN-α can be detected in both plasma and lymphoid tissues during different stages of the disease [38; 39] and may contribute to the increased levels of PDL-1 reported herein and in our previous study [22]. In addition, inhibition of endosomal acidification, which is required for HIV-mediated activation of pDC and IFN-α production [33], also prevented PDL-1 upregulation. Interestingly, PDL-1 expression was not upregulated on B cells in the presence of AT-2 HIV, nor did B cells express detectable levels of IFNAR2, suggesting that the increased PDL-1 expression observed in vivo in these cells [22] is the consequence of other immunologic events occurring during the infection. The necessity for production of IFN-α/β in response to HIV explains why upregulation of PDL-1 was observed in both CD4 and CD8 T cell subsets. Thus, although CD8 T cells do not interact directly with HIV via gp120-CD4 engagement, they are responsive to type I IFN signaling, provided that they express IFNAR2. However, the gp120-CD4 interaction was shown to be strictly required for HIV to activate pDC and induce IFN-α/β production[33; 40].
The subset of T cells which upregulated PDL-1 after treatment of PBMC with IFN-α-inducing stimuli, including HIV, presented the unexpected CCR5-expressing phenotype. The CCR5+ phenotype of PDL-1 expressing T cells was confirmed by analysis of PBMC from a group of HIV-infected patients and could be explained by the fact that IFNAR2 expression is restricted to the CCR5+ subset of T cells. The selective expression of IFNAR2 in this T cell subset may have interesting implications in the setting of HIV infection. Indeed, CCR5+ memory CD4+ T cells are the main target for HIV infection during the acute phase of the disease, in particular at lymphoid and mucosal sites where this population is enriched [31; 41; 42; 43; 44]. The extensive depletion of CCR5+ CD4+ T cells during acute infection was suggested to be caused by direct cytopatic infection or by CD8+ T cell-mediated killing [31; 41; 44; 45; 46; 47]. Interestingly, the characteristic expression of IFNAR2 by CCR5+ CD4+ T cells may render them particularly susceptible to IFN-α-induced apoptotic mechanisms [48; 49], contributing to their loss. Furthermore, a recent report demonstrates that the frequency of CCR5+ CD4 T cells is reduced in non-human primate natural hosts of HIV and SIV, compared to the disease-susceptible hosts [50]. It is therefore possible to speculate that disease-resistant species may be characterized by a reduced number of IFNAR2-expressing CD4 T cells, and therefore less IFN-α-sensitive CD4 T cells.
Exposure to AT-2 HIV resulted in increased expression of CD80 and CD86 on both monocytes and activated T cells. Both pDC and mDC in HIV-infected patients express high levels of CD80 and CD86, and can be further activated by TLR engagement [51]. Similar increases in the expression of costimulatory molecules have been reported on circulating T cells during HIV-1 infection [52; 53; 54; 55] and are considered to be the consequence of chronic T cell activation. Our data provide an alternate, non-exclusive explanation suggesting that, even in the absence of productive infection and/or chronic antigen presentation, exposure of blood cells to HIV virions can drive the expression of costimulatory molecules, and that this effect is IFN-α-dependent in the case of CD80, but not CD86. The difference in CD86 regulation may partially explain our previous finding that CD80 mRNA, but not CD86 mRNA, was increased in tonsils from chronically HIV-infected patients not receiving antiretroviral therapy [56]. In fact, in a separate study we found high IFN-α production in tonsils of untreated patients from the same cohort [38]. IFN-α production in lymphoid tissue may drive preferential expression of CD80 and PDL-1, rather than CD86. Although in vitro both CD80 and CD86 bind CTLA-4 with higher affinity than CD28, CD80 was suggested to interact mainly with CTLA-4 in vivo, exerting immune downregulatory function [57]. In addition, recent work by Butte and colleagues highlighted a new possible mechanism of PDL-1/B7-mediated downmodulation of T cell activity [58]. Thus, PDL-1 and CD80 can directly engage each other, resulting in a bidirectional interaction which ultimately inhibits T cell activation, overlapping with the effects of CTLA-4-B7 and PDL-1-PD-1 interactions [58]. Therefore, it is possible that type I IFN production in response to HIV may lead to the preferential expression of negative costimulatory regulators (CD80 and PDL-1), which may consequently dampen T cell responses.
Defective allo-antigen presentation has long been known in APC from HIV-infected individuals [59]. The impairment of antigen-presenting function may be the consequence of two non-mutually exclusive mechanisms: 1) downregulation of activating signals, such as MHC expression and positive costimulators; and/or 2) upregulation of suppressive factors. Here we provide evidence that innate immune functions, such as the HIV-induced activation of pDC to produce type I IFN [27], may lead to the generation of a suppressive phenotype in certain APC, partially accounting for the known defects in their immune stimulatory capacity. This hypothesis is consistent with our findings that anti-PDL-1 improved the proliferative responses of both CD4 and CD8 T cells after exposure to AT-2 HIV.
In the setting of a chronic infection such as HIV, during which constant immune stimulation may contribute to the exhaustion of T cell function [20; 25], the combined effect of deficient antigen-presentation capacity and T cell dysfunction could allow for the establishment and maintenance of viral reservoirs protected from efficient immune responses and increase the susceptibility to secondary infection, typical of immunodeficient individuals. The PD-1/PDL-1 system may play an important role in this dysfunction, and may be considered as a therapeutic target not only to improve anti-HIV immune responses, but also to ameliorate the immune function in response to other pathogens in HIV-infected individuals.
Acknowledgments
This research was supported by the Intramural research Program of the CCR, NCI and by the Intramural AIDS Targeted Antiviral Program (IATAP).
We thank Dr. Jeffrey D. Lifson (AVP, NCI-Frederick, SAIC, Frederick, MD) for the kind gift of AT-2-treated and non-AT-2 treated HIV.
Footnotes
AUTHORS’ CONTRIBUTION
A. Boasso designed and performed research, analyzed data and wrote paper; A.W. Hardy designed and performed research, analyzed data and wrote paper; A.L. Landay designed research and analyzed data; J.L. Martinson performed research; S.A. Anderson contributed vital reagents; M.J. Dolan contributed vital reagents; M. Clerici analyzed data; G.M. Shearer designed research, analyzed data and wrote paper.
Publisher's Disclaimer: This is a PDF file of an unedited manuscript that has been accepted for publication. As a service to our customers we are providing this early version of the manuscript. The manuscript will undergo copyediting, typesetting, and review of the resulting proof before it is published in its final citable form. Please note that during the production process errors may be discovered which could affect the content, and all legal disclaimers that apply to the journal pertain.
References
- 1.Greenwald RJ, Freeman GJ, Sharpe AH. The B7 family revisited. Annu Rev Immunol. 2005;23:515–48. doi: 10.1146/annurev.immunol.23.021704.115611. [DOI] [PubMed] [Google Scholar]
- 2.Lespagnard L, Mettens P, Urbain J, Moser M. Role of B7 costimulation in the induction of T and B cell responses by dendritic cells in vivo. Adv Exp Med Biol. 1997;417:529–33. doi: 10.1007/978-1-4757-9966-8_87. [DOI] [PubMed] [Google Scholar]
- 3.Dong H, Zhu G, Tamada K, Chen L. B7-H1, a third member of the B7 family, co-stimulates T-cell proliferation and interleukin-10 secretion. Nat Med. 1999;5:1365–9. doi: 10.1038/70932. [DOI] [PubMed] [Google Scholar]
- 4.Dolan MJ, Clerici M, Blatt SP, Hendrix CW, Melcher GP, Boswell RN, Freeman TM, Ward W, Hensley R, Shearer GM. In vitro T cell function, delayed-type hypersensitivity skin testing, and CD4+ T cell subset phenotyping independently predict survival time in patients infected with human immunodeficiency virus. J Infect Dis. 1995;172:79–87. doi: 10.1093/infdis/172.1.79. [DOI] [PubMed] [Google Scholar]
- 5.Sharpe AH, Wherry EJ, Ahmed R, Freeman GJ. The function of programmed cell death 1 and its ligands in regulating autoimmunity and infection. Nat Immunol. 2007;8:239–45. doi: 10.1038/ni1443. [DOI] [PubMed] [Google Scholar]
- 6.Tsushima F, Yao S, Shin T, Flies A, Flies S, Xu H, Tamada K, Pardoll DM, Chen L. Interaction between B7-H1 and PD-1 determines initiation and reversal of T-cell anergy. Blood. 2007 doi: 10.1182/blood-2006-11-060087. [DOI] [PMC free article] [PubMed] [Google Scholar]
- 7.Liu J, Hamrouni A, Wolowiec D, Coiteux V, Kuliczkowski K, Hetuin D, Saudemont A, Quesnel B. Plasma cells from multiple myeloma patients express B7-H1 (PD-L1) and increase expression following stimulation with IFN-{gamma} and TLR ligands via a MyD88-, TRAF6-, and MEK-dependent pathway. Blood. 2007 doi: 10.1182/blood-2006-10-051482. [DOI] [PubMed] [Google Scholar]
- 8.Schoop R, Wahl P, Le Hir M, Heemann U, Wang M, Wuthrich RP. Suppressed T-cell activation by IFN-gamma-induced expression of PD-L1 on renal tubular epithelial cells. Nephrol Dial Transplant. 2004;19:2713–20. doi: 10.1093/ndt/gfh423. [DOI] [PubMed] [Google Scholar]
- 9.Carter L, Fouser LA, Jussif J, Fitz L, Deng B, Wood CR, Collins M, Honjo T, Freeman GJ, Carreno BM. PD-1:PD-L inhibitory pathway affects both CD4(+) and CD8(+) T cells and is overcome by IL-2. Eur J Immunol. 2002;32:634–43. doi: 10.1002/1521-4141(200203)32:3<634::AID-IMMU634>3.0.CO;2-9. [DOI] [PubMed] [Google Scholar]
- 10.Tamura H, Dong H, Zhu G, Sica GL, Flies DB, Tamada K, Chen L. B7-H1 costimulation preferentially enhances CD28-independent T-helper cell function. Blood. 2001;97:1809–16. doi: 10.1182/blood.v97.6.1809. [DOI] [PubMed] [Google Scholar]
- 11.Blank C, Mackensen A. Contribution of the PD-L1/PD-1 pathway to T-cell exhaustion: an update on implications for chronic infections and tumor evasion. Cancer Immunol Immunother. 2007;56:739–45. doi: 10.1007/s00262-006-0272-1. [DOI] [PMC free article] [PubMed] [Google Scholar]
- 12.Yao S, Chen L. Reviving exhausted T lymphocytes during chronic virus infection by B7-H1 blockade. Trends Mol Med. 2006;12:244–6. doi: 10.1016/j.molmed.2006.04.007. [DOI] [PubMed] [Google Scholar]
- 13.Geng L, Jiang G, Fang Y, Dong S, Xie H, Chen Y, Shen M, Zheng S. B7-H1 expression is upregulated in peripheral blood CD14+ monocytes of patients with chronic hepatitis B virus infection, which correlates with higher serum IL-10 levels. J Viral Hepat. 2006;13:725–33. doi: 10.1111/j.1365-2893.2006.00746.x. [DOI] [PubMed] [Google Scholar]
- 14.Maier H, Isogawa M, Freeman GJ, Chisari FV. PD-1:PD-L1 interactions contribute to the functional suppression of virus-specific CD8+ T lymphocytes in the liver. J Immunol. 2007;178:2714–20. doi: 10.4049/jimmunol.178.5.2714. [DOI] [PubMed] [Google Scholar]
- 15.Hofmann B, Nishanian P, Baldwin RL, Insixiengmay P, Nel A, Fahey JL. HIV inhibits the early steps of lymphocyte activation, including initiation of inositol phospholipid metabolism. J Immunol. 1990;145:3699–705. [PubMed] [Google Scholar]
- 16.Janossy G, Borthwick N, Lomnitzer R, Medina E, Squire SB, Phillips AN, Lipman M, Johnson MA, Lee C, Bofill M. Lymphocyte activation in HIV-1 infection. I. Predominant proliferative defects among CD45R0+ cells of the CD4 and CD8 lineages. Aids. 1993;7:613–24. doi: 10.1097/00002030-199305000-00002. [DOI] [PubMed] [Google Scholar]
- 17.Brenchley JM, Price DA, Schacker TW, Asher TE, Silvestri G, Rao S, Kazzaz Z, Bornstein E, Lambotte O, Altmann D, Blazar BR, Rodriguez B, Teixeira-Johnson L, Landay A, Martin JN, Hecht FM, Picker LJ, Lederman MM, Deeks SG, Douek DC. Microbial translocation is a cause of systemic immune activation in chronic HIV infection. Nat Med. 2006;12:1365–71. doi: 10.1038/nm1511. [DOI] [PubMed] [Google Scholar]
- 18.Trautmann L, Janbazian L, Chomont N, Said EA, Gimmig S, Bessette B, Boulassel MR, Delwart E, Sepulveda H, Balderas RS, Routy JP, Haddad EK, Sekaly RP. Upregulation of PD-1 expression on HIV-specific CD8+ T cells leads to reversible immune dysfunction. Nat Med. 2006;12:1198–202. doi: 10.1038/nm1482. [DOI] [PubMed] [Google Scholar]
- 19.Petrovas C, Casazza JP, Brenchley JM, Price DA, Gostick E, Adams WC, Precopio ML, Schacker T, Roederer M, Douek DC, Koup RA. PD-1 is a regulator of virus-specific CD8+ T cell survival in HIV infection. J Exp Med. 2006;203:2281–92. doi: 10.1084/jem.20061496. [DOI] [PMC free article] [PubMed] [Google Scholar]
- 20.Chen L, Zhang Z, Chen W, Zhang Z, Li Y, Shi M, Zhang J, Chen L, Wang S, Wang FS. B7-H1 up-regulation on myeloid dendritic cells significantly suppresses T cell immune function in patients with chronic hepatitis B. J Immunol. 2007;178:6634–41. doi: 10.4049/jimmunol.178.10.6634. [DOI] [PubMed] [Google Scholar]
- 21.Cecchinato V, Tryniszewska E, Ma ZM, Vaccari M, Boasso A, Tsai WP, Petrovas C, Fuchs D, Heraud JM, Venzon D, Shearer GM, Koup RA, Lowy I, Miller CJ, Franchini G. Immune activation driven by ctla-4 blockade augments viral replication at mucosal sites in simian immunodeficiency virus infection. J Immunol. 2008;180:5439–47. doi: 10.4049/jimmunol.180.8.5439. [DOI] [PMC free article] [PubMed] [Google Scholar]
- 22.Trabattoni D, Saresella M, Biasin M, Boasso A, Piacentini L, Ferrante P, Dong H, Maserati R, Shearer GM, Chen L, Clerici M. B7-H1 is up-regulated in HIV infection and is a novel surrogate marker of disease progression. Blood. 2003;101:2514–20. doi: 10.1182/blood-2002-10-3065. [DOI] [PubMed] [Google Scholar]
- 23.Rosignoli G, Cranage A, Burton C, Nelson M, Steel A, Gazzard B, Gotch F, Imami N. Expression of PD-L1, a marker of disease status, is not reduced by HAART in aviraemic patients. Aids. 2007;21:1379–81. doi: 10.1097/QAD.0b013e3281de7296. [DOI] [PubMed] [Google Scholar]
- 24.Clerici M, Galli M, Bosis S, Gervasoni C, Moroni M, Norbiato G. Immunoendocrinologic abnormalities in human immunodeficiency virus infection. Ann N Y Acad Sci. 2000;917:956–61. doi: 10.1111/j.1749-6632.2000.tb05462.x. [DOI] [PubMed] [Google Scholar]
- 25.Lieberman J, Shankar P, Manjunath N, Andersson J. Dressed to kill? A review of why antiviral CD8 T lymphocytes fail to prevent progressive immunodeficiency in HIV-1 infection. Blood. 2001;98:1667–77. doi: 10.1182/blood.v98.6.1667. [DOI] [PubMed] [Google Scholar]
- 26.Rossio JL, Esser MT, Suryanarayana K, Schneider DK, Bess JW, Jr, Vasquez GM, Wiltrout TA, Chertova E, Grimes MK, Sattentau Q, Arthur LO, Henderson LE, Lifson JD. Inactivation of human immunodeficiency virus type 1 infectivity with preservation of conformational and functional integrity of virion surface proteins. J Virol. 1998;72:7992–8001. doi: 10.1128/jvi.72.10.7992-8001.1998. [DOI] [PMC free article] [PubMed] [Google Scholar]
- 27.Herbeuval JP, Hardy AW, Boasso A, Anderson SA, Dolan MJ, Dy M, Shearer GM. Regulation of TNF-related apoptosis-inducing ligand on primary CD4+ T cells by HIV-1: role of type I IFN-producing plasmacytoid dendritic cells. Proc Natl Acad Sci U S A. 2005;102:13974–9. doi: 10.1073/pnas.0505251102. [DOI] [PMC free article] [PubMed] [Google Scholar]
- 28.Montoya CJ, Jie HB, Al-Harthi L, Mulder C, Patino PJ, Rugeles MT, Krieg AM, Landay AL, Wilson SB. Activation of plasmacytoid dendritic cells with TLR9 agonists initiates invariant NKT cell-mediated cross-talk with myeloid dendritic cells. J Immunol. 2006;177:1028–39. doi: 10.4049/jimmunol.177.2.1028. [DOI] [PubMed] [Google Scholar]
- 29.Gorden KB, Gorski KS, Gibson SJ, Kedl RM, Kieper WC, Qiu X, Tomai MA, Alkan SS, Vasilakos JP. Synthetic TLR agonists reveal functional differences between human TLR7 and TLR8. J Immunol. 2005;174:1259–68. doi: 10.4049/jimmunol.174.3.1259. [DOI] [PubMed] [Google Scholar]
- 30.Boasso A, Herbeuval JP, Hardy AW, Anderson SA, Dolan MJ, Fuchs D, Shearer GM. HIV inhibits CD4+ T-cell proliferation by inducing indoleamine 2,3-dioxygenase in plasmacytoid dendritic cells. Blood. 2007;109:3351–9. doi: 10.1182/blood-2006-07-034785. [DOI] [PMC free article] [PubMed] [Google Scholar]
- 31.Mattapallil JJ, Douek DC, Hill B, Nishimura Y, Martin M, Roederer M. Massive infection and loss of memory CD4+ T cells in multiple tissues during acute SIV infection. Nature. 2005;434:1093–7. doi: 10.1038/nature03501. [DOI] [PubMed] [Google Scholar]
- 32.Muhlbauer M, Fleck M, Schutz C, Weiss T, Froh M, Blank C, Scholmerich J, Hellerbrand C. PD-L1 is induced in hepatocytes by viral infection and by interferon-alpha and -gamma and mediates T cell apoptosis. J Hepatol. 2006;45:520–8. doi: 10.1016/j.jhep.2006.05.007. [DOI] [PubMed] [Google Scholar]
- 33.Beignon AS, McKenna K, Skoberne M, Manches O, DaSilva I, Kavanagh DG, Larsson M, Gorelick RJ, Lifson JD, Bhardwaj N. Endocytosis of HIV-1 activates plasmacytoid dendritic cells via Toll-like receptor-viral RNA interactions. J Clin Invest. 2005;115:3265–75. doi: 10.1172/JCI26032. [DOI] [PMC free article] [PubMed] [Google Scholar]
- 34.Hartmann G, Battiany J, Poeck H, Wagner M, Kerkmann M, Lubenow N, Rothenfusser S, Endres S. Rational design of new CpG oligonucleotides that combine B cell activation with high IFN-alpha induction in plasmacytoid dendritic cells. Eur J Immunol. 2003;33:1633–41. doi: 10.1002/eji.200323813. [DOI] [PubMed] [Google Scholar]
- 35.McCluskie MJ, Krieg AM. Enhancement of infectious disease vaccines through TLR9-dependent recognition of CpG DNA. Curr Top Microbiol Immunol. 2006;311:155–78. doi: 10.1007/3-540-32636-7_6. [DOI] [PubMed] [Google Scholar]
- 36.Verthelyi D, Ishii KJ, Gursel M, Takeshita F, Klinman DM. Human peripheral blood cells differentially recognize and respond to two distinct CPG motifs. J Immunol. 2001;166:2372–7. doi: 10.4049/jimmunol.166.4.2372. [DOI] [PubMed] [Google Scholar]
- 37.Abe M, Wang Z, de Creus A, Thomson AW. Plasmacytoid dendritic cell precursors induce allogeneic T-cell hyporesponsiveness and prolong heart graft survival. Am J Transplant. 2005;5:1808–19. doi: 10.1111/j.1600-6143.2005.00954.x. [DOI] [PubMed] [Google Scholar]
- 38.Herbeuval JP, Nilsson J, Boasso A, Hardy AW, Kruhlak MJ, Anderson SA, Dolan MJ, Dy M, Andersson J, Shearer GM. Differential expression of IFN-alpha and TRAIL/DR5 in lymphoid tissue of progressor versus nonprogressor HIV-1-infected patients. Proc Natl Acad Sci U S A. 2006;103:7000–5. doi: 10.1073/pnas.0600363103. [DOI] [PMC free article] [PubMed] [Google Scholar]
- 39.von Sydow M, Sonnerborg A, Gaines H, Strannegard O. Interferon-alpha and tumor necrosis factor-alpha in serum of patients in various stages of HIV-1 infection. AIDS Res Hum Retroviruses. 1991;7:375–80. doi: 10.1089/aid.1991.7.375. [DOI] [PubMed] [Google Scholar]
- 40.Herbeuval JP, Grivel JC, Boasso A, Hardy AW, Chougnet C, Dolan MJ, Yagita H, Lifson JD, Shearer GM. CD4+ T-cell death induced by infectious and noninfectious HIV-1: role of type 1 interferon-dependent, TRAIL/DR5-mediated apoptosis. Blood. 2005;106:3524–31. doi: 10.1182/blood-2005-03-1243. [DOI] [PMC free article] [PubMed] [Google Scholar]
- 41.Brenchley JM, Schacker TW, Ruff LE, Price DA, Taylor JH, Beilman GJ, Nguyen PL, Khoruts A, Larson M, Haase AT, Douek DC. CD4+ T cell depletion during all stages of HIV disease occurs predominantly in the gastrointestinal tract. J Exp Med. 2004;200:749–59. doi: 10.1084/jem.20040874. [DOI] [PMC free article] [PubMed] [Google Scholar]
- 42.Guadalupe M, Reay E, Sankaran S, Prindiville T, Flamm J, McNeil A, Dandekar S. Severe CD4+ T-cell depletion in gut lymphoid tissue during primary human immunodeficiency virus type 1 infection and substantial delay in restoration following highly active antiretroviral therapy. J Virol. 2003;77:11708–17. doi: 10.1128/JVI.77.21.11708-11717.2003. [DOI] [PMC free article] [PubMed] [Google Scholar]
- 43.Estes JD, Li Q, Reynolds MR, Wietgrefe S, Duan L, Schacker T, Picker LJ, Watkins DI, Lifson JD, Reilly C, Carlis J, Haase AT. Premature induction of an immunosuppressive regulatory T cell response during acute simian immunodeficiency virus infection. J Infect Dis. 2006;193:703–12. doi: 10.1086/500368. [DOI] [PubMed] [Google Scholar]
- 44.Veazey RS, DeMaria M, Chalifoux LV, Shvetz DE, Pauley DR, Knight HL, Rosenzweig M, Johnson RP, Desrosiers RC, Lackner AA. Gastrointestinal tract as a major site of CD4+ T cell depletion and viral replication in SIV infection. Science. 1998;280:427–31. doi: 10.1126/science.280.5362.427. [DOI] [PubMed] [Google Scholar]
- 45.Little SJ, McLean AR, Spina CA, Richman DD, Havlir DV. Viral dynamics of acute HIV-1 infection. J Exp Med. 1999;190:841–50. doi: 10.1084/jem.190.6.841. [DOI] [PMC free article] [PubMed] [Google Scholar]
- 46.Borrow P, Lewicki H, Hahn BH, Shaw GM, Oldstone MB. Virus-specific CD8+ cytotoxic T-lymphocyte activity associated with control of viremia in primary human immunodeficiency virus type 1 infection. J Virol. 1994;68:6103–10. doi: 10.1128/jvi.68.9.6103-6110.1994. [DOI] [PMC free article] [PubMed] [Google Scholar]
- 47.Koup RA, Safrit JT, Cao Y, Andrews CA, McLeod G, Borkowsky W, Farthing C, Ho DD. Temporal association of cellular immune responses with the initial control of viremia in primary human immunodeficiency virus type 1 syndrome. J Virol. 1994;68:4650–5. doi: 10.1128/jvi.68.7.4650-4655.1994. [DOI] [PMC free article] [PubMed] [Google Scholar]
- 48.Herbeuval JP, Shearer GM. HIV-1 immunopathogenesis: how good interferon turns bad. Clin Immunol. 2007;123:121–8. doi: 10.1016/j.clim.2006.09.016. [DOI] [PMC free article] [PubMed] [Google Scholar]
- 49.Vilcek J. Boosting p53 with interferon and viruses. Nat Immunol. 2003;4:825–6. doi: 10.1038/ni0903-825. [DOI] [PubMed] [Google Scholar]
- 50.Kornfeld C, Ploquin MJ, Pandrea I, Faye A, Onanga R, Apetrei C, Poaty-Mavoungou V, Rouquet P, Estaquier J, Mortara L, Desoutter JF, Butor C, Le Grand R, Roques P, Simon F, Barre-Sinoussi F, Diop OM, Muller-Trutwin MC. Antiinflammatory profiles during primary SIV infection in African green monkeys are associated with protection against AIDS. J Clin Invest. 2005;115:1082–91. doi: 10.1172/JCI23006. [DOI] [PMC free article] [PubMed] [Google Scholar]
- 51.Martinson JA, Tenorio AR, Montoya CJ, Al-Harthi L, Gichinga CN, Krieg AM, Baum LL, Landay AL. Impact of class A, B and C CpG-oligodeoxynucleotides on in vitro activation of innate immune cells in human immunodeficiency virus-1 infected individuals. Immunology. 2007;120:526–35. doi: 10.1111/j.1365-2567.2007.02530.x. [DOI] [PMC free article] [PubMed] [Google Scholar]
- 52.Haffar OK, Smithgall MD, Bradshaw J, Brady B, Damle NK, Linsley PS. Costimulation of T-cell activation and virus production by B7 antigen on activated CD4+ T cells from human immunodeficiency virus type 1-infected donors. Proc Natl Acad Sci U S A. 1993;90:11094–8. doi: 10.1073/pnas.90.23.11094. [DOI] [PMC free article] [PubMed] [Google Scholar]
- 53.Kochli C, Wendland T, Frutig K, Grunow R, Merlin S, Pichler WJ. CD80 and CD86 costimulatory molecules on circulating T cells of HIV infected individuals. Immunol Lett. 1999;65:197–201. doi: 10.1016/s0165-2478(98)00107-2. [DOI] [PubMed] [Google Scholar]
- 54.Wolthers KC, Otto SA, Lens SM, Kolbach DN, van Lier RA, Miedema F, Meyaard L. Increased expression of CD80, CD86 and CD70 on T cells from HIV-infected individuals upon activation in vitro: regulation by CD4+ T cells. Eur J Immunol. 1996;26:1700–6. doi: 10.1002/eji.1830260806. [DOI] [PubMed] [Google Scholar]
- 55.Wyss-Coray T, Mauri-Hellweg D, Baumann K, Bettens F, Grunow R, Pichler WJ. The B7 adhesion molecule is expressed on activated human T cells: functional involvement in T-T cell interactions. Eur J Immunol. 1993;23:2175–80. doi: 10.1002/eji.1830230919. [DOI] [PubMed] [Google Scholar]
- 56.Andersson J, Boasso A, Nilsson J, Zhang R, Shire NJ, Lindback S, Shearer GM, Chougnet CA. The prevalence of regulatory T cells in lymphoid tissue is correlated with viral load in HIV-infected patients. J Immunol. 2005;174:3143–7. doi: 10.4049/jimmunol.174.6.3143. [DOI] [PubMed] [Google Scholar]
- 57.Sansom DM, Manzotti CN, Zheng Y. What’s the difference between CD80 and CD86? Trends Immunol. 2003;24:314–9. doi: 10.1016/s1471-4906(03)00111-x. [DOI] [PubMed] [Google Scholar]
- 58.Butte MJ, Keir ME, Phamduy TB, Sharpe AH, Freeman GJ. Programmed death-1 ligand 1 interacts specifically with the B7-1 costimulatory molecule to inhibit T cell responses. Immunity. 2007;27:111–22. doi: 10.1016/j.immuni.2007.05.016. [DOI] [PMC free article] [PubMed] [Google Scholar]
- 59.Clerici M, Landay AL, Kessler HA, Zajac RA, Boswell RN, Muluk SC, Shearer GM. Multiple patterns of alloantigen presenting/stimulating cell dysfunction in patients with AIDS. J Immunol. 1991;146:2207–13. [PubMed] [Google Scholar]