

Abstract
Despite clear epidemiological and genetic evidence for X-linked prostate cancer risk, all prostate cancer genes identified are autosomal. Here we report somatic inactivating mutations and deletion of the X-linked FOXP3 gene residing at Xp11.23 in human prostate cancer. Lineage-specific ablation of FoxP3 in the mouse prostate epithelial cells leads to prostate hyperplasia and prostate intraepithelial neoplasia. In both normal and malignant prostate tissues, FOXP3 is both necessary and sufficient to transcriptionally repress cMYC, the most commonly over-expressed oncogene in prostate cancer as well as among the aggregates of other cancers. FOXP3 is an X-linked prostate tumor suppressor in the male. Since the male has only one X chromosome, our data represents a paradigm of “single-genetic-hit” inactivation-mediated carcinogenesis.
Significance.
The study describes two significant advances. First, we demonstrate FOXP3 as an X-linked tumor suppressor gene in the male in both human and mice. Since male has only one X-chromosome, our work represents a compelling exception to the widely accepted “two-hit” theory for inactivation of tumor suppressor genes. Second, our work demonstrates FOXP3 as a major transcriptional repressor of c-MYC oncogene in the prostate. FOXP3 inactivation is necessary and sufficient for c-MYC over-expression, which is critical for molecular pathogenesis of prostate cancer.
Introduction
Genetic lesions of several autosomal tumor suppressor genes, including PTEN (Sansal and Sellers, 2004; Suzuki et al., 1998), NKX3.1 (Emmert-Buck et al., 1995; Vocke et al., 1996), and KLF6 (Bar-Shira et al., 2006; Narla et al., 2005; Narla et al., 2001) have been implicated in the molecular pathogenesis of prostate cancer patients. In addition, epidemiology studies have suggested a role for X-linked genes that control the susceptibility to prostate cancer (Monroe et al., 1995). While two loci, one in Xp11.22 (Gudmundsson et al., 2008) and one in Xq27-28 (Xu et al., 1998), have been implicated, the genes in these regions have not been identified. X-linked tumor suppressor genes are of particular interest as the majority of X-linked genes are dose compensated, making a single-hit sufficient to inactivate their functions (Spatz et al., 2004). While we and others have reported X-linked tumor suppressor genes, WTX1 (Rivera et al., 2007) and FOXP3 (residing at Xp11.23) (Zuo et al., 2007b) in female cancer patients, none have been identified for cancer in male patients.
In addition to inactivation of tumor suppressors, activation of proto-oncogenes also play a critical role in carcinogenesis. Among them, c-MYC (hereby called MYC) is known as one of the most commonly over-expressed oncogenes. MYC over-expression occurs in more than 30% of all human cancer cases studied (Grandori et al., 2000). However, the mechanism by which MYC transcription is increased in the prostate cancer remains unclear. In Burkitt’s lymphoma, the MYC locus is translocated into a constitutively active Ig locus (Dalla-Favera et al., 1982; Taub et al., 1982), which was found to lead to its transcriptional activation (Erikson et al., 1983). In lung cancer, high levels of gene amplification of the MYC locus have been documented (Wong et al., 1986), although such amplification occurred considerably less frequently than over-expression of MYC mRNA (Takahashi et al., 1989). Likewise, in breast and prostate cancer, upregulation of MYC mRNA was substantially more frequent than amplification of the MYC gene (Bieche et al., 1999) (Jenkins et al., 1997; Latil et al., 2000). Since MYC has been shown to be a target of β-catenin activation (He et al., 1998; Sansom et al., 2007), an appealing hypothesis is that MYC upregulation may be a manifestation of aberrant Wnt signaling, which occurs frequently in a variety of cancers (Fearon and Dang, 1999). However, a general significance of β-catenin-mediated MYC upregulation remains to be demonstrated (Kolligs et al., 1999) (Bommer and Fearon, 2007). Therefore, for the majority of cancer types, the genetic change involved in the aberrant MYC expression remained to be defined.
MYC over-expression in benign prostate hyperplasia and prostate cancer was documented over 20 year ago (Fleming et al., 1986). Ectopic expression of MYC causes hyperplasia of prostate tissue (Thompson et al., 1989). Further studies demonstrated that in combination, Myc and Ras could induce prostate cancer in mice (Lu et al., 1992). More recently, gene expression profiling of a mouse prostate cancer model induced by Myc transgene indicated similarity with human prostate cancer (Ellwood-Yen et al., 2003). Consistent with a role for MYC in the pathogenesis of prostate cancer, several whole genome scanning studies have strongly implicated a region 260 kb telomeric to the MYC gene in susceptibility to prostate cancer (Amundadottir et al., 2006; Gudmundsson et al., 2007; Haiman et al., 2007a; Haiman et al., 2007b; Witte, 2007; Yeager et al., 2007).
Here we investigated whether the FOXP3 gene is frequently inactivated in prostate cancer samples by deletion and somatic mutation. Moreover, we determined the significance of such inactivation by growth inhibition of normal and cancerous prostate cell lines and by identification of FOXP3 targets. The impact of prostate-specific ablation of the FoxP3 gene in the mouse was also tested.
Results
Somatic Inactivation of the FOXP3 locus in human prostate cancer samples
We first evaluated the expression of FOXP3 in both normal and malignant prostate tissues by immunohistochemistry. While our previous studies have demonstrated the expression of FoxP3 in the mouse prostate using an affinity purified anti-FoxP3 peptide antibody (Chen et al., 2008), the FOXP3 expression was not reported in either normal or malignant prostate tissues in human by immunohistochemistry (IHC), even though FOXP3 expression on infiltrating regulatory T cells was clearly detectable (Fox et al., 2007; Roncador et al., 2005). As the master regulator of regulatory T cells, FoxP3 is expressed there at levels comparable to house keeping genes such as GAPDH and HPRT (Fontenot et al., 2003; Hori et al., 2003). Since FoxP3 expression in prostate tissue is approximately 100-fold lower than what was found in regulatory T cells (Chen et al., 2008), we reasoned that the lack of detectable FOXP3 in normal prostate tissue may be caused by low sensitivity of staining and/or tissue processing conditions. Therefore, we first fixed the frozen tissues in 10% formalin for 8-12 hours and screened a large panel of commercially available anti-FOXP3 antibodies for their reactivity to endogenous FOXP3 in epithelial tissues. A shown in supplemental Fig. S1, anti-FOXP3 mAb stained prostate epithelial uniformly. However, compared with infiltrating lymphocytes, the level of FOXP3 is considerably lower (supplemental Fig. S2).
As summaried in supplemental Table S1, four of commercially available mAbs gave uniform staining of FOXP3 in normal prostate. The fact that multiple anti-FOXP3 mAbs reacted to FOXP3 demonstrated that FOXP3 is expressed at significant levels in normal prostate tissue. Among them, two (hFOXY and 236A/E7) were also tested and found to react specifically with FOXP3 protein in Western blot of lysates made from immortalized mammary epithelial cell line MCF-10A. The specificity of the reactivity to human FOXP3 was further confirmed by comparing reactivity of scrambled and FOXP3 ShRNA-transduced normal epithelial cell line MCF10A by Western blot and by IHC (supplemental Fig. S3).
Using the uniform fixation and processing conditions, we evaluated the expression of FOXP3 in 85 cases of normal and 92 cases of cancer tissues. As shown in Fig. 1A, immunohistochemistry with anti-FOXP3 mAb can detected nuclear FOXP3 staining in 100% of the normal prostate tissues tested. In contrast, only 31.5% of the prostate cancer samples show nuclear FOXP3 staining (P = 8.82 × 10⁻²¹). Perhaps due to harsher fixation conditions in preparing samples for tissue microarrays, the FOXP3 protein was generally difficult to detect by IHC, unless high concentrations of antibodies were used (data not shown). Using an extended antigen retrieval (37°C overnight following heating in microwave oven), we have obtained clear, albeit somewhat weaker staining from tissue microarray samples using low concentration of anti-FOXP3 mAb. However, 13% of normal tissues were not stained, presumably due to harsher fixation conditions. As shown in Fig. 1B, a significant reduction was observed among prostate cancer tissues. Furthermore, when the samples with PIN were compared with normal tissues, we observed a statistically significant reduction of FOXP3 expression in PIN (Supplemental Fig. S4A, B). Taken together, our data demonstrated that FOXP3 down-regulation is widespread in prostate cancer and that such down regulation may have occurred at an early stage of prostate cancer.
Fig. 1. Down-regulation of FOXP3 in prostate cancer.
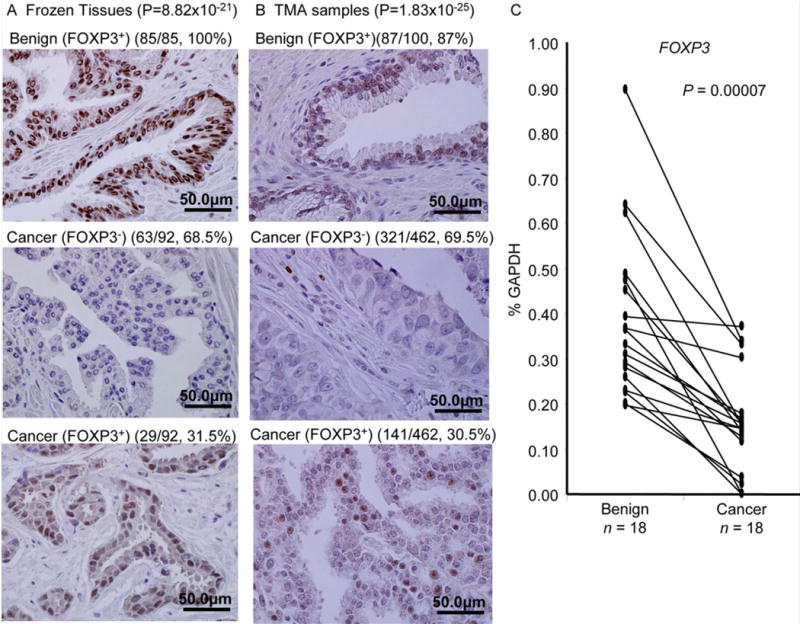
(A) and (B) Loss of FOXP3 expression in prostate cancer samples. Data show IHC data for FOXP3 expression in benign vs. cancerous tissue in either thawed frozen tissues after short-term formalin fixation (A) or TMA samples after an extended antigen retrival (B), using monoclonal anti-FOXP3 mAb (236A/E7, 1:100). Statistical significance was analyzed by Chi-square tests. (C) Down-regulation of FOXP3 transcripts in primary cancer tissue in comparison to normal prostate tissue from the same patients (P value by a Wilcoxon Two Sample Test). Data shows real-time PCR quantitation of microdissection samples from 18 cases. The relative amounts are expressed as a percentage of GAPDH.
We then used microdissection to obtain benign prostate tissue and cancer tissues from the same patients and compared the FOXP3 mRNA levels. Since inflammatory T cells are a major source of FOXP3 expression, we carefully avoided areas of inflammation for dissection. After normalizing against the house-keeping gene, 14/18 cases showed 2-10 fold reduction of FOXP3 mRNA in comparison to the benign tissues (Fig. 1C). Six of the 18 samples contain clearly identifiable PIN lesions. We therefore micro-dissected the PIN lesions and compared the levels FOXP3 mRNA transcript with normal and cancerous tissues. As shown in Fig. S4C, FOXP3 transcript is down regulated in PIN lesion. Thus, reduced FOXP3 expression is widespread among prostate cancer samples, perhaps starting at early stage of carcinogenesis.
We used fluorescence in situ hybridization (FISH) to determine FOXP3 gene deletion in the prostate cancer tissue. As shown in Fig. 2 and supplemental Table S2, 23 of 165 samples (13.9%) tested showed a deletion of the FOXP3 gene. Among them, 18 of the 23 cases had a single copy of the X chromosome. However, 5 out of the 23 cases showed an increase in the number of X-chromosomes. Interestingly, in cells with X polysomy and FOXP3 deletion, the deletion was complete in all X-chromosomes. Thus, X-chromosome duplications in cancer tissues likely occurred after deletion of FOXP3.
Fig. 2. Deletion of a FOXP3 among prostate cancer samples.
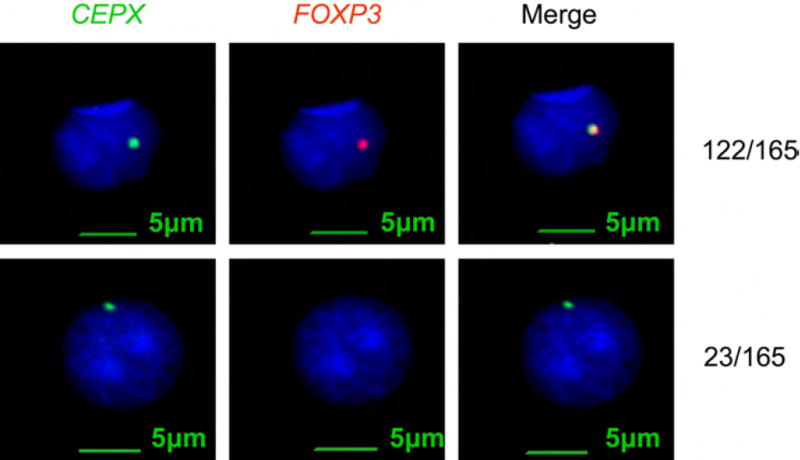
TMA and frozen samples were hybrized to the FOXP3 (red) or X-chromosome probe (green). Of 165 cases with informative FISH data, a total of 23 cases showed FOXP3 deletion.
In order to determine whether FOXP3 was somatically mutated in primary prostate cancer samples, we isolated cancerous and normal prostate tissues from the same patients and compared the DNA from exons and some exon-intron junctions. A summary of the data is shown in Fig. 3A and a representative chromatogram is shown in Fig. 3B, with other chromatograms provided in supplemental information Fig. S5. Our sequencing analyses demonstrate single base-pair changes in 5/20 samples tested (Table S3). Among them, four were missense mutations while one caused a change in intron 6. One of the missense mutation (K227R) was also reported in the breast cancer (Zuo et al., 2007b). The tumors with the intron 6 mutation showed reduced expression of FOXP3 (Fig. 3C). Among the five samples that contain FOXP3 mutation in cancer tissue, two contained identifiable PIN lesions. We therefore microdissected PIN lesion to determine if the same mutation can be found. As shown in Fig. S5, both samples had the same mutations in PIN and cancerous tissues.
Fig. 3. Somatic mutation of FOXP3 gene in prostate cancer samples.
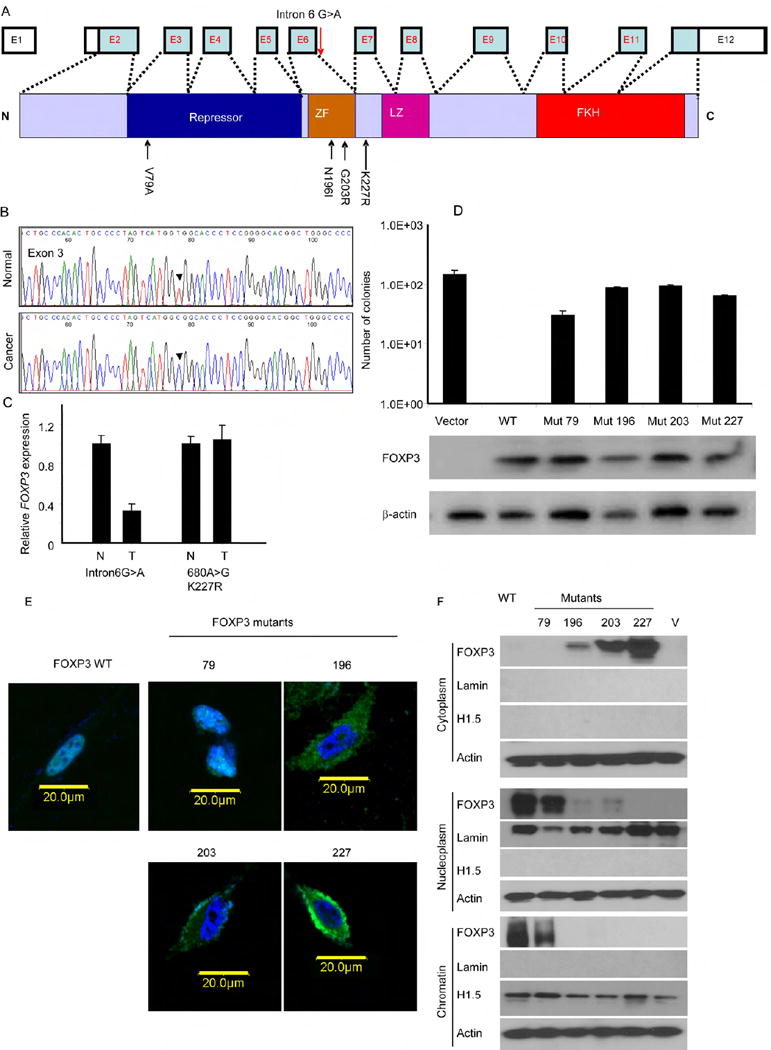
DNA samples from cancerous and benign tissues dissected from 20 cases of frozen prostate cancer tissues were amplified by PCR and sequenced. The somatic mutants were identified by comparing the DNA sequence of normal and cancerous tissues from the same patients. (A) Diagram of the FOXP3 gene showing the position of the somatic mutations identified. (B). A representative chromatogram showing mutation of FOXP3 in exon 3. (C) Partial inactivation of the FOXP3 locus in prostate cancer with an intronic mutation. Data shown are means and S.D. of relative levels of FOXP3 transcripts, with the levels of normal tissues defined as 1.0. This experiment has been repeated once. (D) Missense mutations of the FOXP3 gene abrogated inhibition of the colony formation of the prostate cancer cell line Du145 by FOXP3. Data shown are means and S.D. of colony numbers in 10 cm dishes (n=3). The expression of FOXP3 is presented underneath the bar graph. This experiment has been repeated at least 3 times. (E) Impact of missense mutations on nuclear translocation of FOXP3. WT and mutant FOXP3 were tagged with GFP at the N-termini and transfected into PC3 cell line. After drug selection to remove untransfected cells, the cells were stained with DAPI to visualize nuclei. Photos shown are merged DAPI and GFP images captured by confocal microscope. (F) Cellular localization of WT and mutant FOXP3 as measured by Western blot after cellular fractionation. The cellular fractions were subject to Western blot analysis with anti-FOXP3 mAb (Abcam, ab450) and marker proteins.
In order to substantiate tumor suppressor activity of FOXP3, we transfected FOXP3 cDNA into prostate cancer cell lines PC3, LNCaP, and Du145. Our data demonstrated strong growth inhibition by FOXP3 (supplemental Fig. S6, 7). Importantly, while vector-transfected LNCaP response to hormone 5α-dihydrotestosterone (5α-DHT), FOXP3 expression abrogated its stimulation by the hormone (Supplemental Fig. S7). The growth inhibition by wild-type (WT) FOXP3 provided an important functional test for the somatic mutants uncovered from the clinical samples. As shown in Fig, 3D, only WT FOXP3, but not any of the missense mutants, abrogated growth of prostate cancer cell line Du145. Similar data were obtained with another cell line PC3 (data not shown). Therefore, the somatic mutations of the FOXP3 are functionally inactivated.
FOXP3 is a transcriptional regulator that functions by interacting with DNA in the nuclei (Zuo et al., 2007b). As the first step to understand the mechanism by which the mutations in FOXP3 affect its function, we tagged the FOXP3 protein with the green fluorescence protein (GFP) at the N-terminus and visualized its intracellular localization by confocal microscopy. As shown in Fig 3E, three out of four somatic mutants disrupted its translocation into nuclei. To substantiate these obserations, we isolated cytoplasm, nucleoplasm, and chromatin from PC3 transcted with vector control, WT and somatic FOXP3 mutant cDNA and determined distribution of FOXP3 by Western blot. As shown in Fig. 3F, while WT FOXP3 and the V79A mutant resides in both the nucleoplasm and the chromatin, the overwhelming majority of the proteins encoded by other three missense mutants are excluded from the nucleus. Since these three mutations had a more severe impact on the growth inhibition by FOXP3, preventing nuclear localization of FOXP3 appear to be the major mechanism to inactivate the tumor suppressor function. To confirm that disruption of nuclear localization is sufficient to abrogate growth inhibition by FOXP3, we used site-directed mutagenesis to inactivate the known nuclear localization sequence of FOXP3. As shown in supplemental Fig. S8, mutation in nuclear localization sequence was sufficient to abrogate growth inhibition by FOXP3.
Prostate-specific deletion of FoxP3 caused precancerous lesions
To test the cell-intrinsic effect of FoxP3 deletion, we crossed the mice with a floxed FoxP3 locus (diagrammed in Fig. 4A) (Fontenot et al., 2005) to a transgenic line that expresses Cre gene under the probasin promoter (PB-Cre4) (Wu et al., 2001). Previous studies have demonstrated that this promoter causes prostate-specific deletion of Floxed genes starting in newborn mice (Wu et al., 2001). Using microdissected tissue samples of 8-12 week-old mice, we observed more than 80% deletion of the FoxP3 locus among the micro-dissected prostate epithelial tissue (Fig. 4B). The FoxP3 mRNA was reduced by more than 16-fold (Fig. 4C). The less profound reduction in DNA levels likely reflected the fact that our micro-dissected samples also contained non-epithelial cells that do not express FoxP3 (Chen et al., 2008). The reduction of FoxP3 protein is confirmed by Western blot using the lysates of total prostate (Fig. 4D) and immunohistochemistry staining (Fig. 4E). Consistent with the kinetics and levels of the PB-Cre4 transgene expression (Wu et al., 2001), the deletion is more complete in the ventral and lateral prostate lobes than in the anterior and dorsal lobes.
Fig. 4. Targeted deletion of FoxP3 in the the prostate.
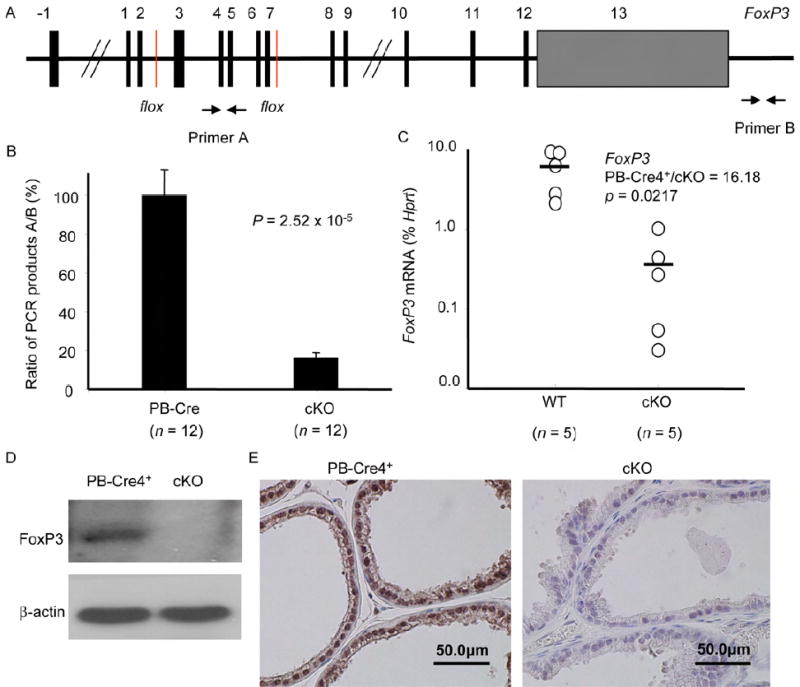
(A) Diagram of the floxed FoxP3 locus and the position of the primers used to measured the ratio of deleted vs. undeleted alleles. (B) Efficient deletion of the FoxP3 locus in the PB4-Cre+FoxP3flox/y (cKO) but not the PB-Cre4+FoxP3+/y transgenic mice (P value by an Independent-Samples t test). Data shown are means and SD of the ratio of product A/product B of DNA isolated from the micro-dissected prostate epithelium. (C) Targeted deletion of the FoxP3 locus caused dramatic reduction of FoxP3 transcripts in prostate tissue (P value by a Mann-Whitney U test). The RNA isolated from micro-dissected prostate epithelia were quantitated by real-time PCR. (D) Reduction in FoxP3 expression, as determined by Western blot with anti-FoxP3 mAb (hFOXY). Data shown were lysates of prostate tissues from PB-Cre4+FoxP3+/y and PB-Cre4+FoxP3flox/y mice. (E) Reduction of FoxP3 expression as determined by immunohistochemistry with a polyclonal rabbit anti-mouse FoxP3 antibodies (Poly6238). Staining of ventral prostate lobes are presented. Similar reduction in FoxP3 expression was also observed in lateral prostate. Significant, but less complete reduction in anterior and dorsal lobes was also found. Data in B-D were obtained from tissues of 8-12 weeks old mice, while those in E were obtained from 14-16 weeks old mice.
We took several approaches to determine the impact of prostate-specific deletion in the FoxP3 locus. First, we used magnetic resonance imaging (MRI) to monitor the prostate size in the live mice. As shown in Fig. 5A, 12-15 week-old mice with prostate-specific deletion of the FoxP3 locus had significant enlargement of the prostate. In comparison to WT, a 5-fold increase in the percentage of Ki67+ proliferating epithelial cells was observed in the mutant mice (Fig. 5B). Histological examination of the prostate revealed signs of prostate hyperplasia as early as 14-16 weeks in five out of six mutant mice. At 23-26-week old, 4/5 mutant mice but none of the six age-matched WT mice exhibited extensive hyperplasia (Fig. 5C and Fig. 6A). Early PIN was detectable at 23-26 weeks in a small fraction of ventral and dorsal prostate lobes with FoxP3 deletion, characterized by increased layers of epithelial cells and nuclear atypia (Fig. 5C and data not shown). By 43-60 weeks, all cKO mice examined had hyperplasia. Moreover, all but 1/9 cKO mice exhibited early PIN, including multiple layers of epithelial cells (Fig. 6B, C). The epithelial cells in this region had significantly enlarged nuclei, in comparison to either the single-layered epithelial cells in the same glandular structure (data not shown), or to those in the control mice (Fig. 6B, middle and lower panels). In most cases, the epithelia formed both papillary and tufting (Fig. 6C) patterns. Under high power, the luminal epithelial cells in these areas appeared transformed, as demonstrated by enlargement of nuclei, and more active nucleoli (Fig. 6C). In most mice, multiple PINs were found in the anterior, ventral and lateral prostate lobes, although the lesions are all focal in nature. All WT prostates have normal morphology through the course of the study. Therefore, targeted mutation of the FoxP3 gene in prostate tissue is sufficient to initiate the process of prostate cancer development.
Fig. 5. Prostate-specific deletion of FoxP3 in the prostate induces precancerous lesions.
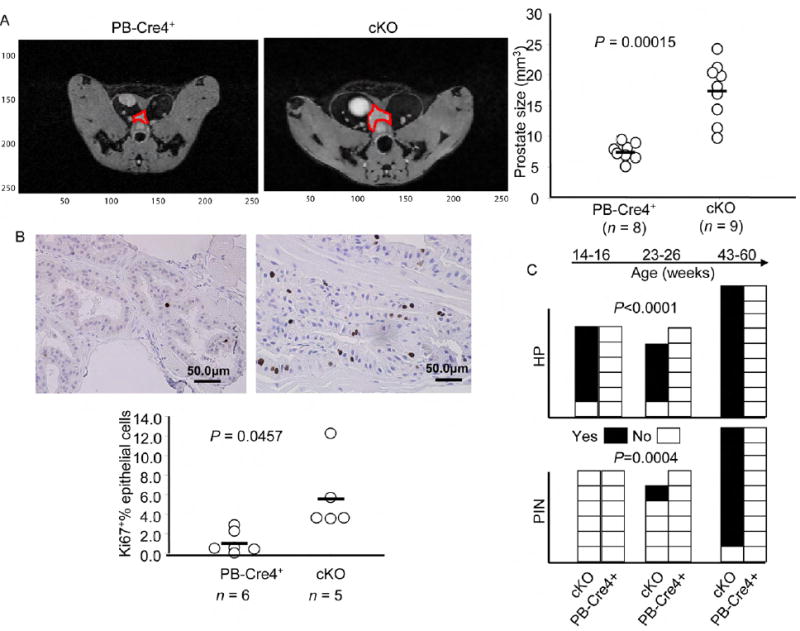
(A) FoxP3 deletion caused enlargement of prostates. The prostates of 12-15 week old age-matched WT and condition KO (cKO) mice were measured by magneticresonance imaging (MRI) (P value by an Independent-Samples t test). The images of a representative prostate from each group are shown in the left, while the prostate volumes of individual mice are shown in the right. (B) FoxP3 deletion led to increased proliferation of prostate epithelium, using expression of Ki67 as an indicator of proliferating cells (P value by a Mann-Whitney U test). Representative morphology and Ki67 staining are shown in the top and the %percentage of Ki67+ cells among the epithelial cells were shown in bottom. At least five 40X-field for each mice, at 14-16 weeks of ages, were counted. (C) Incidence of prostate hyperplasia (HP) and prostatic intraepithelial neoplasia (PIN) in cKO (PB-Cre4+FoxP3flox/y) and in WT (combining both PB-Cre4+FoxP3+/y and PB-Cre4-FoxP3flox/y). The statistical significance was determined by log-rank test.
Fig. 6. Histology data of hyperplasia and early PIN.
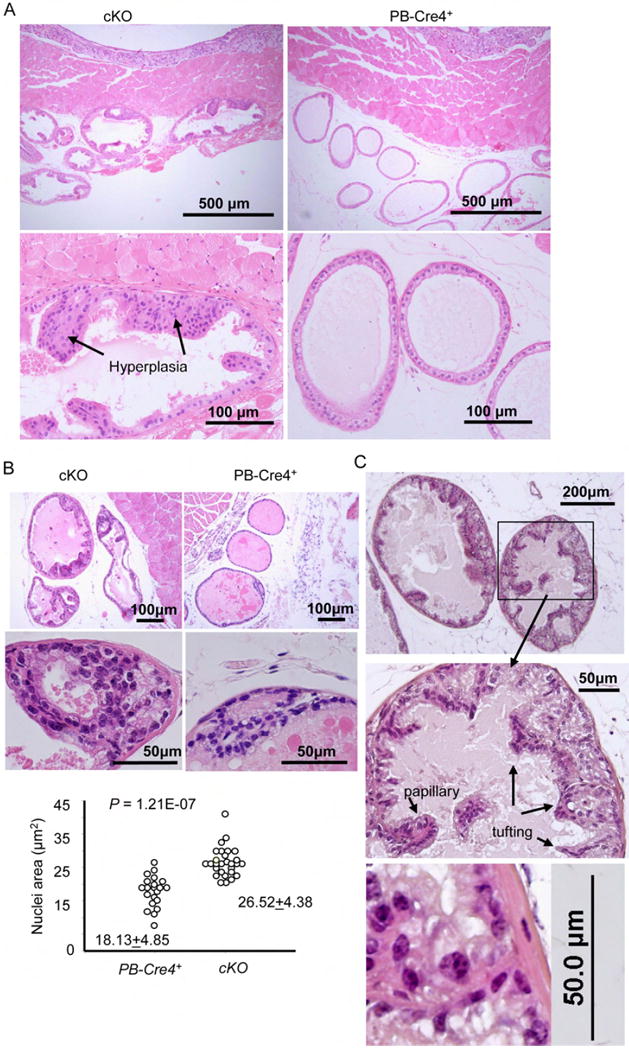
(A) Representative H&E staining of hyperplastic lesions in a 24 week old cKO ventral prostate sections. A 26 week old WT (PB-Cre4+FoxP3+/y) ventral prostate imagine is shown for comparison. (B) A representative early PIN lesion in ventral prostate of a 43-week old cKO mice. The image of an age-matched (PB-Cre4+FoxP3+/y) ventral prostate was included for comparison. Low (upper panels) and high (middle panels) power imagines are presented. The sizes of nuclei were determined by Scion Image software (Scion Corporation, Frederick, Maryland). (C) A PIN lesion in ventral prostate of a 60-weeks old cKO mice, showing the papillary and tufting. A high-power imagine showing enlarged nuclei and active nucleoli is presented in the lower panel.
FOXP3 is necessary and sufficient to repress expression of MYC
MYC is over-expressed in 80% of the prostate cancer samples starting as early as benign hyperplasia (Fleming et al., 1986). However, the mechanism by which MYC transcription is increased remains unclear. We tested if MYC upregulation correlates with down-regulation of the FOXP3 transcripts. We measured the levels of the mRNA transcripts from microdissected cancerous and benigh tissues from 18 patients by real-time PCR. We normalized the transcript levels in cancer tissue against the normal epithelial from the same patients in order to avoid differential RNA degradation under different sample procurement conditions. We observed an increased MYC expression in 15/18 cases. Importantly, a significant correlation was observed between FOXP3 down-regulation and MYC over-expression among malignant tumor samples (Fig. 7A). When the levels of normal and cancer tissues were compared separately, a negative correlation between FOXP3 and MYC levels were found in cancer but not normal samples (Supplemental data Fig. S9). To test the relevance of this observation in human prostate cells, we tested the effect of the FOXP3 shRNA on MYC expression in early passage primary human prostate epithelial cells. Normal prostate cell culture grew slowly and expressed low levels of MYC. ShRNA silencing increased the growth rate of the culture (Supplemental Fig. S10). As shown in Fig. 7B, FOXP3 shRNA caused a major reduction in the expression of FOXP3 mRNA and protein. Correspondingly, the level of MYC transcripts and protein were significantly elevated by FOXP3 shRNA. To test whether the correlation could be causative and independent of cancer development in vivo, we microdissected normal WT and FoxP3-deleted prostate tissues and compare the Myc transcript levels. As shown in Fig 7C, prostate deletion of the FOXP3 locus caused more than a 4-fold increase in Myc mRNA. Moreover, the increased transcript levels were also reflected in elevation of the Myc protein in the nuclei (Fig. 7D). These data demonstrated that FoxP3 is a necessary repressor for the Myc locus.
Fig. 7. FOXP3 is both necessary and sufficient to repress the MYC oncogene.
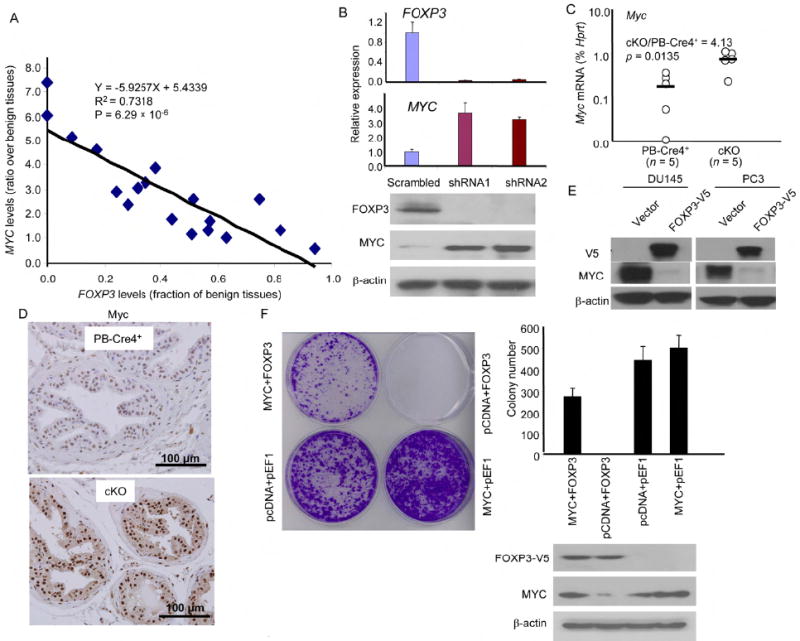
(A) Inverse correlation between FOXP3 and MYC expression in primary prostate cancer tissues. Statistical significance by observed by using a linear regression model. Data shown are ratio of transcript levels of tumor over benign prostate tissues from the same patients after they were normalized to house keeping genes. Data from quantitative real-time PCR in 18 cases are presented. (B) ShRNA silencing of FOXP3 resulted in upregulation of MYC expression in primary HPEC. Early passage HPEC were infected with retroviral vector expressing either control or FOXP3 shRNA. The uninfected cells were removed by drug selection. At one week after infection the levels of FOXP3 or MYC mRNA were quantitated by real-time PCR. The levels were normalized against GAPDH and those in the control group were defined as 1.0. Data shown were the means and S.D. of triplicates and were repeated two times. The lower panel shows the levels of FOXP3 and MYC proteins as revealed by Western blot. (C) Targeted deletion of the FoxP3 locus caused elevation of the Myc transcripts in mouse prostate tissue (P value by a Mann-Whitney U test). The RNA isolated from micro-dissected prostate epithelia, from 8-12 weeks old mice, were quantitated by real-time PCR. Data shown are relative levels of Myc mRNA, expressed as a percentage of Ck19 mRNA. (D) Immunohistochemistry analysis of Myv expression in PB-Cre4+ and cKO prostate. Data shown are imagines from dorsal lobes. A comparable elevation was observed in all four lobes. (E) Ectopic expression of FOXP3 into prostate cancer cell lines repressed MYC expression. PC3 and Du145 cell lines were transfected with V5-tagged FOXP3. After removal of uninfected cells by drug selection, the total cell lysates were analyzed for expression of FOXP3-V5, MYC, and β-actin as loading control. (F) Transfection with MYC cDNA prevents FOXP3-mediated growth inhibition. In addition to either control or FOXP3 cDNA, the tumor cell lines were infected either control vector or MYC plasmid. A representative photograph of cell growth after crystal violet staining is shown on the left; representative data from one of four experiements using the Du145 cell line are presented in the right. Data shown are means and S.D. of colony numbers in 6 cm dishes (n=3). The levels of FOXP3 and MYC proteins are shown underneath the bar graph. Similar rescue was also found when the PC3 cell line was used (data not shown).
To test whether ectopic expression of FOXP3 is sufficient to repress MYC, we transfected two prostate cancer cell lines with FOXP3. As shown in Fig. 7E, FOXP3 transfection almost completely abrogated the expression of MYC in both cell lines. In order to determine whether the growth inhibiton was mediated by repression of MYC, we co-transfected FOXP3 with MYC cDNA into Du145 cells. The cells were transfected with either pcDNA6-blasticidin vector or MYC cDNA (comprising of the entire coding region but no untranslated regions) and either the pEF1-G418 vector or FOXP3 cDNA. As shown in Fig. 7F, ectopic expression of MYC overcome FOXP3-mediated tumor suppression. These data demonstrated that MYC repression explains the growth inhibition of FOXP3, at least for established prostate cancer cell line.
Molecular mechanisms for FOXP3-mediated MYC repression and for somatic inactivation of FOXP3
To understand the mechanism by which FOXP3 represses MYC, we used ChIP to identify the site of FOXP3 binding in the MYC promoter. As shown in Fig. 8A, quantitative PCR analysis indicated that despite the abundance of forkhead binding sites, a strong binding of FOXP3 centered around -0.2 kb 5’ of the first transcription starting site (TSS-P1). To test the significance of this site for the repression, we carried out a deletional analysis to map the region that conveys susceptibility to FOXP3 repression. As shown in Fig. 8B, little repression by FOXP3 can be observed when the reporter was truncated before the forkead binding site at the -0.2 kb region (F1-F2). Strong inhibition was observed when the binding motif was included (F3-F5). Additional sequences did not increase the efficiency of repression. Sequence alignment revealed a conserved forkhead-binding site surrounding the promoter region with the highest ChIP signal (Fig. 8C). When the site was either deleted or mutated, the repression was completely abrogated (Fig. 8C). These data demonstrated that FOXP3 represses MYC promoter activity by interacting with the forkhead motif at the -0.2 kb 5’ of the MYC TSS.
Fig. 8. Molecular mechanism for MYC repression by FOXP3 and its inactivation by mutations in cancer.
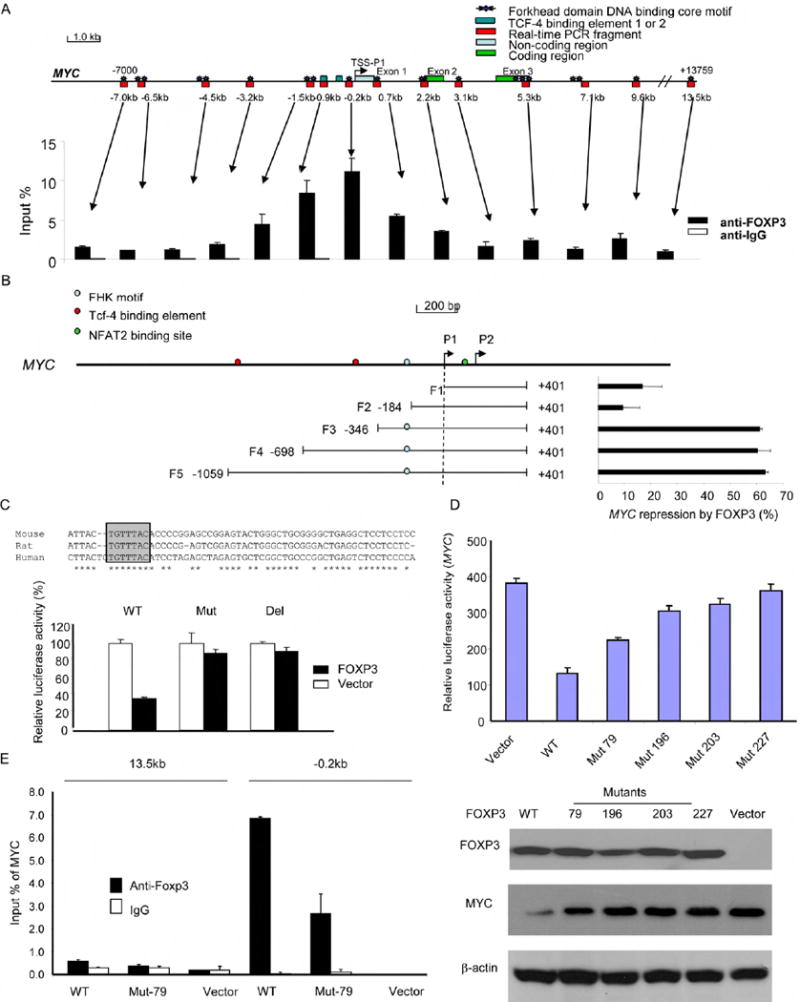
(A) Identification of a FOXP3 binding site in the 5’ region of the MYC gene. The top panel is a diagram of the MYC gene (Bossone et al., 1992), with the Forkhead consensus motifs and the areas covered by PCR primers marked. The distance related to the transcriptional starting site (TSS) are shown. The lower panel shows the amounts of DNA precipitated, expressed as a percentage of input DNA. Data shown were repeated two times. (B) FOXP3 repressed the MYC promoter. The top panel shows a diagram of the MYC locus. The lower left panel shows the MYC regions included in the luciferase reporter, while the lower right panel shows the percentage of inhibition of the promoter activity, expressed as: (1-luciferase activity in the presence of FOXP3/luciferase activity in the absence of FOXP3) x100. Data shown were means of three independent experiments. (C) Deletion or mutation of the FOXP3 binding sites abrogated FOXP3-mediated suppression of the MYC reporter. The top shows the alignment of human, mouse, and rat MYC, revealing that the identified FOXP3 binding motif in MYC is in conserved region. The FOXP3 binding motif is shown in pink. The F3 WT reporter or those with either deletion (-195 to -189: TGTTTAC) or mutation (-195 to -189: TGTTTAC to AAAAGGG) of the reporter were transfected into 293T cells in conjunction with either control or FOXP3-expressing vector. The mean luciferase activities in the absence of FOXP3 cDNA were artificially defined as 100%. (D) Somatic mutation of FOXP3 reduced its repressor activity for the MYC promoter. In the upper panel, the F3 WT reporter were co-transfected with either vector control or cDNA encoding WT or mutant FOXP3 into the 293T cell line. At 48 hours after transfection, the lysates were harvested to measure luciferase activity. Data shown have been reproduced three times. In the lower panel, WT or mutant FOXP3 was transfected into the Du145 cells and the FOXP3 and MYC protein expression was analyzed by Western blot. (E) Despite normal nuclear translocation, V79A mutant show reduced binding to the critical cis-element at -0.2 kb region. Sonicated chromatins isolated from either WT or V79A mutant-transfected Du145 cells were precipitated with either control mouse IgG or mAb specific for FOXP3 (Abcam, ab450). The amounts of specific DNA were quantitated by real-time PCR using primers corresponding to the -0.2 and +13.5 kb regions. Data shown are means percentage input DNA and have been repproduced three times. Error bars in this figure are S.D.
To test whether somatic mutations of FOXP3 affect MYC repression, we transfected WT and mutant FOXP3 cDNA into the Du145 prostate cancer cell line in conjunction with the MYC promoter. Despite similar levels of FOXP3 protein, somatic mutations substantially reduced MYC repression (Fig. 8D). Since three of the four mutants failed to localize into the nuclei (Fig. 8E, F), we tested the remaining mutant for its ability to bind to the MYC promoter. As shown in Fig. 8E, the V79A mutation significantly reduced the binding of FOXP3 to the MYC promoter. Taken together, the data presented in this section demonstrates that FOXP3 represses MYC expression by binding the forkhead binding motif in the promoter. Somatic mutations uncovered in human prostate cancer abrogated the MYC repression by either preventing FOXP3’s nuclear localization or its binding to a cis-element in the MYC promoter.
Discussion
Molecular pathogenesis of prostate cancer development includes both upregulation of oncogenes such as MYC and inactivation of tumor suppressor genes such as autosomal genes PTEN and NKX3.1. Although X-linked genes have been implicated by genetic epidemiology and linkage analysis, no X-linked tumor suppressors have been identified for prostate cancer. Our study described herein fills a major gap by identifying the FOXP3 gene as an X-linked tumor suppressor gene in males.
FOXP3 is a tumor suppressor in prostate cancer
We and Rivera et al. have recently reported the involvement of X-linked tumor suppressor genes in female cancer patients, where the suppressor genes are functionally silenced by a programmed epigenetic event that occurred in all cells (X-inactivation) and another lesion such as gene deletion and/or mutation (Rivera et al., 2007; Zuo et al., 2007b). Here we described evidence that in the male, the FOXP3 locus is silenced by deletion and somatic mutation.
Immunohistochemical analysis demonstrated that the nuclear FOXP3 protein is absent in 68.5% of prostate cancer cases tested. Thus, in addition to deletion and mutation identified herein, additional mechanisms, such as epigenetic silencing or mutations outside the areas analyzed may also contribute to lack of FOXP3 expression. In contrast, 100% of benign prostate samples exhibited clear epithelial expression of nuclear FOXP3. The overwhelming difference strongly suggest a relationship between FOXP3 down-regulation and cancer development. This hypothesis has been confirmed by the impact of prostate-specific deletion of the FoxP3 locus. These data, together with strong growth inhibition and MYC repression by FOXP3, demonstrate that the FoxP3 gene plays a critical role in suppressing pathological transformation of the prostate. However, it should be pointed out that, similar to other tumor suppressors including Trp53 (Chen et al., 2005), NKX3.1 (Abdulkadir et al., 2002) (Kim et al., 2002), and Pten (Chen et al., 2005), we have not observed full spectrum of prostate cancer 60 weeks of observation. Since FoxP3 regulates Myc, and since the effect of transgenic Myc expression can be either hyperplasia (Zhang et al., 2000) or carcinoma with gene profiles similar to human prostate cancer (Ellwood-Yen et al., 2003), it is unclear whether extended observation time or additional factors are needed in order to achieve the full-spectrum of prostate cancer. The lack of full carcinogenesis over the observation period makes our model valuable for dissectiing contribution of other factors, such as inflammation and aging in the pathogenesis of prostate cancer. Nevertheless, the development of prostate hyperplasia and intra-epithelial neoplasia, a widely accepted precancerious lesion (Tomlins et al., 2006), demonstrates clearly that inactivation of FOXP3 in prostate cancer patients contribute to prostate cancer development. It is of interest to note that statistically significant down-regulation of FOXP3 occurred in the PIN lesion of human samples. Moreover, somatic mutations of FOXP3 were found in both PIN and cancerous lesions. Since deletion of FoxP3 in the mouse caused early PIN but so far no cancerous lesions, it is likely that FOXP3 inactivation is an early event in prostate carcinogenesis. Inactivation of FOXP3 will likely work in concert with additional genetic hits to cause prostate cancer.
FOXP3 exhibits strong growth inhibition of prostate cancer cell lines which is attenuated by somatic mutations in prostate cancer samples. Therefore, our genetic studies in mice and humans demonstrated a critical role for FOXP3 as a tumor suppressor gene for prostate cancer. The presence of a X-linked tumor suppressor gene as demonstrated in this study revealed a major exception for the generally accepted two-hit theory of tumor suppressor genes in cancer development (Knudson, 1971).
Since the FOXP3 resides near a region of a putative prostate cancer susceptibility locus (Gudmundsson et al., 2008), an interesting issue is whether identification of FOXP3 may help to explain reported X-linked genetic susceptibility to prostate cancer (Monroe et al., 1995). In our analysis of more than 100 probands with familiar prostate cancer, we have so far identified no germline mutation in the coding region of FOXP3 (data not shown). Given the early onset of lethal autoimmune diseases associated with inactivating mutation of FOXP3 (Bennett et al., 2001; Chatila et al., 2000; Wildin et al., 2001), it is unlikely that inactivating germline mutation of the FOXP3 gene can be found in prostate cancer patients. Additional analyses are needed to determine whether the FOXP3 polymorphisms affect susceptibility to prostate cancer.
FOXP3 as a transcriptional repressor of oncogene MYC
MYC is arguably the most up-regulated oncogene in human cancer, as over-expression has been observed in as many as 30% of all human cancer cases. Our results show freqenct over-expression of MYC mRNA in prostate cancers in comparison to adjacent normal epithelia. Although it is clear that a mutation of the APC gene resulted in up-regulation of MYC and MYC is essential for the development of colon cancer associated with APC mutation (He et al., 1998; Sansom et al., 2007), APC mutation is rare in prostate cancers thus cannot explain a MYC over-expression in prostate cancer. Likewise, although MYC over-expression has been observed in all stages of prostate cancer, a low level of gene amplification is observed only in late stages of prostate cancer (Jenkins et al., 1997; Latil et al., 2000). A similar disparity can be observed in other tumor types, including breast and lung cancer (Takahashi et al., 1989) (Bieche et al., 1999).
Our data presented here provide strong evidence that FOXP3-mediated repression of MYC is necessary to control MYC levels in normal prostate epithelial cells and explains much of the widespread over-expression of MYC in prostate cancer. Since transgenic expression of Myc resulted in development of prostate cancer with similar genetic profiles to human prostate cancer (Ellwood-Yen et al., 2003), disruption of the MYC regulator FOXP3, as documented here, likely plays a critical role for molecular pathogenesis of human prostate cancer. Nevertheless, using expression array analysis, we have uncovered a large array of genes that are either up- or down-regulated by ectopic expression of FOXP3. Notably, the genes involved in cancer are the most affected group (Figure S11). Therefore, much like what was observed in breast cancer, FOXP3 will likely suppress development of prostate cancer by targeting multiple genes, including both tumor suppressor and oncogenes (Liu et al., 2009; Zuo et al., 2007a; Zuo et al., 2007b).
Methods
Prostate cancer samples
Three sources of prostate tissue samples were used for this study. Frozen tissues were obtained from a Prostate Cancer Tissue Bank of the Ohio State University with no patient identification information. Tissue microarray samples came from the University of Michigan, Biomax (US Biomax, Inc., Rockville, MD) and and Target Biotech (Target Biotech, Inc., Thurmont, MD). All human studies have been approved by the Institutional Review Board of the Ohio State University and University of Michigan. Mouse prostate samples were fixed in 10% formalin. The sections were stained with H&E and diagnosed by two pathologists based on the criteria set forth by Park et al (Park et al., 2002)
Experimental animals
Transgenic mice PB-Cre4 expressing the Cre cDNA under the control of the probasin promoter have been described (Wu et al., 2001) and were obtained from the National Cancer Institute Mouse Model Deposit. Mice with Floxed FoxP3 locus (Fontenot et al., 2005) were provided by Dr. Alexander Rudensky. Male PB-Cre4+/- mice were crossed to female FoxP3flox/flox or flox/+ mice. The male F1 mice of given genotypes were used in the study. The pathological evaluation was carried out according the Bar Harbor meeting guideline (Shappell et al., 2004). All animal studies have been approved by the University of Michigan Animal User and Carer committee.
Cell cultures and antibodies
Human Prostate Epithelial Cell (HPEC) was purchased from Lonza Group Ltd (Switzerland) and cultured with medium from the same vendor. Early passage HPEC were infected with retrovirus expressing either control shRNA or FOXP3 shRNA vector. Two FOXP3-short hairpin RNA (shRNA) constructs are FOXP3-993-shRNA and FOXP3-1355-shRNA (GenBank accession number, NM_014009). Oligonucleotides encoding small interfering RNA (siRNA) directed against FOXP3 are 5’- GCTTCATCTGTGGCATCATCC -3’ for FOXP3-993-shRNA (993 to 1013 nucleotides from TSS) and 5’- GAGTCTGCACAAGTGCTTTGT -3’ for FOXP3-1355-shRNA (1355 to 1375 from TSS). The selected shRNA oligonucleotides were cloned into pSIREN-RetroQ vectors (Clontech, Mountain View, CA) to generate siRNA according to manufacturer’s protocol. Prostate cancer cell lines Du145 and PC3 were obtained from the American Type Culture Collection (ATCC, Rockville, Maryland). Antibodies specific for the following targets were used for the study: cMyc (Santa Cruz Biotechnology, Santa Cruz, CA; Cat #: sc-40), FOXP3 (Abcam, ab20034 for IHC and ab450 for Western blot, Cambridge, MA), hFOXY (eBioscience, Cat#: 14-5779-82 for Western blot in HPEC), anti-V5 (Invitrogen, SKU# R960-25), Ki67 (Dako Cytomation, code No. M7249, Carpenteria, CA), β-actin (Sigma, Cat#: A5441, St. Louis, MO), and anti-IgG (Santa Cruz Biotechnology, Santa Cruz, CA).
Immunohistochemistry
Since FOXP3 is expressed at lower levels in epithelial cells than in the regulatory T cells, the conditions typically used for detecting Treg in tumor samples do not give reproducible staining in the epithelial cells. In order to facilitate replication of the current studies, we have screened commercially available anti-FOXP3 antibodies and established staining conditions that give strong staining of FOXP3 in human and mouse epithelial cells.
The normal and cancer prostate frozen samples were partially thawed at room temperature and then immersed in 10% formalin for 8-12 hours and embedded in paraffin. Antigens were retrieved by microwave in 1x target retrieval buffer (Dako) for 12 min. For TMA samples, antigens were retrieved at 37° C overnight after the microwave antigen retrieval treatment. ABC detection system was used for immunostaining according to the manufacturer’s protocol (Vectastain Elite ABC, Burlingame, CA). The incubation time for primary antibody FOXP3 (Abcam 236A/E7, 1:100), FoxP3 (BioLegend Poly6238, 1:100), c-Myc (Santa Crruz Biotechnology 9E10, 1:200), c-Myc (Abcam ab39688, 1:100), and Ki67 (Dako TEC-3, 1:100) was overnight at 4°C. After incubation with primary antibody, staining was followed by ABC detection system using biotinylated anti-mouse/rabbit/rat IgG. AEC was used as chromogen. The slides were counterstained with hematoxylin and mounted in xylene mounting medium for examination.
Statistical analysis
The distribution of samples for each group was evaluated using a One-Sample Kolmogorov-Smirnov test. In the samples with normal distributions, we compared the means of the dependent variable using a Paired-Samples t test and means of the independent variable using an Independent-Samples t test between two groups. In the samples with non-normal distribution, we compared the means of the independent variable between two groups using a Mann-Whitney U test. Chi-square test was used to compare the relationship between the expression of FOXP3 and MYC among patients. The relationship between the levels of gene expression was estimated using a linear regression model. All data were entered into an access database and analyzed using the Excel 2000 and SPSS (version 10.0; SPSS, Inc.) software.
The raw data for supplemental Fig. S11 have been submitted to ArrayExpress (Accession No. E-MTAB-108).
Supplementary Material
Acknowledgments
We thank Dr. Alexander Rudensky for the FoxP3flox/flox mice. Dr. Hong Wu, Jianti Huang from UCLA, and Dr. George V. Thomas from Institute of Cancer Research and Royal Marsden Hospital, UK for pathological evaluation of mouse prostate. Drs. Eric Fearon, Steve Gruber, Michael Sabel and Yuan Zhu for valuable discussion and/or critical reading of the manuscript and Ms Darla Kroft for editorial assistance. This study is supported by grants from NIH, Department of Defense, Cancer Research Institute in New York, American Cancer Society and by a gift made the University of Michigan Cancer Center.
Footnotes
Publisher's Disclaimer: This is a PDF file of an unedited manuscript that has been accepted for publication. As a service to our customers we are providing this early version of the manuscript. The manuscript will undergo copyediting, typesetting, and review of the resulting proof before it is published in its final citable form. Please note that during the production process errors may be discovered which could affect the content, and all legal disclaimers that apply to the journal pertain.
References
- Abdulkadir SA, Magee JA, Peters TJ, Kaleem Z, Naughton CK, Humphrey PA, Milbrandt J. Conditional loss of Nkx3.1 in adult mice induces prostatic intraepithelial neoplasia. Mol Cell Biol. 2002;22:1495–1503. doi: 10.1128/mcb.22.5.1495-1503.2002. [DOI] [PMC free article] [PubMed] [Google Scholar]
- Amundadottir LT, Sulem P, Gudmundsson J, Helgason A, Baker A, Agnarsson BA, Sigurdsson A, Benediktsdottir KR, Cazier JB, Sainz J, et al. A common variant associated with prostate cancer in European and African populations. Nat Genet. 2006;38:652–658. doi: 10.1038/ng1808. [DOI] [PubMed] [Google Scholar]
- Bar-Shira A, Matarasso N, Rosner S, Bercovich D, Matzkin H, Orr-Urtreger A. Mutation screening and association study of the candidate prostate cancer susceptibility genes MSR1, PTEN, and KLF6. Prostate. 2006;66:1052–1060. doi: 10.1002/pros.20425. [DOI] [PubMed] [Google Scholar]
- Bennett CL, Christie J, Ramsdell F, Brunkow ME, Ferguson PJ, Whitesell L, Kelly TE, Saulsbury FT, Chance PF, Ochs HD. The immune dysregulation, polyendocrinopathy, enteropathy, X-linked syndrome (IPEX) is caused by mutations of FOXP3. Nat Genet. 2001;27:20–21. doi: 10.1038/83713. [DOI] [PubMed] [Google Scholar]
- Bieche I, Laurendeau I, Tozlu S, Olivi M, Vidaud D, Lidereau R, Vidaud M. Quantitation of MYC gene expression in sporadic breast tumors with a real-time reverse transcription-PCR assay. Cancer Res. 1999;59:2759–2765. [PubMed] [Google Scholar]
- Bommer GT, Fearon ER. Role of c-Myc in Apc mutant intestinal phenotype: case closed or time for a new beginning? Cancer Cell. 2007;11:391–394. doi: 10.1016/j.ccr.2007.04.015. [DOI] [PubMed] [Google Scholar]
- Bossone SA, Asselin C, Patel AJ, Marcu KB. MAZ, a zinc finger protein, binds to c-MYC and C2 gene sequences regulating transcriptional initiation and termination. Proc Natl Acad Sci U S A. 1992;89:7452–7456. doi: 10.1073/pnas.89.16.7452. [DOI] [PMC free article] [PubMed] [Google Scholar]
- Chatila TA, Blaeser F, Ho N, Lederman HM, Voulgaropoulos C, Helms C, Bowcock AM. JM2, encoding a fork head-related protein, is mutated in X-linked autoimmunity-allergic disregulation syndrome. J Clin Invest. 2000;106:R75–81. doi: 10.1172/JCI11679. [DOI] [PMC free article] [PubMed] [Google Scholar]
- Chen GY, Chen C, Wang L, Chang X, Zheng P, Liu Y. Cutting Edge: Broad Expression of the FoxP3 Locus in Epithelial Cells: A Caution against Early Interpretation of Fatal Inflammatory Diseases following In Vivo Depletion of FoxP3-Expressing Cells. J Immunol. 2008;180:5163–5166. doi: 10.4049/jimmunol.180.8.5163. [DOI] [PMC free article] [PubMed] [Google Scholar]
- Chen Z, Trotman LC, Shaffer D, Lin HK, Dotan ZA, Niki M, Koutcher JA, Scher HI, Ludwig T, Gerald W, et al. Crucial role of p53-dependent cellular senescence in suppression of Pten-deficient tumorigenesis. Nature. 2005;436:725–730. doi: 10.1038/nature03918. [DOI] [PMC free article] [PubMed] [Google Scholar]
- Dalla-Favera R, Bregni M, Erikson J, Patterson D, Gallo RC, Croce CM. Human c-myc onc gene is located on the region of chromosome 8 that is translocated in Burkitt lymphoma cells. Proc Natl Acad Sci U S A. 1982;79:7824–7827. doi: 10.1073/pnas.79.24.7824. [DOI] [PMC free article] [PubMed] [Google Scholar]
- Ellwood-Yen K, Graeber TG, Wongvipat J, Iruela-Arispe ML, Zhang J, Matusik R, Thomas GV, Sawyers CL. Myc-driven murine prostate cancer shares molecular features with human prostate tumors. Cancer Cell. 2003;4:223–238. doi: 10.1016/s1535-6108(03)00197-1. [DOI] [PubMed] [Google Scholar]
- Emmert-Buck MR, Vocke CD, Pozzatti RO, Duray PH, Jennings SB, Florence CD, Zhuang Z, Bostwick DG, Liotta LA, Linehan WM. Allelic loss on chromosome 8p12-21 in microdissected prostatic intraepithelial neoplasia. Cancer Res. 1995;55:2959–2962. [PubMed] [Google Scholar]
- Erikson J, ar-Rushdi A, Drwinga HL, Nowell PC, Croce CM. Transcriptional activation of the translocated c-myc oncogene in burkitt lymphoma. Proc Natl Acad Sci U S A. 1983;80:820–824. doi: 10.1073/pnas.80.3.820. [DOI] [PMC free article] [PubMed] [Google Scholar]
- Fearon ER, Dang CV. Cancer genetics: tumor suppressor meets oncogene. Curr Biol. 1999;9:R62–65. doi: 10.1016/s0960-9822(99)80012-8. [DOI] [PubMed] [Google Scholar]
- Fleming WH, Hamel A, MacDonald R, Ramsey E, Pettigrew NM, Johnston B, Dodd JG, Matusik RJ. Expression of the c-myc protooncogene in human prostatic carcinoma and benign prostatic hyperplasia. Cancer Res. 1986;46:1535–1538. [PubMed] [Google Scholar]
- Fontenot JD, Gavin MA, Rudensky AY. Foxp3 programs the development and function of CD4+CD25+ regulatory T cells. Nat Immunol. 2003;4:330–336. doi: 10.1038/ni904. [DOI] [PubMed] [Google Scholar]
- Fontenot JD, Rasmussen JP, Williams LM, Dooley JL, Farr AG, Rudensky AY. Regulatory T cell lineage specification by the forkhead transcription factor foxp3. Immunity. 2005;22:329–341. doi: 10.1016/j.immuni.2005.01.016. [DOI] [PubMed] [Google Scholar]
- Fox SB, Launchbury R, Bates GJ, Han C, Shaida N, Malone PR, Harris AL, Banham AH. The number of regulatory T cells in prostate cancer is associated with the androgen receptor and hypoxia-inducible factor (HIF)-2alpha but not HIF-1alpha. Prostate. 2007;67:623–629. doi: 10.1002/pros.20538. [DOI] [PubMed] [Google Scholar]
- Grandori C, Cowley SM, James LP, Eisenman RN. The Myc/Max/Mad network and the transcriptional control of cell behavior. Annu Rev Cell Dev Biol. 2000;16:653–699. doi: 10.1146/annurev.cellbio.16.1.653. [DOI] [PubMed] [Google Scholar]
- Gudmundsson J, Sulem P, Manolescu A, Amundadottir LT, Gudbjartsson D, Helgason A, Rafnar T, Bergthorsson JT, Agnarsson BA, Baker A, et al. Genome-wide association study identifies a second prostate cancer susceptibility variant at 8q24. Nat Genet. 2007;39:631–637. doi: 10.1038/ng1999. [DOI] [PubMed] [Google Scholar]
- Gudmundsson J, Sulem P, Rafnar T, Bergthorsson JT, Manolescu A, Gudbjartsson D, Agnarsson BA, Sigurdsson A, Benediktsdottir KR, Blondal T, et al. Common sequence variants on 2p15 and Xp11.22 confer susceptibility to prostate cancer. Nat Genet. 2008;40:281–283. doi: 10.1038/ng.89. [DOI] [PMC free article] [PubMed] [Google Scholar]
- Haiman CA, Le Marchand L, Yamamato J, Stram DO, Sheng X, Kolonel LN, Wu AH, Reich D, Henderson BE. A common genetic risk factor for colorectal and prostate cancer. Nat Genet. 2007a;39:954–956. doi: 10.1038/ng2098. [DOI] [PMC free article] [PubMed] [Google Scholar]
- Haiman CA, Patterson N, Freedman ML, Myers SR, Pike MC, Waliszewska A, Neubauer J, Tandon A, Schirmer C, McDonald GJ, et al. Multiple regions within 8q24 independently affect risk for prostate cancer. Nat Genet. 2007b;39:638–644. doi: 10.1038/ng2015. [DOI] [PMC free article] [PubMed] [Google Scholar]
- He TC, Sparks AB, Rago C, Hermeking H, Zawel L, da Costa LT, Morin PJ, Vogelstein B, Kinzler KW. Identification of c-MYC as a target of the APC pathway. Science. 1998;281:1509–1512. doi: 10.1126/science.281.5382.1509. [DOI] [PubMed] [Google Scholar]
- Hori S, Nomura T, Sakaguchi S. Control of regulatory T cell development by the transcription factor Foxp3. Science. 2003;299:1057–1061. doi: 10.1126/science.1079490. [DOI] [PubMed] [Google Scholar]
- Jenkins RB, Qian J, Lieber MM, Bostwick DG. Detection of c-myc oncogene amplification and chromosomal anomalies in metastatic prostatic carcinoma by fluorescence in situ hybridization. Cancer Res. 1997;57:524–531. [PubMed] [Google Scholar]
- Kim MJ, Cardiff RD, Desai N, Banach-Petrosky WA, Parsons R, Shen MM, Abate-Shen C. Cooperativity of Nkx3.1 and Pten loss of function in a mouse model of prostate carcinogenesis. Proc Natl Acad Sci U S A. 2002;99:2884–2889. doi: 10.1073/pnas.042688999. [DOI] [PMC free article] [PubMed] [Google Scholar]
- Knudson AG., Jr Mutation and cancer: statistical study of retinoblastoma. Proc Natl Acad Sci U S A. 1971;68:820–823. doi: 10.1073/pnas.68.4.820. [DOI] [PMC free article] [PubMed] [Google Scholar]
- Kolligs FT, Hu G, Dang CV, Fearon ER. Neoplastic transformation of RK3E by mutant beta-catenin requires deregulation of Tcf/Lef transcription but not activation of c-myc expression. Mol Cell Biol. 1999;19:5696–5706. doi: 10.1128/mcb.19.8.5696. [DOI] [PMC free article] [PubMed] [Google Scholar]
- Latil A, Vidaud D, Valeri A, Fournier G, Vidaud M, Lidereau R, Cussenot O, Biache I. htert expression correlates with MYC over-expression in human prostate cancer. Int J Cancer. 2000;89:172–176. [PubMed] [Google Scholar]
- Liu R, Wang L, Chen G, Katoh H, Chen C, Liu Y, Zheng P. FOXP3 up-regulates p21 expression by site-specific inhibition of histone deacetylase 2/histone deacetylase 4 association to the locus. Cancer Res. 2009;69:2252–2259. doi: 10.1158/0008-5472.CAN-08-3717. [DOI] [PMC free article] [PubMed] [Google Scholar]
- Lu X, Park SH, Thompson TC, Lane DP. Ras-induced hyperplasia occurs with mutation of p53, but activated ras and myc together can induce carcinoma without p53 mutation. Cell. 1992;70:153–161. doi: 10.1016/0092-8674(92)90541-j. [DOI] [PubMed] [Google Scholar]
- Monroe KR, Yu MC, Kolonel LN, Coetzee GA, Wilkens LR, Ross RK, Henderson BE. Evidence of an X-linked or recessive genetic component to prostate cancer risk. Nat Med. 1995;1:827–829. doi: 10.1038/nm0895-827. [DOI] [PubMed] [Google Scholar]
- Narla G, Difeo A, Reeves HL, Schaid DJ, Hirshfeld J, Hod E, Katz A, Isaacs WB, Hebbring S, Komiya A, et al. A germline DNA polymorphism enhances alternative splicing of the KLF6 tumor suppressor gene and is associated with increased prostate cancer risk. Cancer Res. 2005;65:1213–1222. doi: 10.1158/0008-5472.CAN-04-4249. [DOI] [PubMed] [Google Scholar]
- Narla G, Heath KE, Reeves HL, Li D, Giono LE, Kimmelman AC, Glucksman MJ, Narla J, Eng FJ, Chan AM, et al. KLF6, a candidate tumor suppressor gene mutated in prostate cancer. Science. 2001;294:2563–2566. doi: 10.1126/science.1066326. [DOI] [PubMed] [Google Scholar]
- Park JH, Walls JE, Galvez JJ, Kim M, Abate-Shen C, Shen MM, Cardiff RD. Prostatic intraepithelial neoplasia in genetically engineered mice. Am J Pathol. 2002;161:727–735. doi: 10.1016/S0002-9440(10)64228-9. [DOI] [PMC free article] [PubMed] [Google Scholar]
- Rivera MN, Kim WJ, Wells J, Driscoll DR, Brannigan BW, Han M, Kim JC, Feinberg AP, Gerald WL, Vargas SO, et al. An X chromosome gene, WTX, is commonly inactivated in Wilms tumor. Science. 2007;315:642–645. doi: 10.1126/science.1137509. [DOI] [PubMed] [Google Scholar]
- Roncador G, Brown PJ, Maestre L, Hue S, Martinez-Torrecuadrada JL, Ling KL, Pratap S, Toms C, Fox BC, Cerundolo V, et al. Analysis of FOXP3 protein expression in human CD4+CD25+ regulatory T cells at the single-cell level. Eur J Immunol. 2005;35:1681–1691. doi: 10.1002/eji.200526189. [DOI] [PubMed] [Google Scholar]
- Sansal I, Sellers WR. The biology and clinical relevance of the PTEN tumor suppressor pathway. J Clin Oncol. 2004;22:2954–2963. doi: 10.1200/JCO.2004.02.141. [DOI] [PubMed] [Google Scholar]
- Sansom OJ, Meniel VS, Muncan V, Phesse TJ, Wilkins JA, Reed KR, Vass JK, Athineos D, Clevers H, Clarke AR. Myc deletion rescues Apc deficiency in the small intestine. Nature. 2007;446:676–679. doi: 10.1038/nature05674. [DOI] [PubMed] [Google Scholar]
- Shappell SB, Thomas GV, Roberts RL, Herbert R, Ittmann MM, Rubin MA, Humphrey PA, Sundberg JP, Rozengurt N, Barrios R, et al. Prostate pathology of genetically engineered mice: definitions and classification. The consensus report from the Bar Harbor meeting of the Mouse Models of Human Cancer Consortium Prostate Pathology Committee. Cancer Res. 2004;64:2270–2305. doi: 10.1158/0008-5472.can-03-0946. [DOI] [PubMed] [Google Scholar]
- Spatz A, Borg C, Feunteun J. X-chromosome genetics and human cancer. Nature reviews. 2004;4:617–629. doi: 10.1038/nrc1413. [DOI] [PubMed] [Google Scholar]
- Suzuki H, Freije D, Nusskern DR, Okami K, Cairns P, Sidransky D, Isaacs WB, Bova GS. Interfocal heterogeneity of PTEN/MMAC1 gene alterations in multiple metastatic prostate cancer tissues. Cancer Res. 1998;58:204–209. [PubMed] [Google Scholar]
- Takahashi T, Obata Y, Sekido Y, Hida T, Ueda R, Watanabe H, Ariyoshi Y, Sugiura T, Takahashi T. Expression and amplification of myc gene family in small cell lung cancer and its relation to biological characteristics. Cancer Res. 1989;49:2683–2688. [PubMed] [Google Scholar]
- Taub R, Kirsch I, Morton C, Lenoir G, Swan D, Tronick S, Aaronson S, Leder P. Translocation of the c-myc gene into the immunoglobulin heavy chain locus in human Burkitt lymphoma and murine plasmacytoma cells. Proc Natl Acad Sci U S A. 1982;79:7837–7841. doi: 10.1073/pnas.79.24.7837. [DOI] [PMC free article] [PubMed] [Google Scholar]
- Thompson TC, Southgate J, Kitchener G, Land H. Multistage carcinogenesis induced by ras and myc oncogenes in a reconstituted organ. Cell. 1989;56:917–930. doi: 10.1016/0092-8674(89)90625-9. [DOI] [PubMed] [Google Scholar]
- Tomlins SA, Rubin MA, Chinnaiyan AM. Integrative biology of prostate cancer progression. Annual review of pathology. 2006;1:243–271. doi: 10.1146/annurev.pathol.1.110304.100047. [DOI] [PubMed] [Google Scholar]
- Vocke CD, Pozzatti RO, Bostwick DG, Florence CD, Jennings SB, Strup SE, Duray PH, Liotta LA, Emmert-Buck MR, Linehan WM. Analysis of 99 microdissected prostate carcinomas reveals a high frequency of allelic loss on chromosome 8p12-21. Cancer Res. 1996;56:2411–2416. [PubMed] [Google Scholar]
- Wildin RS, Ramsdell F, Peake J, Faravelli F, Casanova JL, Buist N, Levy-Lahad E, Mazzella M, Goulet O, Perroni L, et al. X-linked neonatal diabetes mellitus, enteropathy and endocrinopathy syndrome is the human equivalent of mouse scurfy. Nat Genet. 2001;27:18–20. doi: 10.1038/83707. [DOI] [PubMed] [Google Scholar]
- Witte JS. Multiple prostate cancer risk variants on 8q24. Nat Genet. 2007;39:579–580. doi: 10.1038/ng0507-579. [DOI] [PubMed] [Google Scholar]
- Wong AJ, Ruppert JM, Eggleston J, Hamilton SR, Baylin SB, Vogelstein B. Gene amplification of c-myc and N-myc in small cell carcinoma of the lung. Science. 1986;233:461–464. doi: 10.1126/science.3014659. [DOI] [PubMed] [Google Scholar]
- Wu X, Wu J, Huang J, Powell WC, Zhang J, Matusik RJ, Sangiorgi FO, Maxson RE, Sucov HM, Roy-Burman P. Generation of a prostate epithelial cell-specific Cre transgenic mouse model for tissue-specific gene ablation. Mech Dev. 2001;101:61–69. doi: 10.1016/s0925-4773(00)00551-7. [DOI] [PubMed] [Google Scholar]
- Xu J, Meyers D, Freije D, Isaacs S, Wiley K, Nusskern D, Ewing C, Wilkens E, Bujnovszky P, Bova GS, et al. Evidence for a prostate cancer susceptibility locus on the X chromosome. Nat Genet. 1998;20:175–179. doi: 10.1038/2477. [DOI] [PubMed] [Google Scholar]
- Yeager M, Orr N, Hayes RB, Jacobs KB, Kraft P, Wacholder S, Minichiello MJ, Fearnhead P, Yu K, Chatterjee N, et al. Genome-wide association study of prostate cancer identifies a second risk locus at 8q24. Nat Genet. 2007;39:645–649. doi: 10.1038/ng2022. [DOI] [PubMed] [Google Scholar]
- Zhang X, Lee C, Ng PY, Rubin M, Shabsigh A, Buttyan R. Prostatic neoplasia in transgenic mice with prostate-directed overexpression of the c-myc oncoprotein. Prostate. 2000;43:278–285. doi: 10.1002/1097-0045(20000601)43:4<278::aid-pros7>3.0.co;2-4. [DOI] [PubMed] [Google Scholar]
- Zuo T, Liu R, Zhang H, Chang X, Liu Y, Wang L, Zheng P, Liu Y. FOXP3 is a novel transcription repressor for the breast cancer oncogene SKP2. J Clin Invest. 2007a;117:3765–3773. doi: 10.1172/JCI32538. [DOI] [PMC free article] [PubMed] [Google Scholar]
- Zuo T, Wang L, Morrison C, Chang X, Zhang H, Li W, Liu Y, Wang Y, Liu X, Chan MWY, et al. FOXP3 is an X-linked breast cancer suppressor gene and an important repressor of HER-2/ErbB2 oncogene. Cell. 2007b;129:1275–1286. doi: 10.1016/j.cell.2007.04.034. [DOI] [PMC free article] [PubMed] [Google Scholar]
Associated Data
This section collects any data citations, data availability statements, or supplementary materials included in this article.