

Abstract
Evidence-based medicine is the application of scientific evidence to clinical practice. This article discusses the difficulties of applying global evidence (“average effects” measured as population means) to local problems (individual patients or groups who might depart from the population average). It argues that the benefit or harm of most treatments in clinical trials can be misleading and fail to reveal the potentially complex mixture of substantial benefits for some, little benefit for many, and harm for a few. Heterogeneity of treatment effects reflects patient diversity in risk of disease, responsiveness to treatment, vulnerability to adverse effects, and utility for different outcomes. Recognizing these factors, researchers can design studies that better characterize who will benefit from medical treatments, and clinicians and policymakers can make better use of the results.
Keywords: Evidence-based medicine, research design, population characteristics, genomics, statistics, United States Food and Drug Administration
Evidence-based medicine (EBM) is the systematic application of scientific evidence to clinical practice. Because its strengths and limitations have been described in detail elsewhere (Fahey 1998; Feinstein and Horwitz 1998; Rosser 1999; Sackett et al. 1996), we focus here on the difficulties of applying global evidence (mostly “average effects” measured as population means) to local problems (individual patients or groups who may depart from the population average).
It should be obvious that treatment effects are not necessarily the same for everyone. What may not be so obvious is that misapplying averages can cause harm, by either giving patients treatments that do not help or denying patients treatments that would help them. Proponents of EBM recognize the value of different kinds of evidence, the importance of clinical judgment, and the role of patients’ values (Dans et al. 1998; McAlister et al. 2000; Sackett et al. 2000). Users, however, may understand EBM in a more restrictive sense (Kanouse, Kallich, and Kahan 1995; Lomas 1991; Lomas et al. 1989), resulting in overconfidence in the value of average effects for guiding individual treatments that might compromise the effective application of EBM.
The purpose of this article is to stimulate efforts to identify and validate approaches that balance regard for global evidence with respect for local problems; acknowledge the equal importance of internal validity and external validity (generalizability); pave the way for a more personalized form of medicine based on new scientific discoveries; and inform policy in regard to drug approval, clinical guidelines development, and payment decisions.
The clinical problem of individualizing therapy is related to the statistical problem of the heterogeneity of treatment effects (HTE), also known as treatment-effect heterogeneity or treatment heterogeneity (Longford 1999). HTE is present when the same treatment produces different results in different patients (Sorensen 1996). When HTE is present, the modest benefit ascribed to many treatments in clinical trials can be misleading because modest average effects may reflect a mixture of substantial benefits for some, little benefit for many, and harm for a few.
The Dimensions of Treatment-Effect Heterogeneity
Our ability to predict how an individual patient will respond to a particular treatment depends on our knowledge of the patient's (1) baseline probability of incurring a disease-related adverse event (“risk without treatment” or “susceptibility/prognosis”), (2) responsiveness to the treatment, (3) vulnerability to the adverse side effects of the treatment, and (4) utilities for different outcomes. Heterogeneities in these dimensions are the driving forces behind HTE.
Risk without treatment is shorthand for the probability of incurring an undesirable, disease-related outcome without any treatment, with a placebo treatment, or with a standard (nonexperimental) treatment. It subsumes two epidemiological concepts: susceptibility to the disease or condition itself, and prognosis (expected course and outcome) in the absence of the index (experimental) treatment. For example, patients routinely spending more than two hours outside after dusk are up to six times more likely to contract West Nile virus (Mostashari et al. 2001), and infected patients over 50 years of age are 20 times more likely to suffer sequelae requiring hospitalization (Nash et al. 2001).
Responsiveness to treatment is the probability that a diseased individual will experience a clinically significant benefit from the treatment. The response to a medicine can depend on drug absorption, distribution, metabolism, or elimination; drug concentration at the target site; or the number and functionality of target receptors (Roses 2000). In general terms, patients who absorb a drug rapidly, metabolize it slowly, or have a high concentration of highly functional drug receptors demonstrate a greater responsiveness to the drug than do patients who absorb slowly, metabolize rapidly, or have a low concentration of receptors.
Vulnerability to side effects is the probability of incurring adverse outcomes related to the treatment (i.e., the likelihood of experiencing side effects). The events of interest are those that would not occur in the absence of the treatment. Whether a clinical event is categorized as disease related or treatment related depends on the context. For example, for patients treated with aspirin to prevent heart disease, a heart attack would be classified as a disease-related risk, and gastrointestinal bleeding (caused in part by the aspirin's abrading the stomach) would be a treatment-related side effect. In contrast, for patients taking a proton-pump inhibitor to prevent peptic ulcer disease, gastrointestinal bleeding would be a disease-related outcome.
Utilities are a manifestation of patients’ values and preferences for different outcomes. Often they reflect tradeoffs between the quantity and quality of life, among different dimensions of quality, or concerning the timing of events. For example, the drug tamoxifen is recommended as an option for preventing breast cancer among women whose ten-year risk of breast cancer exceeds 1.7 percent. Women who choose to take tamoxifen are implicitly trading a reduction in the risk of breast cancer for an increase in the risk of blood clots, hot flashes, and uterine cancer (U.S. Preventive Services Task Force 2002).
Substantial heterogeneities can and do exist in these dimensions. For example:
Risk without Treatment
Patients with atrial fibrillation and rheumatic heart disease are 18 times more likely to experience a stroke compared with those free of valvular heart disease (Lip and Lowe 1996). The potential benefit of taking blood thinners is therefore much greater for those with an abnormal heart valve.
Responsiveness to Treatment
As a result of geographic variation in the prevalence of penicillin-resistant bacteria, in some U.S. cities patients with pneumonia are much more likely to respond to penicillin than are patients residing elsewhere (McCormick et al. 2003).
Vulnerability to Side Effects
Patients who inherit a deficiency of thiopurine S-methyl transferase are ten to 20 times more sensitive to the marrow-suppressing effects of 6-MP, a drug used to treat certain leukemias and Crohn's disease, than are patients with normal levels of this enzyme. Therefore, deficient patients must be treated cautiously with 6-MP, if at all (Coulthard et al. 2002).
Utilities
Preference weights for impotence and incontinence following prostate cancer surgery can range from 0.1 to 1.0 (Volk et al. 2004). (A utility of 0.1 for impotence/incontinence means that a patient would be willing to trade ten years of life with impotence/incontinence for one year of life that is free of symptoms. A utility of 1.0 means the patient assigns exactly the same value to a year of life with impotence/incontinence as to a year of life free of symptoms.)
In sum, treatment-effect heterogeneity is plausible across a variety of clinical contexts.
The Definition of Heterogeneity of Treatment Effects
Heterogeneity of treatment effects is the magnitude of the variation of individual treatment effects across a population. In statistical terms, HTE is equivalent to the interaction between treatment effect and individual patient effect. If there is no interaction between the treatment and the individual, then the treatment effect is additive relative to the individual effect. There also is no variation in the treatment effects across individual patients and no HTE. An individual treatment effect (ITE) is the difference between a person's outcome on treatment A and his or her outcome on treatment B (where “treatment B” may be an active treatment, a placebo, or no treatment). Typically, the variation in ITEs is expressed as a standard deviation, so that HTE is defined as the standard deviation of the ITEs across a target population. (Alternative measures of dispersion, such as the interquartile range, can also be used as warranted in specific applications.) Sometimes HTE is regarded as dichotomous, with HTE said to be absent if the variation is null or small, and present if the variation is large.
Figure 1 (panel A) is a histogram of ITEs for patients in a hypothetical clinical trial. The average patient receives a net benefit of +0.5 standardized effect size units (generally regarded as a “moderate” effect) (Cohen 1988). The average of ITEs across individuals in the target population is the average treatment effect (ATE), shown as the thick vertical line. The ATE has been the primary focus of clinical studies in recent decades. Patients represented on the far right-hand side of the curve receive benefits from the treatment that are much larger than average. Those to the left receive smaller than average benefits, and those to the far left incur harm. Although Figure 1 portrays a set of normal distributions, other distributions are both possible and evident in practice.
Figure 1. Distribution of Individual-Specific Treatment Effects (ITEs) in Three Hypothetical Populations.

The average treatment effect (ATE) is indicated by the vertical bar. Individuals to the right of the bar derive a greater than average benefit, while those to the left derive less than an average benefit or even harm. The horizontal axis is standardized by the pooled standard deviation of the outcome. The gray zone represents patients in whom the effect size is so small (+/−0.25 SD) as to be clinically meaningless. Panel A represents a normal distribution centered on an effect size of 0.5 SD; panel B represents a more narrow distribution, still centered on the same mean; and panel C is normally distributed but shifted to the right (mean effect size about 1.3 SDs).
It is important to recognize that HTE is the standard deviation of the ITEs rather than the standard deviation of the outcomes in the target population. The latter is commonly used to derive the “treatment effect size” in parallel group clinical trials. HTE can be shown to be equal to  SD
SD  , where SD is the pooled standard deviation of the outcome and ρ is the (usually unknown) correlation between the outcome for individuals under treatment A compared with treatment B. Since ρ is usually unknown but is expected to be nonnegative, HTE can be as small as zero (if ρ= 1) and as large as
  SD (if ρ= 0) for a given SD.
Based on these considerations, HTE is small when the SD for treatment outcomes is small. HTE is small relative to the SD of the outcomes when most patients are either “protected” (destined to do well regardless of which of the two treatments they receive) or “doomed” (destined to do poorly regardless). Otherwise HTE can be large.
If HTE is modest (panel B) or if the ATE is large (panel C), few patients will suffer harm from a treatment that is, on average, beneficial. Nevertheless, qualitative HTE such as the hypothetical example shown in panel A should not be ruled out without careful investigation, especially given most clinical studies’ inability to assess ITEs and HTE directly. In one telling example, Rothwell and Warlow (1999) reported that carotid endarterectomy (a surgical procedure for removing plaque from the wall of the carotid artery) reduced the risk of stroke by one-third among the 16 percent of patients with a high “prognostic score” (4 or more points), compared with a nonsignificant increase in risk of stroke among patients with a low score (0 or 1). In other words, carotid endarterectomy has different (qualitative) effects depending on the patient's baseline “risk without treatment.”
Heterogeneity in the Population and Heterogeneity in the Sample
Longford and Nelder (1999) characterized a clinical trial as an experiment and a survey rolled into one. Although randomized controlled trials (RCTs) usually are good experiments, they often are poor surveys. A good survey sample is representative of the target population, so that the parameters estimated in the sample can be generalized to the target population. By convenience, RCTs are usually characterized by narrow inclusion criteria and recruitment. Under these conditions, the heterogeneity of treatment effects may be dramatically underestimated, and even assiduous investigators can be misled into thinking that their results are more generalizable than they actually are.
As shown in Figure 2 (derived from Longford 1999), patients enrolled in RCTs (“the sample”) are not necessarily representative of patients in the target population. In fact, nonrepresentativeness is probably the rule rather than the exception (Schmoor, Olschewski, and Schumacher 1996). If HTE is found to be null or very small, the treatment effect is homogeneous in the sample. Even in this instance, however, the treatment effect may not be homogeneous in the target population. The sample might be narrowly composed of individuals for whom the treatment has a uniform effect (e.g., sample 1 in Figure 2). In this situation the sample HTE underestimates the population HTE, even though the sample ATE might be unbiased for the population ATE. If the sample is composed of individuals for whom the treatment has an aberrant effect, the population ATE might be underestimated or, as in sample 2 in Figure 2, overestimated. In comparison, sample 3 illustrates a truly representative sample that is expected to yield unbiased estimates for both ATE and HTE.
Figure 2. Distribution of ITE in the Population (Large Unshaded Curve) and in Three Hypothetical Samples (Shaded Curves).

Sample 1 is centered but fails to reflect the diversity of the population in terms of net treatment benefit. Sample 2 is composed of individuals who happen to derive much more net benefit from the treatment than does the average member of the population. Only sample 3 is broadly representative of the population in terms of risk, responsiveness, and vulnerability.
Longford's critique has some important implications. If the average effect as reported in clinical trials does not apply to a part of the population, clinicians may end up overtreating (or undertreating) some of their patients. The result may take an especially perilous turn if practice guidelines inadvertently encourage physicians to discount differences between their patients (and settings) and those studied in the primary trials. For example, the Randomized Aldactone Evaluation Study trial showed that use of spironolactone (a specific type of potassium-sparing diuretic) in selected patients with advanced congestive heart failure resulted in a 30 to 35 percent reduction in the risk of death and rehospitalization (Pitt et al. 1999). Publication of this trial and subsequent guidelines from the American College of Cardiology were associated with a fourfold increase in the use of spironolactone among patients with heart failure between 1994 and 2001. Unfortunately, the increased usage in this patient population was associated with a greater than fourfold increase in hospitalizations for high blood potassium (a side effect of spironolactone treatment) and no reduction in all-cause mortality (Juurlink et al. 2004). This paradoxical finding may be partially explained by the differential patient selection in the community as compared with the trial and different local monitoring standards.
Why Treatments Do Not Work the Same for Everyone
We have argued that a treatment that is mildly beneficial on average may have differing effects in individuals. Part of this variation can be attributed to how the treatment is delivered; for example, two aspirin tablets might work better if they are backed up with a friendly invitation to “call me in the morning” (underscoring the healing value of reassurance) (Kaptchuk 2002); and tricyclic antidepressants might be administered more safely if preceded by a screening electrocardiogram (allowing for the exclusion of patients with certain preexisting electrical conduction defects). Even if the treatment is delivered uniformly, the outcomes will still vary because, as noted earlier, individual patients differ according to their preexisting risk without treatment, responsiveness to treatment, vulnerability to side effects, and health state preferences or utilities. We now examine these dimensions in more detail.
Risk without Treatment (Baseline Risk)
Clinicians know that patients with the same disease can have widely different prognoses depending on the severity of the primary illness and the number and type of comorbidities. All else being equal, the absolute benefits of a treatment increase along with the increasing baseline risk (i.e., heightened susceptibility or worse prognosis). Thus, coronary artery bypass surgery is lifesaving (reduces the risk of mortality) when performed on patients with blockage of the left main coronary artery (the major source of blood to the entire left side of the heart), but generally not when performed on patients with blockage of only one or two vessels (Keenan and Chou 1998). The blood thinner warfarin reduces the risk of stroke by an average of 68 percent for nearly everyone with atrial fibrillation except for patients who are younger than 65 years of age and do not have a history of hypertension, diabetes, or previous stroke or transient ischemic attack (TIA, “ministroke”). These patients have such a low baseline risk of stroke—approaching 1 percent per year—that the risk of bleeding from warfarin exceeds any possible benefit (Stroke Prevention in Atrial Fibrillation Investigators 1994).
Responsiveness
The variations in responsiveness lie behind the observation that treatments often pack more physiological, functional, or psychological “wallop” in some patients than others. Some variations in responsiveness are genetic in origin (Evans and McLeod 2003). For example, 7 percent of Caucasians cannot metabolize codeine into morphine and so do not get any pain relief from codeine (Sindrup and Brosen 1995). Other examples are given in Table 1. A cautionary note was recently sounded by statistician Stephen Senn, who pointed out that if patients vary randomly in their response over time, identifying the causes of nonresponse becomes much more complicated (Senn 2004). Nevertheless, biological variations in responsiveness are behind at least some of the difficulties in individualizing treatment (Weinshilboum 2003).
TABLE 1.
Genetically Determined Mediators of Treatment Responsiveness and Vulnerability to Adverse Treatment-Related Effects
| Mechanism | Example |
|---|---|
| Mediators of Responsiveness | |
| Drug metabolism | Some patients metabolize isoniazid (INH) rapidly, thereby diminishing its effectiveness against tuberculosis (Sykes 2000). |
| Drug receptor affinity | Among men with coronary atherosclerosis, carriers of two B1 alleles of the cholesteryl ester transfer protein benefit most from pravastatin (a cholesterol-lowering drug) (Kuivenhoven et al. 1998). |
| Mediators of Vulnerability | |
| Drug metabolism | Glucose-6-dehydrogenase deficiency is associated with hemolysis following treatment with antimalarials and sulfa drugs (Mehta, Mason, and Vulliamy 2000). |
| Preexisting functional insult | Breast cancer and lymphoma patients with one or more APO-E4 alleles are more likely to experience chemotherapy-related cognitive decline (Ahles et al. 2003). |
| Altered receptor binding | Schizophrenics with alterations in the serotonin 2A receptor gene are more vulnerable to tardive dyskinesia when treated with conventional antipsychotics (Segman et al. 2001). |
Behavioral and environmental variables can also influence responsiveness to treatment. For example, patients who respond poorly to drug therapy are less likely to derive benefit from the prescription (Coronary Drug Project Research Group 1980). No matter what treatment is offered, only those treatment components that are actually delivered and adhered to will have any direct effects. The antecedents of adherence are complex but are known to include personality and contextual factors with both genetic and environmental components (Sherbourne et al. 1992).
Beyond any individual variations in responsiveness, the effect of therapies that are beneficial on average may vary in many respects from hospital to hospital or clinic to clinic, with only some of the variation owing to chance (Ioannidis et al. 1999). A good example comes from the Beta-Blocker Heart Attack Trial (B-Blocker Heart Attack Trial Research Group 1982). This was a well-controlled, multicenter, randomized controlled trial in which patients, on average, were more likely to survive an acute myocardial infarction if given propranolol rather than a placebo. In ten of the 31 sites, however, mortality was lower in those patients given a placebo. These differences were unlikely due to biases in the trial design or inadequate sample sizes but were most likely due to differences in individual patients and the contextual differences in the various study sites (Horwitz et al. 1996).
Vulnerability
Vulnerability to the adverse effects of the index treatment is the flip side of responsiveness (Phillips et al. 2001). Genetic and environmental variations in susceptibility to side effects can have a major impact on the net effect (benefit or harm) of treatment. Mallal and colleagues (2002) reported on a genetic marker predicting serious reactions to abacavir, a drug used to treat HIV infection. About 5 percent of patients treated with abacavir develop a serious, potentially life-threatening allergic reaction. Mallal and colleagues reported that those patients with certain major histocompatibility (MHC) markers were several hundred times more likely to experience hypersensitivity than were those lacking all three markers. Other examples of genetic vulnerability to side effects of medications are given in Table 1.
As with risk, vulnerability can be influenced by contextual factors such as the clinician's ability to detect adverse effects of treatment and to respond appropriately. For example, institutional differences in the “failure to rescue” patients with cardiac decompensation or gastrointestinal bleeding (Needleman et al. 2002; Silber et al. 1992) produced different mortality rates associated with the use of new drugs or procedures. If one hospital was much better than another at detecting early signs of treatment-related problems, the two hospitals might have different in-hospital death rates associated with that treatment.
Utilities
Patients’ preferences for different health states (utilities) are the ultimate arbiter of treatment success. As a corollary, clinical outcomes such as death or hospitalization are in some sense “intermediate” outcomes until weighted by patients’ preferences. As noted earlier with respect to prostate cancer, outcome-related preferences can vary by tenfold or more. Such differences in utilities among patients can generate HTEs that may exceed those produced by differences in risk, responsiveness, or vulnerability. Consider the choice of treatment options for breast cancer that might lead to death, survival with major disfigurement, or survival without major body disfigurement. For patients with a strong aversion to major body disfigurement, the appropriate treatment choice might emphasize breast preservation even at the cost of a lower survival rate. The same treatments might lead to substantially different utilities across patients, even if they produce exactly the same clinical outcomes.
Accounting for Heterogeneity of Treatment Effects
The possibility that treatment effects are heterogeneous across individuals means that clinicians cannot always apply RCT-derived average effects to their patients. The EBM community has incorporated patient values and preferences into the general framework of evidence-based medicine (Sackett et al. 2000), and some experts advocate accounting for baseline risk (susceptibility/prognosis) as a way to more accurately estimate a treatment's effects on an individual (McAlister et al. 2000). However, there has been little effort to assess responsiveness and vulnerability simultaneously with susceptibility/prognosis and utility. Taking this more holistic approach will become important as progress in genomics and proteomics facilitates detailed subgroup analysis based on underlying molecular mechanisms (Roses 2000). We now explore how risk, responsiveness, and vulnerability affect treatment thresholds, first separately and then in combination.
Glasziou and Irwig argued that those “patients at greatest risk of a disease will have the greatest net benefit from treatment, as benefit to patients usually increases with risk while harm remains comparatively fixed” (Glasziou and Irwig 1995, 1356). Their thesis is depicted graphically in Figure 3, panel A. As the baseline risk (Rc) climbs from 0 percent to 100 percent, the expected treatment benefit (charted on an absolute percentage scale and represented by the dark line) is assumed to increase from 0 percent to 10 percent. Conversely, any harm resulting from side effects of the treatment is assumed not to be related to the (baseline) risk of an adverse disease-related outcome, as shown by the horizontal dashed line. The value of Rc where the two lines cross is the treatment threshold. Above this threshold of risk, patients will gain more than they lose from treatment. Below the threshold, the opposite is true.
Figure 3.
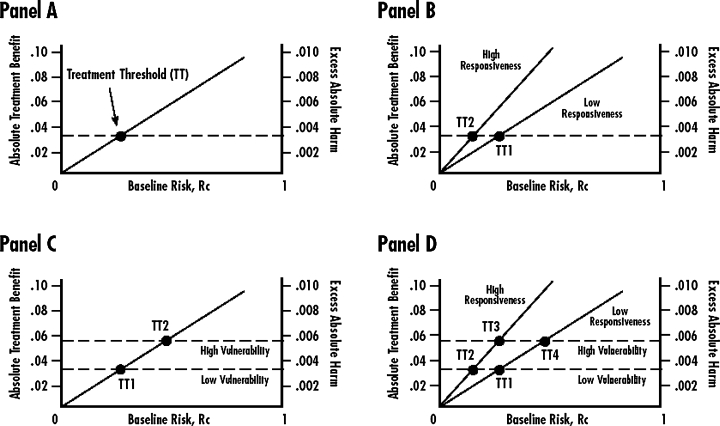
Relationships of Risk, Responsiveness, and Vulnerability to Treatment Thresholds
Panels B through D in Figure 3 show alternative scenarios for the simultaneous influence of risk, responsiveness, and vulnerability on hypothetical treatment thresholds. (We assume that utilities have already been incorporated into the scales for measuring the absolute treatment effect and the treatment-related harm, so that the vertical axis is comparable between the two types of outcomes.) In panel B (Risk and Responsiveness), the upper diagonal line represents the relationship between baseline risk (susceptibility/prognosis) and treatment benefits for a group of patients characterized as “high responders.” These patients respond better to treatment than do “low responders” with the same baseline risk because they are better absorbers, slower metabolizers, have better drug-binding sites, or any number of other reasons (O’Neill et al. 2001). The lower diagonal line represents relatively poor responders. Note that in this diagram, the threshold TT2 for treatment among good responders is much lower than the threshold TT1 for poor responders. Even at low levels of baseline risk, the treatment offers net benefits to good responders.
In panel C (Risk and Vulnerability), harm depends on degree of vulnerability to adverse effects but remains independent of baseline risk (susceptibility/prognosis). The benefits of treatment (diagonal line) increase along with the rising baseline risk. Two groups of patients, however, are distinguished by their vulnerability to the adverse effects of treatment (horizontal lines). In the abacavir example (Mallal et al. 2002), the treatment threshold TT2 for patients genetically vulnerable to the adverse effects of the drug is much higher than the treatment threshold TT1 for those with other alleles.
A more complete model is represented in panel D (Risk, Responsiveness, and Vulnerability). Here we assume (1) a linear relationship between the risk and benefits of treatment; (2) two different levels of responsiveness to treatment; (3) a constant level of harm, irrespective of baseline risk; and (4) two different levels of vulnerability to harm. Instead of a single risk-dependent treatment threshold, there now are four thresholds, corresponding to the places where the two risk-benefit lines (one for high-responsiveness patients, the other for low-responsiveness patients) cross the two harm lines (one for highly vulnerable patients, the other for less vulnerable patients). As pointed out in previous discussions, both low responsiveness and high vulnerability raise the treatment threshold.
The purpose of considering these hypothetical scenarios is to demonstrate unequivocally the importance of baseline risk (susceptibility/prognosis), responsiveness, and vulnerability to predicting whether an individual will benefit from a treatment. In panel D, whether points TT1, TT2, TT3, and TT4 converge to a common mean or remain widely separated depends on the empirical relationships among risk, responsiveness, vulnerability, and outcomes. Determining these relationships more often and more rigorously is the next great task of clinical research in the 21st century.
Implications for Clinical Care
We have shown that a treatment offers the greatest benefit to patients who have a poor prognosis without treatment (or on standard treatment), who are highly responsive to the experimental treatment, and who are minimally vulnerable to the adverse effects of the treatment; a treatment offers less benefit to patients with the opposite characteristics. This is true even for treatments that, on average, are “safe and effective.”
This insight creates an awkward situation for clinicians. On the one hand, without good data on a patient's individual level of risk, responsiveness, and vulnerability, the average treatment effect as reported in clinical trials provides the best guidance for treating that individual. This is especially true in light of the observation that the results of ad hoc subgroup analyses (the type most commonly reported) are often spurious (Parker and Naylor 2000; Yusuf et al. 1991). On the other hand, average effects pertain most often to the average patient. Accordingly, those who deviate far from the average trial participant based on risk, responsiveness, or vulnerability may behave very differently. Clinicians should be wary of falling into casual compliance with practice guidelines that do not account for the possibility that treatment effects are heterogeneous. At the same time, they should realize that decisions based on “average effects” derived from high-quality clinical trials are likely to be better (at least on average) than decisions based on no formal evidence at all.
Unfortunately, clinicians may be discouraged from using their clinical judgment through “guideline creep”: the evolution of genuinely flexible clinical recommendations into more rigid practice standards. In a poignant illustration of this principle, Walter and colleagues describe how Veterans Affairs (VA) guidelines for colorectal cancer screening defined high rates of screening as good care, ignoring the fact that “for some patients with severe comorbid illnesses or strong preferences against screening, the risks of colorectal cancer screening outweigh the benefits” (2004, abstract, 2466). Following the release of the initial audit results, physicians at the San Francisco VA were told that the failure to raise colorectal cancer screening rates could result in financial penalties for the medical center. The VA's administrative policies had the unintended effect of discouraging the physicians’ exercise of sound clinical judgment. Walter and colleagues identified several pitfalls in converting practice guidelines into quality measures, including inattention to illness severity, failure to distinguish screening from diagnostic testing, and not accounting for patient preferences.
How should clinicians proceed? First, they should recognize that even compromised knowledge is better than complete ignorance. Thus, in the absence of information on HTE and ITEs, reliance on average effects as measured in good clinical studies is likely to produce better outcomes than is intuition or habit. Second, clinicians should seek evidence for or against the applicability of reported treatment effects to the patient at hand. How alike are the patient in the office and the average patient in the relevant clinical studies? Are there good reasons (empirical or pathophysiological) to believe that substantial HTE could exist? Third, physicians should try to assess their patients along the dimensions of susceptibility/prognosis, responsiveness, and vulnerability and to use their clinical judgment to integrate these concerns into a treatment recommendation. Data for estimating risk and vulnerability are available from cohort studies of prognosis and postmarketing surveys of adverse events, increasingly combined with results of genetic screening (Phillips et al. 2001). Although data on responsiveness are less widely available, important sources are subgroup analyses in adequately powered clinical trials and observational studies using advanced biostatistics tools for causal inference, such as propensity scores analysis and causal sensitivity analysis (D’Agostino 1998; Rosenbaum 2002; Rosenbaum and Rubin 1983, 1984).
At the present time, clinicians have good reason to be frustrated by the lack of data on risk, responsiveness, and vulnerability for most common conditions. Continuing advances at the nexus of genomics and medical informatics, however, hold promise for the future. The day may not be far off when a practitioner, using a handheld PDA, or personal digital assistant, will be able to calculate a patient's baseline susceptibility and prognosis using validated clinical prediction rules; assess responsiveness and vulnerability to a therapeutic agent based on genotyping and measurement of biomarkers; and use this information for a discussion with the patient. Electronic assessment and manipulation of utilities is further away, but specialized decision support counselors may provide an interim solution (Health Dialog 2004), particularly if they can be worked into primary care practice.
Implications for Research
Taking HTE seriously means that researchers need better ways of accounting for risk, responsiveness, vulnerability, and utility as they plan and conduct clinical studies. When possible, clinical researchers should assess and report on HTE as well as ATE. They also should consider the implications of HTE in both the sample and the population.
Unfortunately, individual treatment effects cannot be estimated in parallel group randomized trials, because patients in such studies are exposed to only one treatment. As a result, HTE cannot be estimated from these trials either. Alternative trial designs such as sequential crossover and matched pairs permit the direct estimation of ITEs and deserve wider implementation (Jones and Lewis 1995).
The smart use of subgroup analysis should be encouraged. Doing this properly requires knowing something substantive about the determinants of risk, responsiveness, vulnerability, and utility as well as designing trials that are large enough to accommodate statistically valid tests of those determinants as they interact with the treatment. It also means not succumbing to the temptation to include many subgroups, each with a relatively small “n,” in the interest of “representativeness.” Subgroups must be judiciously selected and cautiously compared using appropriately conservative statistical approaches such as tests of interaction (Pocock et al. 2002).
The best way to ensure the generalizability of a trial's results is widely assumed to include a broadly representative sample of the target population. Partly for this reason, the inclusion of women, minorities, and children in government-funded clinical studies is now a federal requirement in the United States (Baird 1999). Unfortunately, while a demographically varied sample may be a good defense against sample selection bias, it does not diminish concern about HTE, because the dispersion of effects across subgroups may still be large. A sample that is demographically constrained at least yields valid effect estimates for the group being studied (assuming appropriate trial design and conduct). Paradoxically, the requirement that all important age, gender, and race/ethnicity subgroups be included in clinical trials may do nothing but ensure that the estimates for any one subgroup are unreliable due to small numbers (Allmark 2004; Moye and Powell 2001). Research-funding agencies should not abandon their insistence that all pertinent groups be studied over time, but they should recognize that any single study need not include all groups.
The critical test for whether the results of a study apply to an individual patient is not whether the patient would meet the trial inclusion criteria but whether he or she is sufficiently like the average patient in the trial to make meaningful the resulting estimate of the average treatment effect. In a recent randomized trial of penicillin for acute sore throat in children, the antibiotic had no effect on the duration of the illness (Zwart et al. 2003). The majority of patients in the trial had symptoms for more than three days before the consultation, whereas in actual practice, up to 62 percent of patients present to the physician within three days (Little et al. 1999). Generally speaking, the earlier it is administered, the more effective the antibiotic therapy is (Densen and Merle 1998). The study, however, had insufficient power to examine the effects of penicillin in different subgroups constructed according to the duration of symptoms. The problem was not that children with a short duration of illness were excluded from the trial but that not enough of them were included. While the study results might apply to children with a short duration of symptoms, we have no assurance that they actually do.
With respect to generalizability, clinical trialists should accept Longford's insight and try to design trials that are good experiments and good surveys. Efficacy trials (which are almost always poor surveys) will remain important for demonstrating therapeutic promise and elucidating mechanisms of disease, but greater emphasis should be placed on assessing effectiveness among the patients and physicians who will actually use the treatments. Investigators could start by simply reporting more information on who their patients are and how they got into the trial (Gross et al. 2002). Newer randomized trial designs such as adaptive (“play the winner”) designs (Rosenberger and Lachin 1993), randomized consent (Zelen 1990), regression-discontinuity trials (Cappelleri and Trochim 1994), and combined single-subject (“n-of-1”) trials (Guyatt et al. 1990; Johannessen, Fosstvedt, and Petersen 1991) may also hold some promise for enhancing the generalizability of clinical experiments.
Finally, researchers should recognize that while RCTs remain the gold standard for estimating global treatment efficacy, other kinds of studies can help refine the RCT design, enhance their interpretation, and confirm their relevance. Cohort studies in particular have a critical role. Cohort studies completed in advance of a clinical trial can identify those groups of patients most likely to do poorly on standard therapy and identify other prognostic groups. Postmarketing studies can look for evidence of specific patient subgroups’ enhanced responsiveness to treatment and increased vulnerability to side effects. This approach will become increasingly important as gene microarray technology allows the simultaneous characterization of multiple genes (King and Sinha 2001). After a clinical trial is completed, it may be possible to identify genes or groups of genes that are associated with better (or worse) outcomes. The clinical trial can then be replicated on a much smaller scale, enrolling only those patients predicted to be most genetically responsive or least vulnerable. Medical journals can help in this process by encouraging better survey sampling within clinical trials, establishing standards for reporting on subgroup analyses, and publishing more trials with nontraditional designs that permit estimation of HTE.
Implications for Policy
The policy implications of HTE hang in part on the issue's quantitative importance. Some distinguished commentators are skeptical. Peto (1982) and Senn and Harrell (1997), for example, have suggested that quantitative differences in observed treatment effects among subgroups are mostly meaningless and that the (qualitative) reversal of effects is usually spurious. We can only say that, first, it is difficult to know the true extent of treatment-effect heterogeneity, since few studies have been appropriately powered and designed to examine subgroups or to estimate HTE directly using crossover designs or matched pair analysis. Second, the genomics era opens up entirely opportunities to identify populations that are especially responsive (or unresponsive) to treatment or that are especially vulnerable (or resistant) to treatment-related side effects (Brazell, Freeman, and Mosteller 2002; Roses 2000).
These observations have important implications for the U.S. Food and Drug Administration (FDA) drug approval process; for the development and promulgation of practice guidelines by medical specialty societies; and for the growing movement to “pay for performance.” The FDA grants marketing approval to manufacturers who have shown their product to be safe and effective, usually based on two or more well-controlled studies. The pharmaceutical industry currently has little direct incentive to collect data on risk, responsiveness, and vulnerability that would better inform individual treatment decisions. (The indirect incentive currently in place is for drug manufacturers to identify those patient subgroups for whom a new drug is safer or more effective than an existing drug, thus creating a separate indication for the new drug.)
We propose that the FDA consider a two-stage approval process in which it would award a provisional license to market the drug based on the current safety and effectiveness criteria (i.e., using ATE). Labeling standards should be upgraded so that drug labels contain information describing the types of patients included and excluded from relevant studies. As an incentive to compile additional data on clinically relevant subgroups and improve the drug's clinical use, the FDA could grant secondary approvals accompanied by a patent extension as evidence accumulates on subgroups of patients who are either particularly apt to benefit from the drug or are particularly likely to be harmed. At the same time, the FDA should require the collection and public reporting of postmarketing adverse effects data so that vulnerable subgroups can be identified early. (We recognize that patent extensions will require a major legislative process and might have consequences that need to be considered and debated broadly.)
The recent controversy over the FDA's failure to approve the “morning-after pill” for emergency contraception centered, in part, on the question of how much subgroup data are needed for general approval of a drug (or an indication for a drug). The FDA's stated rationale for nonapproval was that the data on young teens were insufficient. Under our proposal, the FDA could have approved the morning-after pill for adult use while insisting that additional data be collected on outcomes in younger women. (Whether this would have averted the political tempest is unclear.)
The implications for clinical practice guidelines and practice incentives such as “pay for performance” are equally important. Not even the most vehement critics of EBM would advocate a return to “opinion-based” practice grounded solely in pathophysiological reasoning and personal clinical experience (Tanenbaum 1993). Nevertheless, the producers and disseminators of clinical practice guidelines face a dilemma. Clear and simple recommendations are most likely to be followed (Grol et al. 1998). But simplicity (in which ATE is emphasized and possible HTE is ignored) may be at odds with the best care.
We recommend that practice guidelines (1) be based on a thorough review of the evidence including, but not limited to, RCTs; (2) attend to both the internal validity and external validity (generalizability) of the included studies; (3) grade the evidence on which the guidelines are based (Shiffman et al. 2003); (4) incorporate information from prespecified and statistically valid subgroup analyses; (5) state the “boundaries of evidence” to whom the evidence almost certainly applies, to whom it might apply, and to whom it almost certainly does not apply; and (6) be promulgated in a spirit of humility, generally eschewing strong incentives or punitive sanctions, at least until compelling evidence for the absence of significant HTE is acquired.
Conclusions
Clinical trials provide good estimates of average effects. But averages do not apply to everyone. By attending to risk without treatment, responsiveness to treatment, vulnerability to adverse effects, and utility for different outcomes, researchers can design studies that better characterize who will—and who will not—benefit from medical interventions. Clinicians and policymakers can, in turn, make better use of the results.
Acknowledgments
The research for this article was supported in part by National Institutes of Mental Health grants R01 MH64683-01A1 (Dr. Kravitz) and P-30 MH58107 (Dr. Duan). The authors are grateful to Robert Brook, Peter Franks, and Nathan Kupperman for helpful advice on earlier versions of this manuscript.
References
- Ahles TA, Saykin AJ, Noll WW, Furstenberg CT, Guerin S, Cole B, Mott LA. The Relationship of APOE Genotype to Neuropsychological Performance in Long-Term Cancer Survivors Treated with Standard Dose Chemotherapy. Psycho-oncology. 2003;12:612–9. doi: 10.1002/pon.742. 10.1002/pon.742. [DOI] [PubMed] [Google Scholar]
- Allmark P. Should Research Samples Reflect the Diversity of the Population? Journal of Clinical Epidemiology. 2004;30:185–9. doi: 10.1136/jme.2003.004374. [DOI] [PMC free article] [PubMed] [Google Scholar]
- B-Blocker Heart Attack Trial Research Group. A Randomized Trial of Propranolol in Patients with Acute Myocardial Infarction. I. Mortality Results. Journal of the American Medical Association. 1982;247:1707–14. doi: 10.1001/jama.1982.03320370021023. 10.1001/jama.247.12.1707. [DOI] [PubMed] [Google Scholar]
- Baird KL. The New NIH and FDA Medical Research Policies: Targeting Gender, Promoting Justice. Journal of Health Politics, Policy and Law. 1999;24(3):531–65. doi: 10.1215/03616878-24-3-531. [DOI] [PubMed] [Google Scholar]
- Brazell C, Freeman A, Mosteller M. Maximizing the Value of Medicines by Including Pharmacogenetic Research in Drug Development and Surveillance. British Journal of Clinical Pharmacology. 2002;53:224–31. doi: 10.1046/j.0306-5251.2001.01556.x. [DOI] [PMC free article] [PubMed] [Google Scholar]
- Cappelleri JC, Trochim WM. An Illustrative Statistical Analysis of Cutoff-Based Randomized Clinical Trials. Journal of Clinical Epidemiology. 1994;47(3):261–70. doi: 10.1016/0895-4356(94)90007-8. [DOI] [PubMed] [Google Scholar]
- Cohen J. 2nd ed. Hillsdale, N.J.: Erlbaum; 1988. Statistical Power Analysis for the Behavioral Sciences. [Google Scholar]
- Coronary Drug Project Research Group. Influence of Adherence to Treatment and Response of Cholesterol on Mortality in the Coronary Drug Project. New England Journal of Medicine. 1980;303:1038–41. doi: 10.1056/NEJM198010303031804. [DOI] [PubMed] [Google Scholar]
- Coulthard SA, Hogarth LA, Little M, Matheson EC, Redfern CP, Minto L, Hall AG. The Effect of Thiopurine Methyltransferase Expression on Sensitivity to Thiopurine Drugs. Molecular Pharmacology. 2002;62:102–9. doi: 10.1124/mol.62.1.102. [DOI] [PubMed] [Google Scholar]
- D’Agostino RB. Propensity Score Methods for Bias Reduction in the Comparison of a Treatment to a Non-Randomized Comparison Group. Statistics in Medicine. 1998;17:2265–81. doi: 10.1002/(sici)1097-0258(19981015)17:19<2265::aid-sim918>3.0.co;2-b. 10.1002/(SICI)1097-0258(19981015)17:19<2265::AID-SIM918>3.0.CO;2-B. [DOI] [PubMed] [Google Scholar]
- Dans AL, Dans LF, Guyatt GH, Richardson S. User's Guides to the Medical Literature. XIV. How to Decide on the Applicability of Clinical Trial Results to Your Patient. Journal of the American Medical Association. 1998;279:545–9. doi: 10.1001/jama.279.7.545. 10.1001/jama.279.7.545. [DOI] [PubMed] [Google Scholar]
- Densen P, Merle AS. Basic Principles of Infectious Disease. In: Stein J, editor. Internal Medicine. 5. St. Louis: Mosby; 1998. chap. 29. [Google Scholar]
- Evans WE, McLeod HL. Pharmacogenomics—Drug Disposition, Drug Targets, and Side Effects. New England Journal of Medicine. 2003;348:538–49. doi: 10.1056/NEJMra020526. 10.1056/NEJMra020526. [DOI] [PubMed] [Google Scholar]
- Fahey T. Applying the Results of Clinical Trials to Patients to General Practice: Perceived Problems, Strengths, Assumptions, and Challenges for the Future. British Journal of General Practice. 1998;48:1173–8. [PMC free article] [PubMed] [Google Scholar]
- Feinstein AR, Horwitz RI. Problems in the Evidence of Evidence-Based Medicine. American Journal of Medicine. 1998;105:361–2. doi: 10.1016/s0002-9343(97)00244-1. [DOI] [PubMed] [Google Scholar]
- Glasziou PP, Irwig LM. An Evidence Based Approach to Individualising Treatment. BMJ. 1995;311(7016):1356–9. doi: 10.1136/bmj.311.7016.1356. [DOI] [PMC free article] [PubMed] [Google Scholar]
- Grol R, Dalhuijsen J, Thomas S, Veld C, Rutten G, Mokkink H. Attributes of Clinical Guidelines That Influence Use of Guidelines in General Practice: Observational Study. BMJ. 1998;317:858–61. doi: 10.1136/bmj.317.7162.858. [DOI] [PMC free article] [PubMed] [Google Scholar]
- Gross CP, Mallory R, Heiat A, Krumholz HM. Reporting the Recruitment Process in Clinical Trials: Who Are These Patients and How Did They Get There? Annals of Internal Medicine. 2002;137(1):10–6. doi: 10.7326/0003-4819-137-1-200207020-00007. [DOI] [PubMed] [Google Scholar]
- Guyatt GH, Heyting A, Jaeschke R, Keller J, Adachi JD, Roberts RS. N of 1 Randomized Trials for Investigating New Drugs. Controlled Clinical Trials. 1990;11(2):88–100. doi: 10.1016/0197-2456(90)90003-k. [DOI] [PubMed] [Google Scholar]
- Health Dialog Services Corporation. Support for Decisions That Matter Most. Boston: 2004. [accessed July 25, 2004]. Available at http://www.healthdialog.com/Health_Dialog_QA.pdf. [Google Scholar]
- Horwitz RI, Singer BH, Makuch RW, Viscoli CM. Can Treatment That Is Helpful on Average Be Harmful to Some Patients? A Study of the Conflicting Information Needs of Clinical Inquiry and Drug Regulation. Journal of Clinical Epidemiology. 1996;49:395–400. doi: 10.1016/0895-4356(95)00058-5. 10.1016/0895-4356(95)00058-5. [DOI] [PubMed] [Google Scholar]
- Ioannidis JPA, Dixon DO, McIntosh M, Albert JM, Bozzette SA, Schnittman SM. Relationship between Event Rates and Treatment Effects in Clinical Site Differences within Multicenter Trials: An Example from Primary Pneumocystis carinii Prophylaxis. Controlled Clinical Trials. 1999;20:253–66. doi: 10.1016/s0197-2456(98)00053-1. 10.1016/S0197-2456(98)00053-1. [DOI] [PubMed] [Google Scholar]
- Johannessen T, Fosstvedt D, Petersen H. Combined Single Subject Trials. Scandinavian Journal of Primary Health Care. 1991;9(1):23–7. doi: 10.3109/02813439109026577. [DOI] [PubMed] [Google Scholar]
- Jones B, Lewis JA. The Case for Cross-over Trials in Phase III. Statistics in Medicine. 1995;14:1025–38. doi: 10.1002/sim.4780140921. [DOI] [PubMed] [Google Scholar]
- Juurlink DN, Mamdani MM, Lee DS, Kopp A, Austin PC, Laupacis A, Redelmeier DA. Rates of Hyperkalemia after Publication of the Randomized Aldactone Evaluation Study. New England Journal of Medicine. 2004;351:543–51. doi: 10.1056/NEJMoa040135. 10.1056/NEJMoa040135. [DOI] [PubMed] [Google Scholar]
- Kanouse DE, Kallich JD, Kahan JP. Dissemination of Effectiveness and Outcomes Research. Health Policy. 1995;34(3):167–92. doi: 10.1016/0168-8510(95)00760-1. 10.1016/0168-8510(95)00760-1. [DOI] [PubMed] [Google Scholar]
- Kaptchuk TJ. The Placebo Effect in Alternative Medicine: Can the Performance of a Healing Ritual Have Clinical Significance? Annals of Internal Medicine. 2002;136:817–25. doi: 10.7326/0003-4819-136-11-200206040-00011. [DOI] [PubMed] [Google Scholar]
- Keenan CR, Chou TM. Revascularization in Coronary Artery Disease. A Review of Randomized Trial Data. Western Journal of Medicine. 1998;168(4):280–5. [PMC free article] [PubMed] [Google Scholar]
- King HC, Sinha AA. Gene Expression Profile Analysis by DNA Microarrays: Promise and Pitfalls. Journal of the American Medical Association. 2001;286(18):2280–8. doi: 10.1001/jama.286.18.2280. 10.1001/jama.286.18.2280. [DOI] [PubMed] [Google Scholar]
- Kuivenhoven JA, Jukema JW, Zwinderman AH, de Knijff P, McPherson R, Bruschke AV, Lie KI, Kastelein JJ. The Role of a Common Variant of the Cholesteryl Ester Transfer Protein Gene in the Progression of Coronary Atherosclerosis. New England Journal of Medicine. 1998;338:86–93. doi: 10.1056/NEJM199801083380203. 10.1056/NEJM199801083380203. [DOI] [PubMed] [Google Scholar]
- Lip GY, Lowe GD. ABC of Atrial Fibrillation. Antithrombotic Treatment for Atrial Fibrillation. BMJ. 1996;312:45–9. doi: 10.1136/bmj.312.7022.45. [DOI] [PMC free article] [PubMed] [Google Scholar]
- Little P, Gould C, Williamson I, Warner G, Gantley M, Kinmonth AL. Clinical and Psychosocial Predictors of Illness Duration from Randomized Controlled Trial of Prescribing Strategies for Sore Throat. BMJ. 1999;19:736–7. doi: 10.1136/bmj.319.7212.736. [DOI] [PMC free article] [PubMed] [Google Scholar]
- Lomas J. Words without Action? The Production, Dissemination, and Impact of Consensus Recommendations. Annual Review of Public Health. 1991;12:41–65. doi: 10.1146/annurev.pu.12.050191.000353. 10.1146/annurev.pu.12.050191.000353. [DOI] [PubMed] [Google Scholar]
- Lomas J, Anderson GM, Domnick-Pierre K, Vayda E, Enkin MW, Hannah WJ. Do Practice Guidelines Guide Practice? The Effect of a Consensus Statement on the Practice of Physicians. New England Journal of Medicine. 1989;321(19):1306–11. doi: 10.1056/NEJM198911093211906. [DOI] [PubMed] [Google Scholar]
- Longford NT. Selection Bias and Treatment Heterogeneity in Clinical Trials. Statistics in Medicine. 1999;18:1467–74. doi: 10.1002/(sici)1097-0258(19990630)18:12<1467::aid-sim149>3.0.co;2-h. 10.1002/(SICI)1097-0258(19990630)18:12<1467::AID-SIM149>3.0.CO;2-H. [DOI] [PubMed] [Google Scholar]
- Longford NT, Nelder JA. Statistics versus Statistical Science in the Regulatory Process. Statistics in Medicine. 1999;18(17–18):2311–20. doi: 10.1002/(sici)1097-0258(19990915/30)18:17/18<2311::aid-sim257>3.0.co;2-t. 10.1002/(SICI)1097-0258(19990915/30)18:17/18<2311::AID-SIM257>3.3.CO;2-K. [DOI] [PubMed] [Google Scholar]
- Mallal S, Nolan D, Witt C, Masel G, Martin AM, Moore C, Sayer D, Castley A, Mamotte C, Maxwell D, James I, Christiansen FT. Association between Presence of HLA-B5701, HLA-DR7, and HLA-DQ3 and Hypersensitivity to HIV-1 Reverse-Transcriptase Inhibitor Abacavir. Lancet. 2002;359:727–32. doi: 10.1016/s0140-6736(02)07873-x. 10.1016/S0140-6736(02)07873-X. [DOI] [PubMed] [Google Scholar]
- McAlister FA, Straus SE, Guyatt GH, Haynes RB. User's Guides to the Medical Literature: XX. Integrating Research Evidence with the Care of the Individual Patient. Journal of the American Medical Association. 2000;283:2829–36. doi: 10.1001/jama.283.21.2829. 10.1001/jama.283.21.2829. [DOI] [PubMed] [Google Scholar]
- McCormick AW, Whitney CG, Farley MM, Lynfield R, Harrison LH, Bennett NM, Schaffner W, Reingold A, Hadler J, Cieslak P, Samore MH, Lipsitch M. Geographic Diversity and Temporal Trends of Antimicrobial Resistance in Streptococcus pneumoniae in the United States. Nature Medicine. 2003;9:424–30. doi: 10.1038/nm839. 10.1038/nm839. [DOI] [PubMed] [Google Scholar]
- Mehta A, Mason PJ, Vulliamy TJ. Glucose-6-Phosphate Dehydrogenase Deficiency. Baillieres Best Practice & Research. Clinical Haematology. 2000;13(1):21–38. doi: 10.1053/beha.1999.0055. [DOI] [PubMed] [Google Scholar]
- Mostashari F, Bunning ML, Kitsutani PT, Singer DA, Nash D, Cooper MJ, Katz N, Liljebjelke KA, Biggerstaff BJ, Fine AD, Layton MC, Mullin SM, Johnson AJ, Martin DA, Hayes EB, Campbell GL. Epidemic West Nile Encephalitis, New York, 1999: Results of a Household-Based Seroepidemiological Survey. Lancet. 2001;358:261–4. doi: 10.1016/S0140-6736(01)05480-0. 10.1016/S0140-6736(01)05480-0. [DOI] [PubMed] [Google Scholar]
- Moye LA, Powell JH. Evaluation of Ethnic Minorities and Gender Effects in Clinical Trials: Opportunities Lost and Rediscovered. Journal of the National Medical Association. 2001;93(12):29S–34S. [PMC free article] [PubMed] [Google Scholar]
- Nash D, Mostashari F, Fine A, Miller J, O’Leary D, Murray K, Huang A, Rosenberg A, Greenberg A, Sherman M, Wong S, Layton M. The Outbreak of West Nile Virus Infection in the New York City Area in 1999. New England Journal of Medicine. 2001;344:1807–14. doi: 10.1056/NEJM200106143442401. 10.1056/NEJM200106143442401. [DOI] [PubMed] [Google Scholar]
- Needleman J, Buerhaus P, Mattke S, Stewart M, Zelevinsky K. Nurse-Staffing Levels and the Quality of Care in Hospitals. New England Journal of Medicine. 2002;346(22):1715–22. doi: 10.1056/NEJMsa012247. 10.1056/NEJMsa012247. [DOI] [PubMed] [Google Scholar]
- O’Neill FH, Patel DD, Knight BL, Neuwirth CK, Bourbon M, Soutar AK, Taylor GW, Thompson GR, Naoumova RP. Determinants of Variable Response to Statin Treatment in Patients with Refractory Familial Hypercholesterolemia. Arteriosclerosis, Thrombosis, and Vascular Biology. 2001;21:832–7. doi: 10.1161/01.atv.21.5.832. [DOI] [PubMed] [Google Scholar]
- Parker AB, Naylor CD. Subgroups, Treatment Effects, and Baseline Risks: Some Lessons from Major Cardiovascular Trials. American Heart Journal. 2000;139:952–61. doi: 10.1067/mhj.2000.106610. 10.1067/mhj.2000.106610. [DOI] [PubMed] [Google Scholar]
- Peto R. Statistical Aspects of Cancer Trials. In: Halnan KE, editor. Treatment of Cancer. London: Chapman & Hall; 1982. pp. 867–71. [Google Scholar]
- Phillips KA, Veenstra DL, Oren E, Lee JK, Sadee W. Potential Role of Pharmacogenomics in Reducing Adverse Drug Reactions. A Systematic Review. Journal of the American Medical Association. 2001;286:2270–9. doi: 10.1001/jama.286.18.2270. 10.1001/jama.286.18.2270. [DOI] [PubMed] [Google Scholar]
- Pitt B, Zannad F, Remme WJ, Cody R, Castaigne A, Perez A, Palensky J, Wittes J. The Effect of Spironolactone on Morbidity and Mortality in Patients with Severe Heart Failure. Randomized Aldactone Evaluation Study Investigators. New England Journal of Medicine. 1999;341:709–17. doi: 10.1056/NEJM199909023411001. 10.1056/NEJM199909023411001. [DOI] [PubMed] [Google Scholar]
- Pocock SJ, Assmann SE, Enos LE, Kasten LE. Subgroup Analysis, Covariate Adjustment and Baseline Comparisons in Clinical Trial Reporting: Current Practice and Problems. Statistics in Medicine. 2002;21(19):2917–30. doi: 10.1002/sim.1296. 10.1002/sim.1296. [DOI] [PubMed] [Google Scholar]
- Rosenbaum PR. Observational Studies. 2nd ed. New York: Springer Verlag; 2002. [Google Scholar]
- Rosenbaum PR, Rubin DB. The Central Role of Propensity Score in Observational Studies for Causal Effects. Biometrika. 1983;70:41–55. [Google Scholar]
- Rosenbaum PR, Rubin DB. Reducing Bias in Observational Studies Using Subclassification on the Propensity Score. Journal of the American Statistical Association. 1984;79:516–24. [Google Scholar]
- Rosenberger WF, Lachin JM. The Use of Response-Adaptive Designs in Clinical Trials. Controlled Clinical Trials. 1993;14(6):471–84. doi: 10.1016/0197-2456(93)90028-c. 10.1016/0197-2456(93)90028-C. [DOI] [PubMed] [Google Scholar]
- Roses AD. Pharmacogenetics and Future Drug Development and Delivery. Lancet. 2000;355:1358–61. doi: 10.1016/S0140-6736(00)02126-7. 10.1016/S0140-6736(00)02126-7. [DOI] [PubMed] [Google Scholar]
- Rosser WW. Application of Evidence from Randomised Controlled Trials to General Practice. Lancet. 1999;353:661–4. doi: 10.1016/S0140-6736(98)09103-X. 10.1016/S0140-6736(98)09103-X. [DOI] [PubMed] [Google Scholar]
- Rothwell PM, Warlow CP. Prediction of Benefit from Carotid Endarterectomy in Individual Patients: A Risk Modeling Study. Lancet. 1999;353:2105–10. doi: 10.1016/s0140-6736(98)11415-0. 10.1016/S0140-6736(98)11415-0. [DOI] [PubMed] [Google Scholar]
- Sackett DL, Rosenberg WM, Gray JA, Haynes RB, Richardson WS. Evidence Based Medicine: What It Is and What It Isn’t. BMJ. 1996;313:169–71. doi: 10.1136/bmj.312.7023.71. [DOI] [PMC free article] [PubMed] [Google Scholar]
- Sackett DL, Straus SE, Richardson WS, Rosenberg W, Haynes RB. Evidence-Based Medicine: How to Practice and Teach EBM. 2nd ed. New York: Churchill Livingstone; 2000. [Google Scholar]
- Schmoor C, Olschewski M, Schumacher M. Randomized and Non-Randomized Patients in Clinical Trials: Experiences with Comprehensive Cohort Studies. Statistics in Medicine. 1996;15(3):263–71. doi: 10.1002/(SICI)1097-0258(19960215)15:3<263::AID-SIM165>3.0.CO;2-K. 10.1002/(SICI)1097-0258(19960215)15:3<263::AID-SIM165>3.0.CO;2-K. [DOI] [PubMed] [Google Scholar]
- Segman RH, Heresco-Levy U, Finkel B, Goltser T, Shalem R, Schlafman M, Dorevitch A, Yakir A, Greenberg D, Lerner A, Lerer B. Association between the Serotonin 2A Receptor Gene and Tardive Dyskinesia in Chronic Schizophrenia. Molecular Psychiatry. 2001;6:225–9. doi: 10.1038/sj.mp.4000842. 10.1038/sj.mp.4000842. [DOI] [PubMed] [Google Scholar]
- Senn S. Individual Response to Treatment: Is It a Valid Assumption? BMJ. 2004;329:966–8. doi: 10.1136/bmj.329.7472.966. [DOI] [PMC free article] [PubMed] [Google Scholar]
- Senn S, Harrell F. On Wisdom after the Event. Journal of Clinical Epidemiology. 1997;50:749–51. doi: 10.1016/s0895-4356(97)00023-1. 10.1016/S0895-4356(97)00023-1. [DOI] [PubMed] [Google Scholar]
- Sherbourne CD, Hays RD, Ordway L, DiMatteo MR, Kravitz RL. Antecedents of Adherence to Medical Recommendations: Results from the Medical Outcomes Study. Journal of Behavioral Medicine. 1992;15(5):447–68. doi: 10.1007/BF00844941. [DOI] [PubMed] [Google Scholar]
- Shiffman RN, Shekelle P, Overhage JM, Slutsky J, Grimshaw J, Deshpande AM. Standardized Reporting of Clinical Practice Guidelines: A Proposal from the Conference on Guideline Standardization. Annals of Internal Medicine. 2003;139:493–8. doi: 10.7326/0003-4819-139-6-200309160-00013. [DOI] [PubMed] [Google Scholar]
- Silber JH, Williams SV, Krakauer H, Schwartz JS. Hospital and Patient Characteristics Associated with Death after Surgery. A Study of Adverse Occurrence and Failure to Rescue. Medical Care. 1992;30(7):615–29. doi: 10.1097/00005650-199207000-00004. [DOI] [PubMed] [Google Scholar]
- Sindrup SH, Brosen K. The Pharmacogenetics of Codeine Hypoalgesia. Pharmacogenetics. 1995;5(6):335–46. doi: 10.1097/00008571-199512000-00001. [DOI] [PubMed] [Google Scholar]
- Sorensen TIA. Which Patients May Be Harmed by Good Treatments? Lancet. 1996;348:351–2. doi: 10.1016/s0140-6736(05)64988-4. [DOI] [PubMed] [Google Scholar]
- Stroke Prevention in Atrial Fibrillation Investigators. 1994. Risk Factors for Stroke and Efficacy of Antithrombotic Therapy in Atrial Fibrillation. Analysis of Pooled Data from Five Randomized Controlled Trials. Archives of Internal Medicine. 154(13):1449–57. 10.1001/archinte.154.13.1449. [PubMed] [Google Scholar]
- Sykes R. New Medicines, the Practice of Medicine, and Public Policy. London: HMSO; 2000. [Google Scholar]
- Tanenbaum SJ. What Physicians Know. New England Journal of Medicine. 1993;329:1268–71. doi: 10.1056/NEJM199310213291713. 10.1056/NEJM199310213291713. [DOI] [PubMed] [Google Scholar]
- U.S. Preventive Services Task Force. Chemoprevention of Breast Cancer: Recommendations and Rationale. Annals of Internal Medicine. 2002;137(1):56–8. doi: 10.7326/0003-4819-137-1-200207020-00016. [DOI] [PubMed] [Google Scholar]
- Volk RJ, Cantor SB, Cass AR, Spann SJ, Weller SC, Krahn MD. Preferences of Husbands and Wives for Outcomes of Prostate Cancer Screening and Treatment. Journal of General Internal Medicine. 2004;19(4):339–48. doi: 10.1111/j.1525-1497.2004.30046.x. 10.1111/j.1525-1497.2004.30046.x. [DOI] [PMC free article] [PubMed] [Google Scholar]
- Walter L, Davidowitz NP, Heineken PA, Covinsky KE. Pitfalls of Converting Practice Guidelines into Quality Measures: Lessons Learned from a VA Performance Measure. Journal of the American Medical Association. 2004;291:2466–70. doi: 10.1001/jama.291.20.2466. 10.1001/jama.291.20.2466. [DOI] [PubMed] [Google Scholar]
- Weinshilboum R. Inheritance and Drug Response. New England Journal of Medicine. 2003;348:529–37. doi: 10.1056/NEJMra020021. 10.1056/NEJMra020021. [DOI] [PubMed] [Google Scholar]
- Yusuf S, Wittes J, Probstfield J, Tyroler HA. Analysis and Interpretation of Treatment Effects in Subgroups of Patients in Randomized Trials. Journal of the American Medical Association. 1991;266:93–8. 10.1001/jama.266.1.93. [PubMed] [Google Scholar]
- Zelen M. Randomized Consent Designs for Clinical Trials: An Update. Statistics in Medicine. 1990;9(6):645–56. doi: 10.1002/sim.4780090611. [DOI] [PubMed] [Google Scholar]
- Zwart S, Rovers MM, Melker RA, Hoes AW. Penicillin for Acute Sore Throat in Children: Randomized, Double Blind Trial. BMJ. 2003;327:1324–7. doi: 10.1136/bmj.327.7427.1324. [DOI] [PMC free article] [PubMed] [Google Scholar]