Abstract
Large-conductance (BKCa type) Ca2+-activated K+ channels encoded by the Slo1 gene and various canonical transient receptor potential channels (TRPCs) are coexpressed in many cell types, including podocytes (visceral epithelial cells) of the renal glomerulus. In this study, we show by coimmunoprecipitation and GST pull-down assays that BKCa channels can associate with endogenous TRPC3 and TRPC6 channels in differentiated cells of a podocyte cell line. Both types of TRPC channels colocalize with Slo1 in podocytes and in human embryonic kidney (HEK) 293T cells transiently coexpressing the TRPC channels with Slo1. In HEK293T cells, coexpression of TRPC6 increased surface expression of a Slo1 subunit splice variant (Slo1VEDEC) that is typically retained in intracellular compartments, as assessed by cell-surface biotinylation assays and confocal microscopy. Corresponding currents through BKCa channels were also increased with TRPC6 coexpression, as assessed by whole-cell and excised inside-out patch recordings. By contrast, coexpression of TRPC3 had no effect on the surface expression of BKCa channels in HEK293T cells or on the amplitudes of currents in whole cells or excised patches. In podocytes, small interfering RNA knockdown of endogenous TRPC6 reduced steady-state surface expression of endogenous Slo1 channels, but knockdown of TRPC3 had no effect. TRPC6, but not TRPC3 knockdown also reduced voltage-evoked outward current through podocyte BKCa channels. These data indicate that TRPC6 and TRPC3 channels can bind to Slo1, and this colocalization may allow them to serve as a source of Ca2+ for the activation of BKCa channels. TRPC6 channels also play a role in the regulation of surface expression of a subset of podocyte BKCa channels.
Large-conductance Ca2+-activated K+ channels (BKCa channels) encoded by the Slo1 gene (also known as KCNMA1) are expressed in a wide range of excitable and nonexcitable tissues and regulate many physiological processes. Binding of Ca2+ to multiple sites in the cytoplasmic C terminus of BKCa channels shifts their activation voltage-dependence into the physiological range of membrane potentials. BKCa channels typically exhibit a relatively low affinity for Ca2+, and robust activation only occurs at concentrations of Ca2+ that are orders of magnitude higher than those that occur in the bulk of the cytosol. However, Ca2+ concentrations are transiently much higher in the vicinity of open pores of Ca2+-permeable channels, with the resulting spatial distribution of Ca2+ and the rate of its dissipation determined primarily by the kinetics and capacity of cytosolic Ca2+-buffering systems (Stern, 1992; Naraghi and Neher, 1997; Prakriya and Lingle, 2000).
Experimental manipulations of cytosolic Ca2+ buffering suggest that activation of BKCa channels requires at least partial colocalization with Ca2+-permeable channels in the plasma membrane (Prakriya and Lingle, 2000). Consistent with this, BKCa channels in brain have been demonstrated to bind to the subunits of different types of voltage-activated Ca2+ channels, resulting in the formation of multichannel complexes (Grunnet and Kaufmann, 2004; Berkefeld et al., 2006; Loane et al., 2007; Zou et al., 2008). This arrangement provides a structural basis for fast negative feedback, because Ca2+-dependent activation of BKCa channels leads to neuronal repolarization, deactivation of voltage-activated Ca2+ channels, and termination of Ca2+ influx.
However, BKCa channels are also expressed in variety of nonexcitable cells, including epithelial cells, endothelial cells, blood cells, and even in bone (Lu et al., 2006). Many of these cell types lack voltage-activated Ca2+ channels, and the question arises as to the sources of Ca2+ that initiate physiological activation of BKCa channels in those cellular contexts. One possibility is that BKCa channels are coupled to other types of Ca2+-permeable channels, such as various members of the canonical transient receptor potential (TRPC) family of channels (Venkatachalam and Montell, 2007). The seven TRPC channels are members of a larger TRP superfamily of cation channels, all of which are composed of four pore-forming subunits that have six transmembrane domains and intracellular N and C termini. TRPC channels have multiple ankyrin repeat domains in the N terminus, and some of them also have PDZ-binding motifs in the C terminus, which provide considerable potential for protein-protein interactions (Venkatachalam and Montell, 2007).
In the present study, we address whether there are interactions between BKCa channels and TRPC channels in a nonexcitable cell. We have focused on podocytes (also known as visceral epithelial cells), a specialized population of renal cells that play a critical role in glomerular filtration (Pavenstädt et al., 2003). Previous studies have established that podocyte TRPC6 channels play an important role in podocyte function and glomerular filtration (Reiser et al., 2005; Winn et al., 2005; Möller et al., 2007), and that podocytes express multiple splice variants of BKCa channels and their associated β-subunits (Morton et al., 2004; Kim et al., 2008). Here we show that cytosolic domains of the pore-forming subunits of BKCa channels associate with TRPC6 and TRPC3 channels, both of which are expressed in podocytes (Reiser et al., 2005; Winn et al., 2005; Goel et al., 2006). Moreover, we show that coexpression of TRPC6 with certain splice variants of BKCa channels increases the expression of the resulting channel complex on the cell surface but that this does not occur with coexpression of TRPC3.
Materials and Methods
Cell Culture and Transfection. These procedures were described in detail previously (Kim et al., 2008). In brief, HEK293T cells were grown in Dulbecco's modified Eagle's medium (Sigma, St. Louis, MO) containing 10% heat-inactivated fetal bovine serum at 37°C in a 5% CO2 incubator. Transfection of full-length plasmids into HEK293T cells occurred with an efficiency of >90%. A mouse podocyte cell line was kindly provided by Dr. Peter Mundel of the Mount Sinai School of Medicine (New York, NY). These cell lines were not tested for mycoplasmal contamination. Podocytes were maintained in RPMI 1640 medium (Invitrogen, Carlsbad, CA) supplemented with 10% fetal bovine serum and 100 U/ml penicillin/streptomycin, in humidified incubators in 5% CO2. Podocytes were propagated on collagen I-coated plates at 33°C in the presence of recombinant mouse γ-interferon (10 U/ml) (Sigma). Removal of γ-interferon and a temperature switch to 37°C induced podocyte differentiation, a process that was complete in 2 weeks. Methods for transfecting podocytes with small interfering RNAs (siRNAs) were described previously (Kim et al., 2008). Cells were used for biochemistry or electrophysiology 48 h after transfection.
Plasmid Constructs. Expression plasmids encoding NH3-terminal Myc-tagged Slo1VEDEC and Slo1QEERL isoforms of Slo1 were kindly provided by Dr. Min Li of the Department of Neuroscience at The Johns Hopkins University (Baltimore, MD). They encode identical proteins except at the extreme COOH termini (Ma et al., 2007). Plasmids encoding glutathione transferase (GST)-Slo1VEDEC and GST-Slo1QEERL were described previously (Kim et al., 2007a). Those soluble fusion proteins contain domains at the extreme COOH terminus that are unique to each splice variant. A plasmid encoding full-length TRPC6 was obtained from Dr. Mike Zhu of the Center for Molecular Neurobiology at The Ohio State University (Columbus, OH). Plasmids encoding TRPC3 were obtained from Dr. Craig Montell of the Department of Biological Chemistry at The Johns Hopkins University. We obtained siRNAs directed against mouse TRPC3 and TRPC6 from Santa Cruz Biotechnology (Santa Cruz, CA). We obtained a negative control siRNA composed of a scrambled sequence from the same vendor.
Electrophysiology and Data Analysis. All recordings were made at room temperature (22°C). Whole-cell recordings of BKCa channels from HEK293T cells were made as described previously (Kim et al., 2007a). In brief, plasmids encoding green fluorescent protein were cotransfected with ion channel constructs to allow for the identification of transfected cells by fluorescence microscopy during recordings. The bathing solution contained 150 mM NaCl, 0.08 mM KCl, 0.8 mM MgCl2, 5.4 mM CaCl2, 10 mM glucose, and 10 mM HEPES, and the pH was adjusted to 7.4 with NaOH. The pipette solution contained 145 mM NaCl, 2 mM KCl, 6.2 mM MgCl2, 10 mM HEPES, and 5 mM N-hydroxy-EDTA (HEDTA), pH 7.2. The free Ca2+ concentration in this solution was adjusted to 10 μM as determined using an Orion 97-20 calcium electrode (Thermo Fisher Scientific, Waltham, MA). For measurements of whole-cell currents through endogenous BKCa channels in podocytes, the bath solution contained 150 mM NaCl, 5.4 mM KCl, 0.8 mM MgCl2, 5.4 mM CaCl2, and 10 mM HEPES, pH 7.4. Pipette solutions contained 10 mM NaCl, 125 mM KCl, 6.2 mM MgCl2, 10 mM HEPES, pH 7.2, and 5 μM free Ca2+ buffered with 10 mM HEDTA, as determined with the calcium electrode. Whole-cell currents were evoked by a series of depolarizing steps from a holding potential of -60 mV. For all whole-cell recordings, the recording electrodes had resistances of 3 to 4MΩ, and it was possible to compensate up to 85% of this without introducing oscillations into the current output of the patch-clamp amplifier (Axopatch 1D; Molecular Devices, Sunnyvale, CA). Data were digitized using a Digidata 1322A interface (Molecular Devices) and stored on magnetic hard disks for off-line analysis using pClamp software. Inside-out patch recordings from HEK293T cells were made as described previously (Zou et al., 2008). In brief, fire-polished glass micropipettes were filled with a solution containing 140 mM KCl, 1.2 mM MgCl2, 14 mM glucose, and 10 mM HEPES, pH 7.2, and had resistances of 2 to 5 MΩ after filling. Bath solutions contained 140 mM KCl, 1.2 mM MgCl2, 14 mM glucose, and 10 mM HEPES, pH 7.2, and no added Ca2+ plus 10 mM EGTA or 10 μM free Ca2+ buffered with 10 mM HEDTA. Currents were evoked by a series of 150-ms depolarizing steps from a holding potential of -80 mV. Procedures for constructing and fitting activation curves were described previously (Zou et al., 2008).
Cell-Surface Biotinylation Assays. These were carried out as described in detail previously (Kim et al., 2007c, 2008). In brief, podocytes were treated with a membrane-impermeable biotinylation reagent, sulfo-N-hydroxy-succinimidobiotin (1 mg/ml in PBS buffer; Pierce Biotechnology, Rockford, IL) for 1 h. The reaction was stopped, cells were lysed, and biotinylated proteins from the cell surface were recovered from lysates by incubation with immobilized streptavidin-agarose beads (Pierce Biotechnology). A sample of the initial cell lysate was retained for analysis of total proteins. These samples were separated on SDS-polyacrylamide gel electrophoresis, and proteins were quantified by immunoblot analysis followed by densitometry using ImageJ software (http://rsb.info.nih.gov/ij/). Quantification was carried out on the main (monomeric) band of Slo1. All biochemical experiments were repeated at least three times.
Coimmunoprecipitation and Immunoblot Analysis and GST Pull-Down Assays. These were done as described previously (Kim et al., 2007a,c; Zou et al., 2008). In brief, HEK293T cells or podocytes were lysed in 50 mM Tris-Cl, pH 7.6, 150 mM NaCl, 1% Triton X-100, 1% sodium deoxycholate, 2 mM EDTA, 1 mM phenylmethylsulfonyl fluoride, and protease inhibitor mixture (Sigma). Lysates were cleared by centrifugation, and the resulting extracts (500 μg of protein) were incubated in the presence of primary antibodies, which included anti-Myc (Cell Signaling Technology, Danvers, MA), anti-TRPC3 (Alomone Labs, Jerusalem, Israel), anti-TRPC6 (Millipore Bioscience Research Reagents, Temecula, CA; and Alomone Labs), anti-Slo1 (Millipore Bioscience Research Reagents), or IgG (1-2 μg) for 4 h at 4°C. In some experiments, lysates were incubated with primary antibodies that had been preabsorbed with the peptide antigens supplied by the manufacturers (1 μg of peptide/1 μg of antibody) for 4 h on ice. We then added 20 μl of protein A/G agarose (Santa Cruz Biotechnology) to the lysates and incubated for 12 h. Pellets were washed, boiled for 5 min in SDS sample buffer, and proteins were separated by SDS-polyacrylamide gel electrophoresis on 10% gels and transferred to filters. Cell-extracted protein (50-100 μg) was used as control in each experiment. Blots were blocked, washed, incubated with the primary antibody overnight at 4°C, washed again, and the membrane was incubated with horseradish peroxidase-conjugated secondary antibody for 1 h at room temperature. The proteins were visualized using a chemiluminescent substrate (SuperSignal West Pico; Pierce Biotechnology). Note that in these experiments, a sample of cell lysate was saved and used to visualize electrophoretic mobility of the interacting proteins, and is labeled as “Input” in the figures. It is not intended for quantification of the amounts of interacting protein present. GST pull-down assays were performed as described previously (Kim et al., 2008).
Confocal Microscopy. HEK293T cells were transfected with myc-tagged Slo1VEDEC with or without TRPC3 or TRPC6. To measure surface expression of Slo1, cells were subsequently exposed to fluorescein-conjugated goat anti-Myc (Abcam, Cambridge, MA) (1:500) in Opti-MEM medium for 1 h at 37°C to label surface Slo1 channels. Cells were then washed in PBS, fixed by 30-min exposure to 4% paraformaldehyde in PBS, rinsed in PBS, blocked with 10% normal goat serum, and then permeabilized in PBS containing 0.5% Triton X-100. They were then incubated with mouse anti-myc antibody (1:1000) for 1 h (antibody 9B11) and then exposed to Alexa Fluor 568-conjugated anti-mouse IgG (1:1000; Invitrogen, Carlsbad, CA) for 1 h to label intracellular Slo1 channels. The cells were then rinsed in PBS and mounted using Vectashield (Vector Laboratories, Burlingame, CA). Laser excitation intensities and detector sensitivities were held constant to facilitate comparison of surface expression of Slo1. In other experiments, the surface expression of Slo1 was compared with wheat germ agglutinin (WGA), a marker for the cell surface. HEK293T cells were transfected with myc-tagged Slo1VEDEC with or without TRPC3 or TRPC6. Cells were subsequently exposed to fluorescein-conjugated goat anti-myc (Abcam) (1:500) along with Alexa Fluor 594-conjugated WGA (1 mg) in Opti-MEM medium for 1 h at 37°C. Cells were then washed in PBS, fixed by 30-min exposure to 4% paraformaldehyde in PBS, rinsed in PBS, and then examined by confocal microscopy (see below). To assess colocalization of Slo1 and TRPC channels in HEK293T cells and podocytes, cells were fixed in 4% paraformaldehyde, blocked, permeabilized in PBS with 0.3% Tween 20, and exposed to a monoclonal anti-Slo1 and rabbit anti-TRPC3 or anti-TRPC6. The monoclonal antibody against Slo1 (clone L6/60) was obtained from the University of California Davis/National Institute of Neurological Disorders and Stroke/National Institute of Mental Health NeuroMab Facility. Secondary antibodies were Alexa Fluor 488-conjugated anti-rabbit and Alexa Fluor 594-conjugated anti-mouse (1:1000 dilution; both from Invitrogen). All images were collected on an Olympus FV-1000 inverted stage confocal microscope (Olympus, Tokyo, Japan) using a Plan Apo N 60 × 1.42 numerical aperture oil-immersion objective. In studies of colocalization in podocytes, stacks of images from different Z-planes were obtained using a step size of 200 nm, and fluorescent signals from different channels were scanned sequentially. Images that show colocalization of proteins are from the same optical section and were quantified by Olympus Fluoview version 1.7 software. For analyses of Slo1 surface expression, fluorescent intensity from the fluorescein-conjugated goat anti-myc and Alexa Fluor 568-conjugated anti-mouse IgG or Alexa Fluor 594-conjugated WGA was quantified in fields surrounding the same individual HEK293T cells using Photoshop version 5.5 (Adobe Systems, Mountain View, CA). The tagged image file format images were not processed before measurement.
Statistics. All quantitative data are presented as mean ± S.E.M., and bar graphs were constructed from a minimum of 15 cells in each group. Data were analyzed by Student's t test and by one-way analysis of variance followed by post hoc analysis when multiple comparisons were made. Throughout, p < 0.05 is regarded as significant.
Results
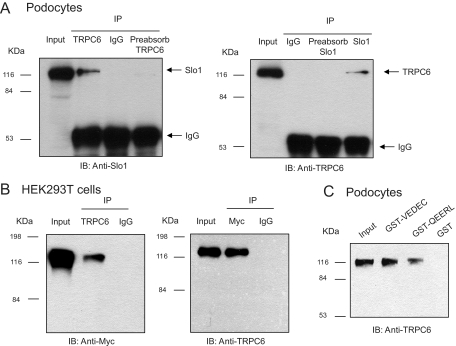
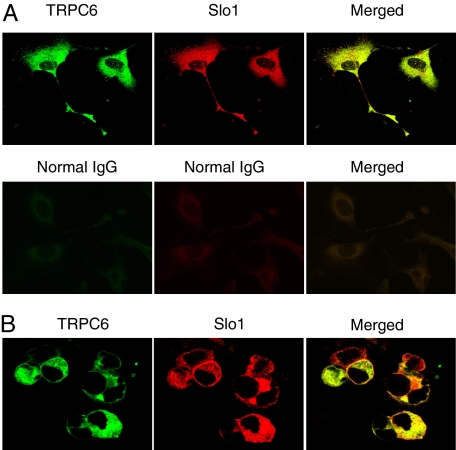
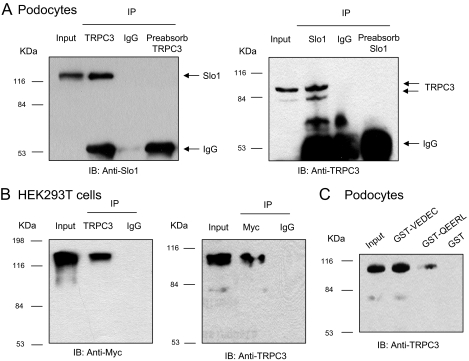
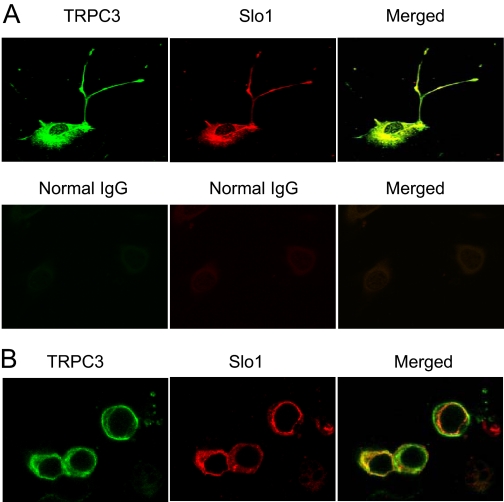
The initial experiments in this study addressed whether BKCa channels can associate with TRPC channels in differentiated cells of a podocyte cell line (Mundel et al., 1997; Saleem et al., 2002; Pavenstädt et al., 2003). These cells proliferate freely when grown under permissive conditions (33°C). However, placing these cells in nonpermissive conditions (37°C) causes them to stop growing and over 14 to 24 days to express many features of differentiated podocytes. Specifically, they extend primary processes that terminate in foot processes, and they express essential podocyte markers including nephrin, Neph1, podocin, CD2AP, and synaptopodin (Pavenstädt et al., 2003; Kim et al., 2008). We observed that Slo1, the pore-forming subunit of BKCa channels, could be detected in immunoprecipitates isolated from podocyte extracts using a polyclonal antibody against TRPC6 (Fig. 1A, left). This interaction was also seen with the reciprocal procedure, in which the initial immunoprecipitation was carried out using an antibody against Slo1, and immunoblot was carried out with an antibody against TRPC6 (Fig. 1A, right). Note that the interaction was not observed in either direction when the initial precipitation was carried out with an antibody that had been preabsorbed with its antigen. In a separate set of experiments, we transiently coexpressed TRPC6 and an myc-tagged Slo1 in HEK293T cells, and carried out coimmunoprecipitation experiments (Fig. 1B). We again observed an association between Slo1 and TRPC6 when initial precipitation was carried out using an antibody against TRPC6 (Fig. 1B, left) and when it was done with a monoclonal antibody against the ectofacial myc tag on Slo1 (Fig. 1B, right). A Slo1-TRPC6 interaction was also seen by means of GST pull-down assays using GST-Slo1 constructs described previously (Kim et al., 2007a, 2008). In brief, podocytes express two different Slo1 splice variants known as Slo1VEDEC and Slo1QEERL after the last five residues at the COOH terminus of each isoform (Kim et al., 2008). These variants exhibit different patterns of trafficking in several cell types, and constitutive expression of Slo1VEDEC on the cell surface is reduced compared with other Slo1 variants (Kim et al., 2007b; Ma et al., 2007). In this study, we observed that GST fusion proteins containing the COOH-terminal domains of both splice variants could pull TRPC6 channels out of podocyte cell lysates but that GST was ineffective (Fig. 1C). In addition, we observed by confocal microscopy that endogenous TRPC6 and Slo1 channels closely colocalize in podocytes (Fig. 2A) and in HEK293T cells heterologously expressing Slo1VEDEC with TRPC6 (Fig. 2B). Pixel-by-pixel comparison showed Slo1 and TRPC6 colocalization of 91.71 ± 0.92% in podocytes (n = 60 cells) and 93.88 ± 0.79% in HEK293T cells (n = 60 cells). Both channels are expressed throughout the cell, except for in the nuclei. A similar pattern was obtained with TRPC3 channels using the same methods (Figs. 3 and 4) although it bears noting that the amount of colocalization of Slo1VEDEC with TRPC3 is somewhat less than we observed with TRPC3, especially in HEK293T cells (compare Fig. 2B and 4B). Thus, we observed Slo1 and TRPC6 colocalization of 80.67 ± 1.12% in podocytes (n = 60 cells) and only 68.83 ± 2.05% in HEK293T cells (n = 60 cells). This quantitative difference may be due to different effects of the two TRPC channels on Slo1 trafficking to the cell surface as discussed further below. Note that the GST pull-down assays indicate that both forms of TRPC channels can interact with both of the Slo1 variants that we have detected in podocytes.
Fig. 1.
Biochemical interaction between TRPC6 and BKCa channels. A, coimmunoprecipitation of TRPC6 and Slo1 channels in podocyte lysates. Slo1 channels can be detected in immunoprecipitates prepared using an antibody against TRPC6 (left), and TRPC6 channels can be detected in immunoprecipitates prepared with an antibody against Slo1 (right). In this and subsequent figures, the lane marked “Input” refers to a sample of the original cell lysate from podocytes. It is intended only to show electrophoretic mobility and is not for quantitation. The lanes marked “preabsorb” are samples in which the initial immunoprecipitation was carried out with an antibody treated previously with its antigen. Note a lack of signal in these lanes. B, similar coimmunoprecipitation experiment carried out on lysates of HEK293T cells transiently coexpressing TRPC6 and myc-tagged Slo1VEDEC (Kim et al., 2008). Left blot shows myc tags of Slo1 detected by immunoblot of precipitates prepared using antibody against TRPC6, whereas the right blot shows results of the reciprocal procedure. C, GST pull-down assay showing that TRPC6 can be detected among the proteins in podocyte lysates that interact with the COOH domains of two different Slo1 splice variants that are expressed in podocytes.
Fig. 2.
Colocalization of TRPC6 and Slo1 channels. Confocal analyses of native channels in podocytes (A) and of HEK293T cells transiently coexpressing Slo1VEDEC and TRPC6 (B). Note extensive colocalization in both preparations.
Fig. 3.
Biochemical interaction between TRPC3 and BKCa channels. A, coimmunoprecipitation of TRPC3 and Slo1 channels in podocyte lysates. Slo1 channels can be detected in immunoprecipitates prepared using an antibody against TRPC6 (left), and TRPC6 channels can be detected in immunoprecipitates prepared with an antibody against Slo1 (right). B, similar coimmunoprecipitation experiment carried out on lysates of HEK293T cells transiently coexpressing TRPC3 and myc-tagged Slo1VEDEC. Left blot shows myc tags of Slo1 detected by immunoblot of precipitates prepared using antibody against TRPC3, whereas the right blot shows results of the reciprocal procedure. C, GST pull-down assay showing that TRPC3 can be detected among the proteins in podocyte lysates that interact with the COOH domains of two different Slo1 splice variants that are expressed in podocytes.
Fig. 4.
Colocalization of TRPC3 and Slo1 channels. Confocal analyses of native channels in podocytes (A) and of HEK293T cells podocytes. There is less colocalization in HEK293T cells, as signal from TRPC3 channels is intense on the cell periphery, where signal from Slo1VEDEC channels seems to be weak.
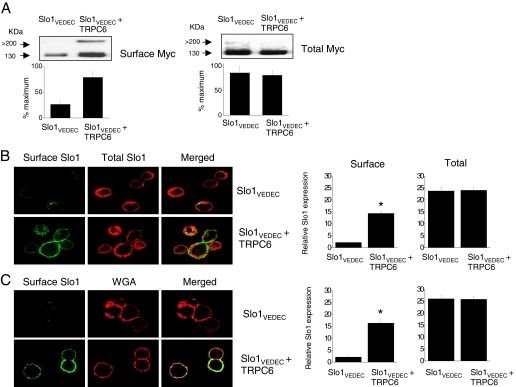
The TRPC-Slo1 interactions seem to be physiologically significant, because we observed that interactions with TRPC6 can regulate BKCa trafficking. To address this, we first examined the effects of coexpressing TRPC6 or TRPC3 with Slo1 channels in HEK293T cells. In previous studies, we and others have shown that different Slo1 splice variants exhibit different patterns of trafficking in several cell types and that Slo1VEDEC tends to be retained in intracellular compartments (Kim et al., 2007b,c, 2008; Ma et al., 2007). Here we observed that coexpression of TRPC6 causes an increase in steady-state myc-tagged Slo1VEDEC expression on the surface of HEK293T cells, as ascertained by several independent experimental measures. Thus, cell-surface biotinylation assays showed a marked increase in the amount of myc-tagged Slo1VEDEC that is expressed on the cell surface but no effect of total myc-tagged Slo1 in the presence of TRPC6 (Fig. 5A). A similar pattern can be seen in confocal assays in which myc-tagged Slo1VEDEC is expressed by itself or with TRPC6, and surface channels in intact cells are labeled with an FITC-conjugated rabbit anti-myc. The cells are then fixed and permeabilized, and intracellular Slo1VEDEC channels are visualized with a mouse anti-myc and an Alexa Fluor 584-conjugated anti-mouse IgG (Fig. 5B). Laser excitation intensities and detector sensitivities were held constant in the collection of these images. For comparison, we also compared the signal from intact cell surface Slo1 with that of WGA, a marker for the cell surface when it is applied to intact cells (Fig. 5C). We then quantified surface or total signal intensity from 50 cells in each group. We observed a ∼7-fold increase in surface Slo1VEDEC signal in cells coexpressing TRPC6 compared with cells expressing Slo1VEDEC by itself (Fig. 5, B and C, right). These experiments indicate that Slo1VEDEC channels expressed alone accumulate in intracellular compartments and have low rates of constitutive trafficking to the cell surface but that coexpression of TRPC6 results in greater expression of Slo1VEDEC on the cell surface.
Fig. 5.
Coexpression of TRPC6 increases surface expression of myc-tagged Slo1VEDEC channels in HEK293T cells. A, cell-surface biotinylation assays show increase in surface expression of myc-tagged Slo1VEDEC in HEK293T cells coexpressing TRPC6 using an antibody against the myc tag. Bar graphs below the blots show densitometric analyses from three repetitions of this experiment. Data are from the main Slo1 monomer signal (∼130 kDa). B, confocal microscopy showing that coexpression of TRPC6 increases the surface expression of Slo1 (green fluorescence) but has no effect on intracellular Slo1 (red fluorescence). FITC-tagged rabbit anti-myc was applied to intact cells before fixation and permeabilization. A mouse anti-myc was then applied and labeled with an Alexa Fluor 568-conjugated anti-mouse secondary antibody. Laser and detector sensitivities were held constant throughout this experiment. C, surface Slo1 is labeled with FITC-conjugated anti-myc, and surface membranes are labeled with Alexa Fluor 594-conjugated WGA before fixation. Note an increase in surface Slo1 with coexpression of TRPC6. Bar graphs to the right of the confocal images are the average signal intensity (in arbitrary units) from 50 cells in each group. Asterisks indicate P < 0.05.
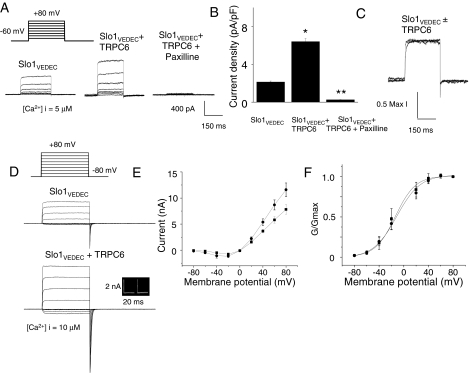
The increase in surface expression of Slo1VEDEC was also observed in two different types of electrophysiological assays carried out on HEK293T cells. The first of these was based on whole-cell recordings using pipettes containing 10 μM free Ca2+ buffered with HEDTA, as described previously (Kim et al., 2007a,b,c, 2008). In these experiments, the concentration of K+ inside and outside the cells is reduced to prevent the large macroscopic currents from saturating the patch-clamp amplifier, although the K+ reversal potential (EK) is physiological (-85 mV). With this protocol, the Ca2+ inside the cell is buffered at a level that is sufficiently high that currents evoked by depolarizing voltage steps to +80 mV should primarily reflect the total number of BKCa channels on the cell surface. We observed that coexpression of TRPC6 with Slo1VEDEC caused a 2- to 3-fold increase in the mean current observed using this protocol (Fig. 6, A and B). Currents evoked using this protocol are completely blocked by the selective BKCa blocker paxilline. Coexpression of TRPC6 had no effect on the kinetics of activation, which can be seen when traces are plotted on different amplitude scales and superimposed (Fig. 6C). This result is consistent with the hypothesis that the increase in amplitude reflects changes in the number of channels rather than changes in their gating properties or in Ca2+ availability.
Fig. 6.
Coexpression of TRPC6 increases the number of functional cell surface BKCa channels in HEK293T cells expressing Slo1VEDEC. A, typical families of voltage-evoked outward currents observed in whole-cell recordings using recording electrodes containing 5 μM free Ca2+. Traces to the right show currents from cell after treatment with the BKCa blocker paxilline (10 μM). B, compilation of similar results from many cells (>15 in each group) based on mean currents at +80 mV. Asterisks and double asterisks indicate P < 0.05 compared with controls. C, superimposed traces evoked by depolarizing steps to +80 mV in two different cells. In one, Slo1VEDEC was expressed by itself; in the other, it was coexpressed with TRPC6. The amplitudes of the two traces are normalized to allow direct a comparison of activation kinetics, which were not affected by TRPC6 coexpression. D, typical traces from inside-out patches from HEK293T cells. In these traces, the bath salines contained 10 μM free Ca2+, the K+ concentrations on each side of the patch membrane were symmetrical, and currents were evoked by depolarizing voltage steps, as shown. Mean current-voltage diagrams (E) and activation curves (F) were compiled from five repetitions of these experiments. They show that TRPC6 coexpression increases BKCa currents at every membrane potential except for the reversal potential and does not affect the voltage-dependence of BKCa activation.
To address this more directly, we also measured currents in excised inside-out patches from HEK293T cells expressing Slo1VEDEC in the presence or absence of TRPC6 (Fig. 6D). Excised patches were maintained in symmetrical 140 mM KCl, and currents were evoked by a series of depolarizing voltage steps. Currents were not detectable when the bath saline contained Ca2+-free solutions (data not shown), but large currents were observed when the bath solutions contained 10 μM free Ca2+. These were measured, and the data were used to construct current-voltage diagrams (Fig. 6E) and activation curves (Fig. 6F). We observed that currents in the presence of Ca2+ were larger at all voltages in HEK293T cells coexpressing TRPC6 compared with cells expressing Slo1VEDEC alone but that TRPC6 coexpression had no effect on the voltage-dependence of activation or on the kinetics of the macroscopic currents. Together with the data from biochemistry, confocal microscopy, and whole-cell recordings, these results indicate that coexpression of TRPC6 channels can stimulate steady-state surface expression of Slo1VEDEC channels in the plasma membrane of cells in a heterologous expression system.
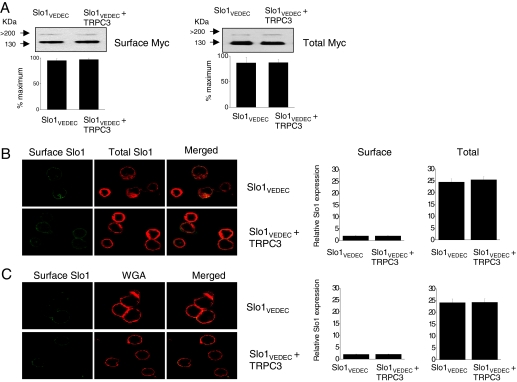
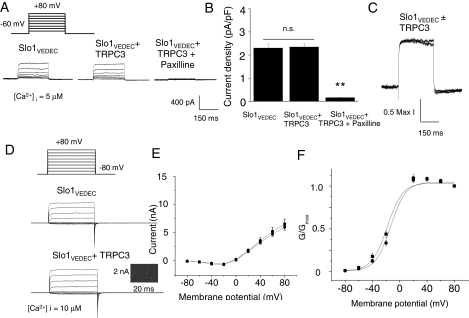
Somewhat surprisingly, given the high degree of sequence homology, a different pattern was observed with coexpression of TRPC3, which did not seem to cause a significant increase in the trafficking of Slo1VEDEC to the surface of HEK293T cells. This was observed with cell-surface biotinylation assays (Fig. 7A) and confocal microscopy (Fig. 7B) and in whole-cell recordings and recordings from excised inside-out patches (Fig. 8) using the same methods described above. As with TCPC6, coexpression of TRPC3 did not affect the voltage-dependence of BKCa activation, pharmacology, or the kinetics of the currents.
Fig. 7.
Coexpression of TRPC3 does not affect the surface expression of myc-tagged Slo1VEDEC channels in HEK293T cells. A, cell-surface biotinylation assays show no effect on surface expression of myc-tagged Slo1VEDEC in HEK293T cells coexpressing TRPC3. B, confocal microscopy showing very low surface expression of Slo1 (green fluorescence) but robust intracellular Slo1 (red fluorescence) in control cells and in cells coexpressing TRPC3. C, surface Slo1 is labeled with FITC-conjugated anti-myc, and surface membranes are labeled with rhodamine-conjugated WGA before fixation. Bar graphs to the right of the confocal images are average signal intensity (in arbitrary units) from 50 cells in each group.
Fig. 8.
Coexpression of TRPC3 does not affect the number of functional cell surface BKCa channels in HEK293T cells expressing Slo1VEDEC. A, typical families of voltage-evoked outward currents observed in whole-cell recordings using recording electrodes containing 5 μM free Ca2+. Note complete inhibition by paxilline of currents in cells coexpressing S1o1VEDEC and TRPC3. B, compilation of similar results from many cells (>15 in each group) based on mean currents at +80 mV. Asterisks indicate P < 0.05. C, superimposed traces evoked by depolarizing steps to +80 mV in two different cells. In one, Slo1VEDEC was expressed by itself, in the other, it was coexpressed with TRPC3. The amplitudes of the two traces are normalized to allow a direct comparison of activation kinetics, which were not affected by TRPC3 coexpression. D, typical traces from inside-out patches from HEK293T cells, as in Fig. 4. Mean current-voltage diagrams (E) and activation curves (F) were compiled from five repetitions of this experiment. They show that TRPC3 coexpression had no effect on BKCa currents.
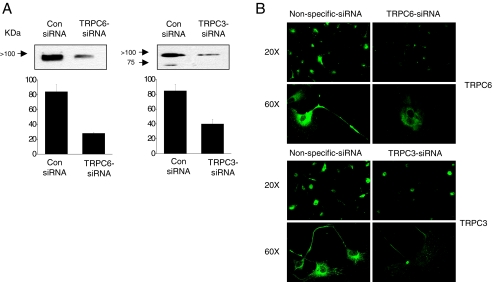
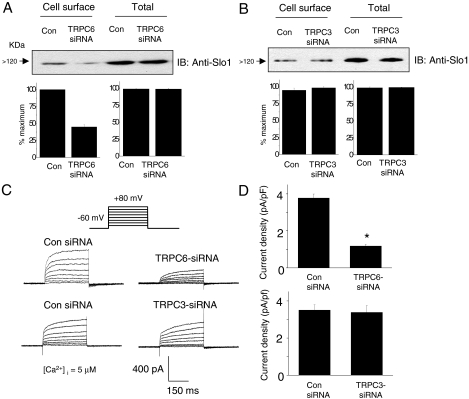
To assess whether similar phenomena occur in podocytes, we used siRNA to selectively reduce the expression of TRPC3 or TRPC6 and then examined the surface expression of BKCa channels. We used immunoblot analyses to assess the effectiveness of the knockdowns compared with cells treated with a control nonspecific siRNA (Fig. 9A). We observed knockdown of greater than 50% in podocyte cultures with either TRPC siRNA based on densitometric analyses of immunoblots. Consistent with this, treatment with TRPC siRNAs reduced the signal strength for corresponding TRPC channels obtained during confocal microscopy of podocytes compared with that obtained in cells treated with control siRNA (Fig. 9B). We then examined the effects of these knockdowns on the steady-state surface expression of Slo1. With cell-surface biotinylation assays, we observed that knockdown of endogenous TRPC6 reduced steady-state surface expression of endogenous Slo1 channels (Fig. 10A), but that knockdown of TRPC3 was ineffective (Fig. 10B), a pattern consistent with what was observed in HEK293T cells. Neither treatment affected the total amounts of Slo1 that could be detected in podocyte lysates. Moreover, we observed that TRPC6 siRNA treatment reduced whole-cell currents in podocytes when recording electrodes were filled with an HEDTA solution that buffered free Ca2+ to 5 μM. These recording conditions chosen to prevent the formation of Ca2+ microdomains were substantially more concentrated than the bulk cytosol (Fig. 10, C and D). By contrast, no effect of TRPC3 siRNA was observed under these recording conditions, consistent with biochemical data and results from HEK293T cells.
Fig. 9.
Application of specific siRNAs cause knockdown of TRPC6 and TRPC3 channels in podocytes. Control cells were treated with a nonspecific siRNA. A, effectiveness of knockdown was demonstrated by immunoblot analysis and densitometric analysis using antibodies against TRPC6 (left) or TRPC3 (right). B, confocal microscopy of podocytes treated with control siRNA or siRNA against TRPC6 (top) or TRPC3 (bottom). Images were collected with 20× and 60× objectives, as indicated. Approximately the same number of cells was present in all of the fields of view obtained with 20× objectives.
Fig. 10.
Knockdown of TRPC6 reduces surface expression of endogenous Slo1 channels in podocytes. Cell-surface biotinylation assays show a reduction in surface expression of Slo1 48 h after siRNA knockdown of TRPC6 (A) but not after knockdown of TRPC3 (B). Bar graphs below the blots in A and B show densitometric analyses of three repetitions of this experiment. Whole-cell voltage-evoked outward currents recorded with electrodes containing 5 μM free Ca2+ are reduced in cells treated with TRPC6 siRNA, but currents are similar to controls in cells treated with TRPC3 siRNA. Families of currents from representative cells are shown in C, and compilations of data from many cells are shown in D (n > 15 cells per group). In these experiments, micromolar concentrations of Ca2+ in the recording electrode were designed to reduce or eliminate the additional effect of any Ca2+ that entered the cells through TRPC channels. Concentrations greater than this were toxic to cells and precluded stable recordings. Cells used for electrophysiology were selected randomly.
Discussion
In this study, we have shown that at least two Ca2+-permeable members of the TRPC family of cation channels, TRPC3 and TRPC6, can interact with the pore-forming subunits of BKCa channels in podocytes and in heterologous systems in which both classes of channels are transiently expressed. The interaction with TRPC6 subunits seems to facilitate the trafficking of Slo1VEDEC channels to the cell surface, but TRPC3 is unable to do this in the two cell types that we have examined. In addition to trafficking, it is possible that these interactions allow TRPC channels to function as a source of Ca2+ for BKCa activation by minimizing the diffusion distance for Ca2+ that enters cells through TRPC channels.
The physical interaction between BKCa and TRPC suggests that BKCa channels may play a role in podocytes that is somewhat different from their role in excitable cells. This is because TRPC6 channels have an unusual and physiologically important biophysical property: their permeability to Ca2+ is highly voltage-dependent. Thus, at more negative membrane potentials, they are permeable to Ca2+, but moderate depolarization causes them to exclude divalent cations, although they continue to carry a substantial outwardly rectifying current via monovalent cations (Estacion et al., 2006). Instead, Ca2+ tends to block TRPC6 pores at more positive potentials (Inoue et al., 2001; Shi et al., 2004; Estacion et al., 2006), a behavior that is also seen with TRPC3 (Albert et al., 2006). On this basis, Schilling and coworkers have pointed out that for TRPC6 channels to be a sustained source of Ca2+ influx, there may need to be a mechanism to limit the amount of depolarization that would otherwise occur as a result of their own activation (Estacion et al., 2006). Physical colocalization of TRPCs with BKCa could allow for coordinated activation of BKCa channels, thereby maintaining the driving force for Ca2+ entry and preventing pore blockade by Ca2+. In other words, in certain nonexcitable cells, BKCa could provide positive feedback to Ca2+ influx, if their activation is coupled to TRPC, which could occur by close spatial colocalization. In the case of podocytes, the presence of BKCa β4 subunits (Morton et al., 2004) could serve to enhance the efficiency of TRPC-BKCa coactivation because these auxiliary proteins make BKCa gating sensitive to even small depolarizations in the presence of micromolar Ca2+ (Wang et al., 2006). These dynamics are quite different from what generally occurs in excitable cells, in which BKCa channels provide negative feedback to Ca2+ influx.
It is likely that interacting TRPC channels and BKCa channels in podocytes are components of a larger complex. For example, we have shown that BKCa channels bind to nephrin (Kim et al., 2008), an adhesion molecule with a large intracellular domain that organizes signaling complexes in podocytes (Faul et al., 2007). TRPC6 channels have also been reported to bind to nephrin (Reiser et al., 2005). Moreover, we have observed that nephrin plays a role in regulating surface expression of Slo1 in podocytes (Kim et al., 2008). The endodomains of nephrin are located in apposition with subjacent cytoskeletal elements that include actin and other contractile elements, suggesting that nephrin is involved in “outside-in” signaling in podocytes (Faul et al., 2007). As part of this complex, BKCa-TRPC coupling in podocytes could to contribute to the mechanosensitivity of Ca2+-regulatory systems in podocyte foot processes. In this regard, there is a report that gating of TRPC6 channels is stretch-sensitive (Spassova et al., 2006), although this result is controversial (Gottlieb et al., 2008). Whatever the case with TRPC channels, there is no question that BKCa channels are sensitive to membrane stretch in a wide variety of cell types (e.g., Huang et al., 2002; Piao et al., 2003; Tang et al., 2003), including podocytes (Morton et al., 2004). Therefore, all other things being equal, one might expect a greater Ca2+ influx when the foot process is subjected to mechanical stress, because of the biophysical considerations mentioned above. Mechanical stimulation could occur, for example, if pressure in glomerular arteries is elevated (Kriz et al., 1994).
In podocytes, we observed that knockdown of TRPC6 causes a reduction in macroscopic outward current through BKCa channels, a phenomenon associated with a decrease in the steady-state surface expression of Slo1. This was not observed after TRPC3 knockdown. Moreover, only TRPC6 was able to increase the surface expression of coexpressed Slo1VEDEC in HEK293T cells. These results were surprising, given the close similarity between TRPC6 and TRPC3; these channels have sequence similarity of 65%, and there are no obvious motifs that are uniquely expressed in the TRPC6 form that can explain this difference. However, the structural differences between the two TRPC forms do not need to be large, because masking of even one or two otherwise exposed residues at the tail of Slo1VEDEC could be sufficient to affect its trafficking. Recall that sorting and trafficking motifs can be as short as two amino acids in length (Teasdale and Jackson, 1996). In this regard, there are reports that trafficking of TRPC3 and TRPC6 is regulated differently in cells of the renal collecting duct, because surface TRPC6 is found in both the apical and basolateral domains, whereas surface TRPC3 is primarily localized to the apical membrane (Goel et al., 2006), and the intracellular pools of these channels seem to be in separate populations of vesicles (Goel et al., 2007).
The experiments described in this study have been performed on endogenous channels in a podocyte cell line and in a heterologous expression system in which TRPC3 or TRPC6 and BKCa channels were transiently expressed. However, it is possible that these results may reflect a situation that occurs in a variety of tissues and cell types in which both classes of channels are expressed. For example, expression of Slo1 and various types of TRPC channels occurs in airway smooth muscle cells (White et al., 2006; Sausbier et al., 2007), renal tubular epithelial cells (Frindt and Palmer, 2004; Goel et al., 2006), and even in osteoblasts (Baldi et al., 2003; Rezzonico et al., 2003). The coupling may be particularly important in those cases in which TRPC channels provide the main source of Ca2+ influx to initiate physiological responses (.e., in cells lacking voltage-gated Ca2+ channels). It is possible that in excitable cells, different subpopulations of BKCa channels inside the same cell play a different role depending on whether they colocalize with TRPC channels, voltagegated Ca2+ channels, or in proximity to subjacent Ca2+ pools.
In summary, we have shown that the pore-forming subunits of BKCa channels form a complex with TRPC6 and TRPC3 channels in podocytes, raising the possibility that members of the TRPC family can provide a source of Ca2+ for BKCa gating. Moreover, we show that interactions of TRPC6 with certain splice variants of BKCa channels increase expression of the resulting channel complex on the cell surface. These interactions may be a common feature in many tissues.
Acknowledgments
We are grateful to Dr. Min Li of The Johns Hopkins University for the myc-tagged Slo1 expression constructs, Dr. Craig Montell of The Johns Hopkins University for TRPC3 expression constructs, and Dr. Mike Zhu of The Ohio State University for TRPC6 expression constructs.
This work was supported by a Grant to Enhance and Advance Research (GEAR) from the University of Houston. The monoclonal antibody against Slo1 (clone L6/60) was obtained from the University of California Davis/National Institute of Neurological Disorders and Stroke/National Institute of Mental Health NeuroMab Facility, supported by the National Institutes of Health National Institute of Neurological Disorders and Stroke [Grant U24-NS050606].
ABBREVIATIONS: BKCa channels, large-conductance Ca2+-activated K+ channels; HEDTA, N-hydroxy-EDTA; PBS, phosphate-buffered saline; PMSF, phenylmethylsulfonyl fluoride; Slo1, pore-forming subunit of large-conductance Ca2+-activated K+ channels; TRPC, canonical transient receptor potential channels; WGA, wheat germ agglutinin; HEK, human embryonic kidney; siRNA, small interfering RNA; FITC, fluorescein isothiocyanate.
References
- Albert AP, Pucovsky V, Prestwich SA, and Large WA (2006) TRPC3 properties of a native constitutively active Ca2+-permeable cation channel in rabbit ear artery myocytes. J Physiol 571 361-369. [DOI] [PMC free article] [PubMed] [Google Scholar]
- Baldi C, Vazquez G, Calvo JC, and Boland R (2003) TRPC3-like protein is involved in the capacitative cation entry induced by 1alpha, 25-dihydroxy-vitamin D3 in ROS 17/2.8 osteoblastic cells. J Cell Biochem 90 197-205. [DOI] [PubMed] [Google Scholar]
- Berkefeld H, Sailer CA, Bildl W, Rohde V, Thumfart JO, Eble S, Klugbauer N, Reisinger E, Bischofberger J, Oliver D, et al. (2006) BKCa Cav channel complexes mediate rapid and localized Ca2+-activated K+ signaling. Science 314 615-620. [DOI] [PubMed] [Google Scholar]
- Estacion M, Sinkins WG, Jones SW, Applegate MA, and Schilling WP (2006) TRPC6 expressed in HEK 293 cells forms non-selective cation channels with limited Ca2+ permeability. J Physiol 572 359-377. [DOI] [PMC free article] [PubMed] [Google Scholar]
- Faul C, Asanuma K, Yanagida-Asanuma E, Kim K, and Mundel P (2007) Actin up: regulation of podocyte structure and function by components of the actin cytoskeleton. Trends Cell Biol 17 428-437. [DOI] [PubMed] [Google Scholar]
- Frindt G and Palmer LG (2004) Apical potassium channels in the rat connecting tubule. Am J Physiol Renal Physiol 287 F1030-F1037. [DOI] [PubMed] [Google Scholar]
- Goel M, Sinkins WG, Zuo CD, Estacion M, and Schilling WP (2006) Identification and localization of TRPC channels in the rat kidney. Am J Physiol Renal Physiol 290 F1241-F1252. [DOI] [PubMed] [Google Scholar]
- Goel M, Sinkins WG, Zuo CD, Hopfer U, and Schilling WP (2007) Vasopressin-induced membrane trafficking of TRPC3 and AQP2 channels in cells of the rat renal collecting duct. Am J Physiol Renal Physiol 293 F1476-F1488. [DOI] [PubMed] [Google Scholar]
- Gottlieb P, Folgering J, Maroto R, Raso A, Wood TG, Kurosky A, Bowman C, Bichet D, Patel A, Sachs F, et al. (2008) Revisiting TRPC1 and TRPC6 mechanosensitivity. Pflugers Arch 455 1097-1103. [DOI] [PubMed] [Google Scholar]
- Grunnet M and Kaufmann WA (2004) Coassembly of big conductance Ca2+-activated K+ channels and L-type voltage-gated Ca2+ channels in rat brain. J Biol Chem 279 36445-36453. [DOI] [PubMed] [Google Scholar]
- Huang H, Rao Y, Sun P, and Gong LW (2002) Involvement of actin cytoskeleton in modulation of Ca2+-activated K channels from rat hippocampal CA1 pyramidal neurons. Neurosci Lett 332 141-145. [DOI] [PubMed] [Google Scholar]
- Inoue R, Okada T, Onoue H, Hara Y, Shimizu S, Naitoh S, Ito Y, and Mori Y (2001) The transient receptor potential protein homologue TRP6 is the essential component of vascular alpha1-adrenoceptor-activated Ca2+-permeable cation channel. Circ Res 88 325-332. [DOI] [PubMed] [Google Scholar]
- Kim EY, Choi KJ, and Dryer SE (2008) Nephrin binds to the COOH-terminal of a large-conductance calcium-activated potassium channel isoform and regulates its expression on the cell surface. Am J Physiol Renal Physiol 295 F235-F246. [DOI] [PMC free article] [PubMed] [Google Scholar]
- Kim EY, Ridgway LD, and Dryer SE (2007a) Interactions with filamin A stimulate surface expression of large-conductance Ca2+-activated K+ channels in the absence of direct actin binding. Mol Pharmacol 72 622-630. [DOI] [PubMed] [Google Scholar]
- Kim EY, Ridgway LD, Zou S, Chiu YH, and Dryer SE (2007b) Alternatively spliced C-terminal domains regulate the surface expression of large conductance calcium-activated potassium channels. Neuroscience 146 1652-1661. [DOI] [PMC free article] [PubMed] [Google Scholar]
- Kim EY, Zou S, Ridgway LD, and Dryer SE (2007c) β1-subunits increase surface expression of a large-conductance Ca2+-activated K+ channel isoform. J Neurophysiol 97 3508-3516. [DOI] [PubMed] [Google Scholar]
- Kriz W, Hackenthal E, Nobiling R, Sakai T, Elger M, and Hähnel B (1994) A role for podocytes to counteract capillary wall distension. Kidney Int 45 369-376. [DOI] [PubMed] [Google Scholar]
- Loane DJ, Lima PA, and Marrion NV (2007) Co-assembly of N-type Ca2+ and BK channels underlies functional coupling in rat brain. J Cell Sci 120 985-995. [DOI] [PubMed] [Google Scholar]
- Lu R, Alioua A, Kumar Y, Eghbali M, Stefani E, and Toro L (2006) MaxiK channel partners: physiological impact. J Physiol Lond 570 65-72. [DOI] [PMC free article] [PubMed] [Google Scholar]
- Ma D, Nakata T, Zhang G, Hoshi T, Li M, and Shikano S (2007) Differential trafficking of carboxyl isoforms of Ca2+-gated (Slo1) potassium channels. FEBS Lett 581 1000-1008. [DOI] [PMC free article] [PubMed] [Google Scholar]
- Möller CC, Wei C, Altintas MM, Li J, Greka A, Ohse T, Pippin JW, Rastaldi MP, Wawersik S, Schiavi S, et al. (2007) Induction of TRPC6 channel in acquired forms of proteinuric kidney disease. J Am Soc Nephrol 18 29-36. [DOI] [PubMed] [Google Scholar]
- Morton MJ, Hutchinson K, Mathieson PW, Witherden IR, Saleem MA, and Hunter M (2004) Human podocytes possess a stretch-sensitive, Ca2+-activated K+ channel: potential implications for the control of glomerular filtration. J Am Soc Nephrol 15 2981-2987. [DOI] [PubMed] [Google Scholar]
- Mundel P, Reiser J, and Kriz W (1997) Induction of differentiation in cultured rat and human podocytes. J Am Soc Nephrol 8 697-705. [DOI] [PubMed] [Google Scholar]
- Naraghi M and Neher E (1997) Linearized buffered Ca2+ diffusion in microdomains and its implications for calculation of [Ca2+] at the mouth of a calcium channel. J Neurosci 17 6961-6973. [DOI] [PMC free article] [PubMed] [Google Scholar]
- Pavenstädt H, Kriz W, and Kretzler M (2003) Cell biology of the glomerular podocyte. Physiol Rev 83 253-307. [DOI] [PubMed] [Google Scholar]
- Piao L, Ho WK, and Earm YE (2003) Actin filaments regulate the stretch sensitivity of large-conductance, Ca2+-activated K+ channels in coronary artery smooth muscle cells. Pflugers Arch 446 523-528. [DOI] [PubMed] [Google Scholar]
- Prakriya M and Lingle CJ (2000) Activation of BK channels in rat chromaffin cells requires summation of Ca2+ influx from multiple Ca2+ channels. J Neurophysiol 84 1123-1135. [DOI] [PubMed] [Google Scholar]
- Reiser J, Polu KR, Möller CC, Kenlan P, Altintas MM, Wei C, Faul C, Herbert S, Villegas I, Avila-Casado C, et al. (2005) TRPC6 is a glomerular slit diaphragm-associated channel required for normal renal function. Nat Genet 37 739-744. [DOI] [PMC free article] [PubMed] [Google Scholar]
- Rezzonico R, Cayatte C, Bourget-Ponzio I, Romey G, Belhacene N, Loubat A, Rocchi S, Van Obberghen E, Girault JA, Rossi B, et al. (2003) Focal adhesion kinase pp125FAK interacts with the large conductance calcium-activated hSlo potassium channel in human osteoblasts: potential role in mechanotransduction. J Bone Miner Res 18 1863-1871. [DOI] [PubMed] [Google Scholar]
- Saleem MA, O'Hare MJ, Reiser J, Coward RJ, Inward CD, Farren T, Xing CY, Ni L, Mathieson PW, and Mundel P (2002) A conditionally immortalized human podocyte cell line demonstrating nephrin and podocin expression. J Am Soc Nephrol 13 630-638. [DOI] [PubMed] [Google Scholar]
- Sausbier M, Zhou XB, Beier C, Sausbier U, Wolpers D, Maget S, Martin C, Dietrich A, Ressmeyer AR, Renz H, et al. (2007) Reduced rather than enhanced cholinergic airway constriction in mice with ablation of the large conductance Ca2+-activated K+ channel. FASEB J 21 812-822. [DOI] [PubMed] [Google Scholar]
- Shi J, Mori E, Mori Y, Mori M, Li J, Ito Y, and Inoue R (2004) Multiple regulation by calcium of murine homologues of transient receptor potential proteins TRPC6 and TRPC7 expressed in HEK293 cells. J Physiol 561 415-432. [DOI] [PMC free article] [PubMed] [Google Scholar]
- Spassova MA, Hewavitharana T, Xu W, Soboloff J, and Gill DL (2006) A common mechanism underlies stretch activation and receptor activation of TRPC6 channels. Proc Natl Acad Sci U S A 103 16586-16591. [DOI] [PMC free article] [PubMed] [Google Scholar]
- Stern MD (1992) Buffering of calcium in the vicinity of a channel pore. Cell Calcium 13 183-192. [DOI] [PubMed] [Google Scholar]
- Tang QY, Qi Z, Naruse K, and Sokabe M (2003) Characterization of a functionally expressed stretch-activated BKCa channel cloned from chick ventricular myocytes. J Membr Biol 196 185-200. [DOI] [PubMed] [Google Scholar]
- Teasdale RD and Jackson MR (1996) Signal-mediated sorting of membrane proteins between the endoplasmic reticulum and the Golgi apparatus. Annu Rev Cell Dev Biol 12 27-54. [DOI] [PubMed] [Google Scholar]
- Venkatachalam K and Montell C (2007) TRP Channels. Annu Rev Biochem 76 387-417. [DOI] [PMC free article] [PubMed] [Google Scholar]
- Wang B, Rothberg BS, and Brenner R (2006) Mechanism of β4 subunit modulation of BK channels. J Gen Physiol 127 449-465. [DOI] [PMC free article] [PubMed] [Google Scholar]
- White TA, Xue A, Chini EN, Thompson M, Sieck GC, and Wylam ME (2006) Role of transient receptor potential C3 in TNF-alpha-enhanced calcium influx in human airway myocytes. Am J Respir Cell Mol Biol 35 243-251. [DOI] [PMC free article] [PubMed] [Google Scholar]
- Winn MP, Conlon PJ, Lynn KL, Farrington MK, Creazzo T, Hawkins AF, Daskalakis N, Kwan SY, Ebersviller S, Burchette JL, et al. (2005) A mutation in the TRPC6 cation channel causes familial focal segmental glomerulosclerosis. Science 308 1801-1804. [DOI] [PubMed] [Google Scholar]
- Zou S, Jha S, Kim EY, and Dryer SE (2008) The β1 subunit of L-type voltage-gated Ca2+ channels independently binds to and inhibits the gating of large-conductance Ca2+-activated K+ channels. Mol Pharmacol 73 369-378. [DOI] [PubMed] [Google Scholar]


