Abstract
To acquire system-level understanding of the intercellular junctional complex, protein–protein interactions occurring at the junctions of simple epithelial cells have been examined by network analysis. Although proper hubs (i.e., very rare proteins with exceedingly high connectivity) were absent from the junctional network, the most connected (albeit nonhub) proteins displayed a significant association with essential genes and contributed to the “small world” properties of the network (as shown by in vivo and in silico deletion, respectively). In addition, compared with a random network, the junctional network had greater tendency to form modules and subnets of densely interconnected proteins. Module analysis highlighted general organizing principles of the junctional complex. In particular, two major modules (corresponding to the tight junctions and to the adherens junctions/desmosomes) were linked preferentially to two other modules that acted as structural and signaling platforms.
INTRODUCTION
Adhesion between adjacent epithelial cells is mediated by the intercellular junctional complex (JC), which comprises tight junctions (TJs) (Matter and Balda, 2007; Paris et al., 2008), adherens junctions (AJs) (Perez-Moreno et al., 2003; Bazzoni and Dejana, 2004; Hartsock and Nelson, 2008) and desmosomes (DEs) (Green and Simpson, 2007; Garrod and Chidgey, 2008). In the past decades, a wealth of studies have provided in-depth characterization of the high number of individual proteins and protein–protein interactions (PPIs) that form the JC network and that mediate cell–cell adhesion. Currently, however, the availability of such a broad set of experimental data, together with innovative approaches of network analysis (Barabasi and Oltvai, 2004), offers the opportunity to extract more general principles on the organization of the JC.
When displaying PPI data as networks, each protein is represented as a node of the network, whereas each direct interaction between two proteins is represented as an edge. A recent analysis of focal adhesions, which mediate cell attachment to the extracellular matrix (Zaidel-Bar et al., 2007), demonstrates the usefulness of applying systemic approaches to cell adhesion. In the present study, we have applied the principles and rules of network analysis to describe the PPI network of the JC in simple epithelial cells and to acquire system-level understanding of cell–cell adhesion.
MATERIALS AND METHODS
Construction and Analysis of the JC Network
Proteins and PPIs were included in the JC network via a three-step process, by searching both literature databases (PubMed; steps 1 and 2) and PPI databases (HPRD, STRING, and BioGrid; step 3). In particular, based on literature searches, step 1 aimed at identifying all the intrinsic proteins (and their mutual PPIs). To be defined as intrinsic, proteins must be 1) structural (i.e., membrane, cytoskeletal adaptor, adaptor, or cytoskeletal proteins), 2) localized to the junctions of simple epithelial cells, and 3) components of either triads or tetrads. Triads (tetrads) are linear 3-node (4-node) motifs sequentially composed of a membrane (an adaptor), a cytoskeletal adaptor, and a cytoskeletal protein. In addition, some junctional proteins were not included in the JC network, based on three considerations. First, some proteins (e.g., desmoglein-1) are only expressed in stratified (but not simple) epithelial cells. Second, other proteins (e.g., N-cadherin) are expressed in simple epithelia but under atypical conditions, such as epithelial-to-mesenchymal transition. Third, when more homologues (e.g., claudins [CLD] 1, 4, and 8) are expressed in simple epithelia, only one representative (i.e., CLD1) was included.
Still, based on literature searches, step 2 aimed at identifying the accessory proteins that interact directly with the intrinsic components in a junctional context. In addition, based on database searches, step 3 aimed at identifying accessory proteins and PPI that might have escaped detection in steps 1 and 2. Specifically, in step 3a, additional accessory nodes were identified that interact with the intrinsic nodes. In step 3b, however, most of these newly identified nodes were excluded (e.g., nonjunctional and/or nonepithelial proteins or isoforms of existing proteins). Finally, in step 3c, by searching databases, all the interaccessory PPI (i.e., interactions occurring among the accessory nodes) were identified. All the proteins and PPI included in the network are listed in Supplemental Tables S1 and S2, respectively. The excluded proteins and PPI are listed in Supplemental Table S3.
Proteins were sorted into junction types as follows. First, intrinsic membrane proteins were assigned to a given type (i.e., TJ, AJ, or DE), based on evidence in the literature. Then, intrinsic proteins that are first neighbors (i.e., direct interactors) of these membrane proteins were assigned to either a simple type (TJ, AJ, or DE) or mixed type (TJ/AJ, AJ/DE, or TJ/AJ/DE), depending on whether they interact with a homogeneous or heterogeneous class of membrane proteins, respectively. For example, PKP2 has been assigned to the DE, because it interacts with membrane proteins of the DEs (DSG2 and DSC2). In contrast, JUP has been assigned to the AJ/DE type, because it interacts with membrane proteins of both AJs (CDH1) and DEs (DSG2 and DSC2). Then, the same rule was applied to all the other intrinsic proteins (that are not directly linked to the membrane proteins) and finally to the accessory proteins, which are all first neighbors of the intrinsic proteins.
Networks and subnets were visualized using Cytoscape 2.4.1 (Shannon et al., 2003) and yEd Graph. Modularity was analyzed as described previously (Rives and Galitski, 2003), by subjecting an adjacency matrix of all-pairs shortest path distances to average linkage hierarchical clustering (Eisen et al., 1998) with uncentered correlation as the similarity metric, using Cluster 3.0 (de Hoon et al., 2004) and Java Tree View 1.0.13 (Saldanha, 2004).
Network Fragmentation
Network fragmentation was performed as described previously (Albert et al., 2000). Briefly, nodes were removed sequentially either in decreasing order of connectivity k (targeted attack) or randomly (nontargeted attack). Then, at each step t, the number n of nodes remaining in the fragment was counted. The size of the largest fragment S was expressed as the ratio between n(t) and the initial number of nodes n(t0). In parallel, the parameter l was measured as the average length of the shortest paths between any two nodes in the network. Finally, S and l were plotted as function of the fraction f of removed nodes.
Connectivity and Essentiality
The mouse orthologues of the human JC genes and the phenotypic effects of in vivo deletion in mouse (from targeted knockout, targeted reporter and targeted floxed/Frt experiments) were obtained from the Mouse Genome Informatics database (ftp://ftp.informatics.jax.org/pub/reports/index.html#pheno). The significance of the positive trend between k and essentiality was analyzed as described previously (Goh et al., 2007). Briefly, the slope A was calculated as the line coefficient in the linear regression model. Then, the associations between genes and lethality annotations were randomized, by keeping the same number of genes for each value of k. Subsequently, linear regression was carried out to obtain N randomized values of AR (AR1, AR2 … ARN). Finally, the P value of the observed AObs (i.e., the probability that the random trend AR is equal to or larger than the observed trend AObs purely by chance) was calculated using the Z-score. Because AR approximately follows a Gaussian distribution with zero mean and SD sA, Z was calculated as (AObs − <AR>)/sA = AObs/sA.
RESULTS
Generation of the JC Network
To assemble the JC network, we first identified 132 proteins. Each protein has been designated with the name of the corresponding gene and annotated with a functional category and a junction type (Supplemental Table S1). As to the functional category, the network comprises 40 intrinsic components that reside at the JC (12 membrane, 17 cytoskeletal adaptor, 8 adaptor, and 3 cytoskeletal proteins), as well as 92 accessory components that interact with the intrinsic components. In turn, the accessory components comprise 39 structural (8 membrane, 7 cytoskeletal adaptor, and 24 adaptor) and 48 signaling proteins (21 kinases, 13 phosphatases, 11 small G proteins, and 3 ubiquitin ligases), as well as five proteases. Thus, the intrinsic components correspond to the structural core of the JC, whereas the accessory components comprise signaling molecules that (together with some associated proteins) act as the regulatory periphery of the JC. As to the junction type, 63 proteins have been assigned to one of the three organelles of the JC (27, 25, and 11 proteins to the TJ, AJ, and DE, respectively). The remaining 69 proteins have been assigned to mixed categories (53, 9 and 7 proteins to the TJ/AJ, AJ/DE, and TJ/AJ/DE categories, respectively), as described in Materials and Methods.
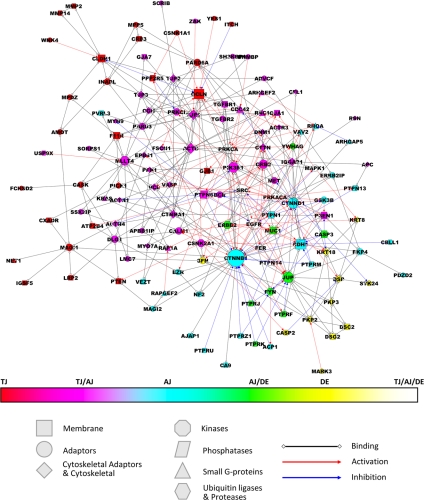
Proteins in the JC network are connected by 384 PPI (Supplemental Table S2), which have been divided into 233 nondirectional (i.e., binding) and 151 directional interactions. In turn, according to the biochemical (rather than the biological) effect, the directional PPIs have been subdivided into 106 activating (phosphorylation, guanine nucleotide exchange factor [GEF] activity, and G protein stimulation) and 45 inhibitory (dephosphorylation, GTPase-activating protein [GAP activity], ubiquitination, and proteolysis) interactions (Figure 1).
Figure 1.
The JC network. The JC has been visualized as a network. Each node, which corresponds to a protein, has a specific size (proportional to the connectivity), shape (functional category) and color (type of junction). Each edge, which corresponds to a PPI, is color-coded according to the type of interaction.
Topology of the JC Network
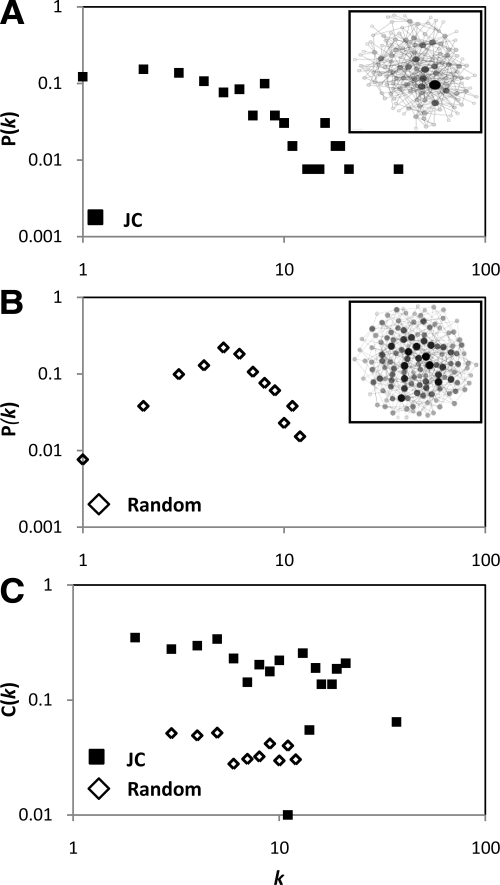
The JC was visualized as a network of N nodes (132 proteins) and E edges (384 PPIs) with average connectivity (<k> = 2E/N) of 5.82 edges per node. For comparison, we generated a random network with the same <k>, by uniformly distributing 384 edges among 132 nodes. In many biological networks, the degree distribution P(k), which is the probability that a protein has exactly k interactions, decays gradually as a power law over several orders of magnitude (Barabasi and Albert, 1999). In these “scale-free” networks, very rare hubs have exceedingly large numbers of interactions, whereas all the other nodes have just few interactions. In contrast, when plotting P(k) as a function of k, we observed that the connectivity, in both JC (Figure 2A) and random (Figure 2B) network, followed a rapidly declining exponential (rather than power law) distribution. Specifically, the P(k)JC curve was fitted by the following exponential function: P(k)JC = P0 e−Ak, where P0 = 0.18, A = 0.15, and R2 = 0.86). As the probability of finding nodes with very high k is practically prohibited in exponential networks, it follows that proper hub proteins are absent from the JC network.
Figure 2.
Topology of the JC network. Distribution of connectivity P(k) in the JC (A; closed squares) and random (B; open diamonds) network. The two networks are displayed in the insets. (C) Distribution of the clustering coefficient C(k).
In addition to the connectivity, another topological feature of several cellular networks, such as protein interaction (Wagner, 2001) and metabolic (Ravasz et al., 2002) networks, is their organization into densely connected clusters of nodes. A parameter that quantifies the tendency of each node to form clusters is the clustering coefficient C. Specifically, if node a is directly connected to nodes b and c, then Ca is the probability that b and c are also directly connected to each other. We found that the average clustering coefficient <C>, which characterizes the overall tendency of nodes to form clusters of nodes, was approximately sixfold greater in the JC (0.225) than in the random (0.039) network (Figure 2C). Interestingly, concerning the <C>, the JC network is comparable with other biological networks, including the PPI network of the focal adhesions (0.24) (Zaidel-Bar et al., 2007) and the neural network of the nematode Caenorhabditis elegans (0.28) (Watts and Strogatz, 1998). The organization of the JC network into clusters of nodes has consequences that will be discussed below.
Connectivity and Network Cohesion
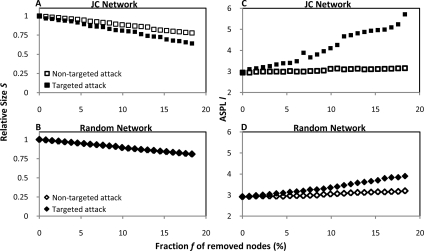
Although proper hubs (i.e., nodes with k ≫ <k>) are absent from the JC network, the exponential tail of P(k)JC indicates the presence of highly connected nodes with k > <k>. For example, three adaptors (CTNNB1, JUP, and CTNND1), one cytoskeletal protein (ACTB), and two kinases (SRC and EGFR) have k values that are at least 2 SD greater than the <k>, which raises the question of their topological role. In scale-free networks, hubs ensure physical cohesion and internal communication, because their removal causes network fragmentation and increase in the average length of the shortest paths, respectively (Albert et al., 2000). Here, we tested whether the highly connected proteins might play in the JC network comparable roles as the hubs in scale-free networks. To this purpose, we performed targeted attack of the JC network, by sequentially removing proteins in decreasing order of k. As a control, we performed nontargeted attack of the JC network, by removing the same number of nodes regardless of k. In parallel, targeted and nontargeted attack were also performed on the random network. We found that, in the JC network, fragmentation became progressively more obvious under targeted (compared with nontargeted) attack (Figure 3A). In addition, under targeted attack, fragmentation was more pronounced in the JC network (Figure 3A) compared with the random network (Figure 3B). For example, removal of ∼18% of nodes reduced the size S of the largest cluster by 34% (JC network, targeted attack), 22% (JC network, nontargeted attack), 19% (random network, targeted attack), and 19% (random network, nontargeted attack).
Figure 3.
Connectivity and network cohesion. To quantify fragmentation (A and B) and expansion (C and D) of the JC (A and C) and random (B and D) networks under targeted (solid) or nontargeted (open) attack, the relative size S and the average shortest length l of the largest cluster are expressed as function of the fraction f of removed nodes (if f = 0, then S = 1).
Similarly, measurement of another topological parameter, i.e., the average length of the shortest paths connecting any two nodes in the network (l), indicated that the JC network (Figure 3C) was more susceptible to targeted attack than the random network (Figure 3D). For example, removal of ∼18% of nodes increased l by 94% (JC network, targeted attack), 8% (JC network, nontargeted attack), 32% (random network, targeted attack), and 10% (random network, nontargeted attack). Thus, measuring S and l indicates that nodes with high k did contribute to the physical cohesion and to the internal communication of the JC network, respectively.
Connectivity and Gene Essentiality
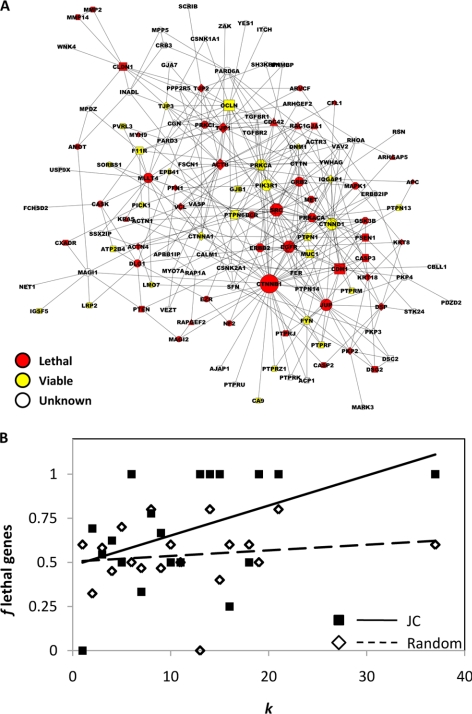
The highly connected JC proteins might play not only topologically but also biologically important roles. Because hub proteins in scale-free networks are encoded by essential genes (Jeong et al., 2001), we tested the correlation between connectivity and essentiality in the JC network. Specifically, we retrieved the phenotypic effects of knockout mutations affecting murine orthologues of the human JC genes (Supplemental Table S4). Deletion of 77 genes (out of 132 orthologues) was associated with known phenotypes. In particular, 55 deletions resulted in lethality (embryonic, perinatal or postnatal), 20 in viable (but variably abnormal) phenotypes, whereas two in an apparently normal phenotype. Then, we projected the phenotypic annotations onto the JC network (Figure 4A) and calculated the fraction f of lethal genes among all the murine genes, whose human orthologues have a given k (in the JC network). Interestingly, f showed a statistically significant tendency to increase with k (p = 0.03), indicating that the highly connected JC proteins did play essential roles (Figure 4B). It should be noted that the correlation between f and k (albeit statistically significant) is underestimated due to the presence of accessory proteins (e.g., APC and KRAS) that have high k values in the cell interactome but low k values (k ≤ 2) in the JC network.
Figure 4.
Connectivity and gene essentiality. (A) Nodes and edges of the human JC network are coded as in Figure 1, except that the color of each node highlights the phenotypic effect of deleting the corresponding ortholog in mouse. The scatter plot in B correlates either the fraction f of lethal genes (closed squares) or the average f of lethal randomized genes (open diamonds) with the connectivity k in the JC network. Lines represent linear regression of the JC network (solid line) and the randomized genes (dotted line).
Subdivision of the JC Network into Functional Families
The observation that the <C> is higher in the JC than in the random network suggests that the JC network is organized into modules, i.e., into clusters of nodes. As the definition of modularity is rather broad (Hartwell et al., 1999), we have examined modularity from different perspectives, starting from functionally centered views (Figures 5–7) and ending with topologically centered views (Figures 8–10).
Figure 5.
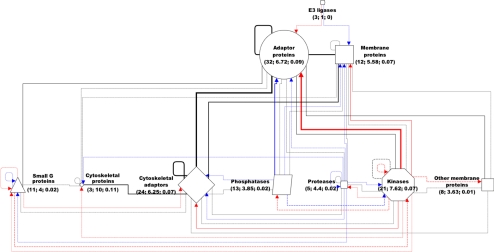
Functional families within the JC network. In this function-centered view of the JC network, nodes of different shape represent functional families, whereas edges represent interfamily interactions. The size of each node is proportional to the number N of the family members. Also, the color of each edge represents the type of interaction, whereas the thickness is proportional to the total number of interactions (E). For dotted lines E < 5, whereas for dashed lines 5 ≤ E ≤ 10. Node labels report total number N, average connectivity <k> and average <BC> of the family members.
Figure 6.
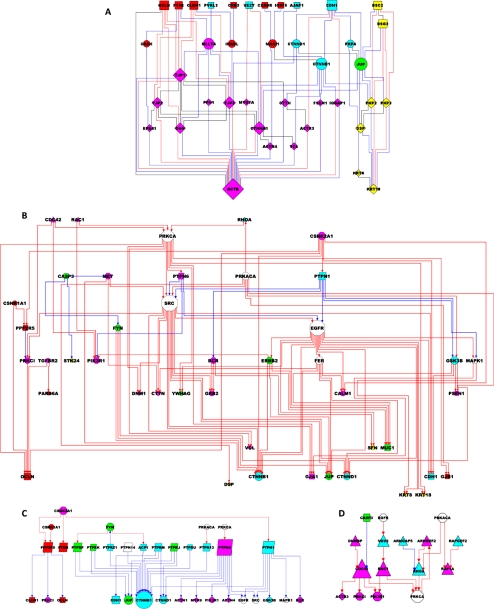
Functional subnets within the JC network. In the structural subnet (A), which is composed of intrinsic proteins, red and blue lines indicate triadic and tetradic motifs, respectively. In the kinase (B), phosphatase (C) and small G protein (D) subnets, proteins sharing a functional annotation (together with their first neighbors) are shown as functional subnets. The hierarchical layout allows distinguishing the relevant proteins (e.g., kinases; middle rows) from the upstream regulators (top rows) and downstream targets (bottom rows). In B–D, in which only the directional interactions are shown, red and blue lines indicate activation and inhibition, respectively. Nodes with k = 1 in the JC network have been omitted from B.
Figure 7.
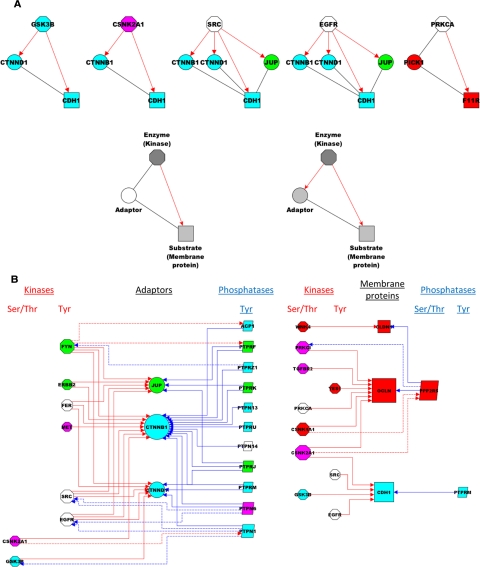
Subnet analyses of the phosphorylation reactions. Results in A indicate that most membrane-associated adaptors are targets of the junctional kinases that phosphorylate the associated membrane proteins. Top, all the three-components motifs of the JC network (made up of a kinase, an adaptor, and a membrane protein) are shown. Bottom, the two models show the possible roles of the adaptors, as either bystanders of the kinase-membrane protein reaction (left) or targets of the kinase (right). Results in B show phosphorylation interactions centered on adaptors (left) and membrane proteins (right), and they indicate that mutual interactions (dotted lines) occur between some of the kinases and phosphatases that target the same substrate.
Figure 8.
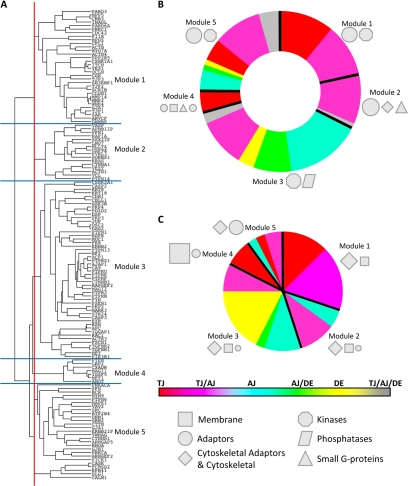
Topological modules within the JC network. The dendrogram in A shows the subdivision of the JC network into five modules. The charts represent the composition of accessory periphery (B) and structural core (C) of each module with respect to the junction type (the width of the slices being proportional to the number of nodes). Nodes of different shapes (light gray) and sizes represent functional categories.
Figure 9.
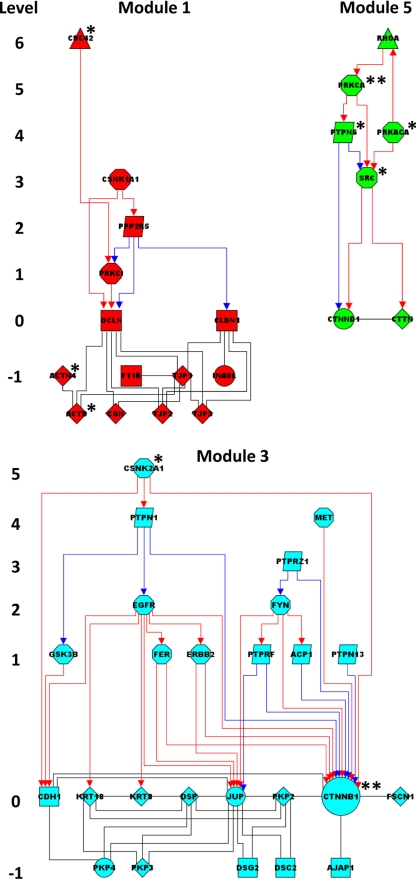
Regulatory intramodule hierarchies. Directional interactions (red, activation; blue, inhibition) converging on structural nodes (level 0) are displayed hierarchically. Nodes in level −1 are structural first neighbors of nodes in level 0. Connectors are also highlighted (*, high-P/low-z connectors; **, high-P/high-z connectors).
Figure 10.
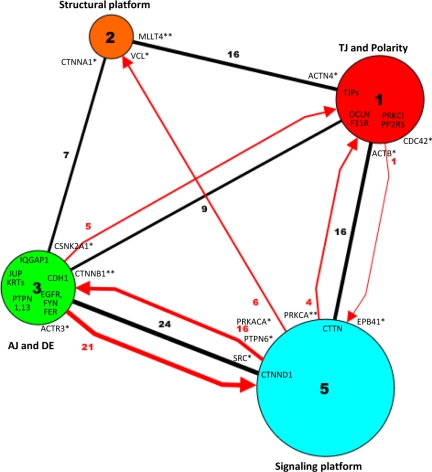
Intermodule interactions. Proteins in the four major modules have been merged into four nodes of different size (proportional to the number of proteins). The intermodule interactions are represented as edges of different color (black, binding; red, activation or inhibition) and thickness (interaction number; also reported in the edge label). Protein labels highlight some of the nodes that mediate intermodule interactions, as described in the text (*, high-P/low-z connectors; **, high-P/high z connectors).
As mentioned, each JC protein was assigned to one (out of 10) functional family. Grouping proteins into families resulted in a simplified and function-centered view of the network (Figure 5). Each family was characterized by total number (N), average connectivity (<k>), and average betweenness centrality (<BC>) of its proteins. BC measures the fraction of the shortest paths that pass through a given node (Girvan and Newman, 2002). As expected, we found that the most frequent interactions occurred between the most numerous families (e.g., between adaptors and cytoskeletal adaptors or between adaptors and kinases). The topological centrality of the adaptors reflects their functional centrality in the outside-in translation of adhesive events into postadhesive events, such as cytoskeletal rearrangements and protein phosphorylation. However, the frequency of the interactions was not merely accounted for by the N of the interacting families. For example, cytoskeletal proteins were the most connected (<k>cytoskeleton = 10.0 vs. <k>all = 5.3) and most central (<BC>cytoskeleton = 0.11 vs. <BC>all = 0.05) family, even though they were one of the least numerous families (Ncytoskeleton = 3 vs. <N>all = 13.1), implying that certain interactions occurred preferentially in the network.
Dissection of the JC Network into Functional Subnets
To analyze functional modularity in further detail, groups of functionally defined proteins (subnets) were extracted from the JC network and used to construct four (1 structural and 3 regulatory) subnets. Focusing on a group of proteins that share a functional annotation (e.g., kinase) and on their first neighbors, helps understand how each subnet is intrinsically organized and integrated within the network. Some examples of proteins and PPIs are given in parentheses throughout the text.
The structural subnet, which comprises the 40 intrinsic proteins linked by 95 PPIs, corresponds to the structural core of the JC (Figure 6A). Membrane proteins of the TJs (e.g., OCLN, CLND1, and F11R) and AJs (CDH1 and VEZT) are linked indirectly to actin (ACTB)-based microfilaments via adaptors (CTNNB1 and MLLT4) and/or cytoskeletal adaptors (CTNNA1 and TJP1). Similarly, membrane proteins of the DEs (DSC2 and DSG2) are linked indirectly to keratin (KRT8 and KRT18)-based intermediate filaments via adaptors (JUP) and/or cytoskeletal adaptors (PKP2 and -3). More in general, there are multiple dyadic interactions that involve the four categories of structural proteins (i.e., 16 membrane-cytoskeletal adaptor, 14 membrane-adaptor, 20 adaptor-cytoskeletal adaptor, 25 cytoskeletal adaptor-cytoskeletal, 1 membrane-membrane, 3 adaptor-adaptor, 14 cytoskeletal adaptor-cytoskeletal adaptor, 1 cytoskeletal-cytoskeletal, and 1 membrane-cytoskeletal protein interactions). Of these dyads, 20 PPIs participate in triadic membrane-cytoskeletal adaptor-cytoskeletal protein motifs (red lines in Figure 6A, e.g., DSC2-PKP2-KRT18). Additional 49 PPIs participate in tetradic membrane-adaptor-cytoskeletal adaptor-cytoskeletal protein motifs (blue lines, e.g., DSC2-JUP-DSP-KRT18). The remaining 26 PPIs (black lines) connect the triadic and tetradic motifs, by mutually linking membrane (e.g., DSC2-DSG2), adaptor (PKP4-JUP), cytoskeletal adaptor (PKP2-PKP3), and cytoskeletal (KRT18-KRT8) proteins.
The kinase subnet (75 proteins linked by 160 PPI) comprises 21 kinases (13 Ser/Thr, 7 Tyr, and 1 lipid kinase), as well as 54 other proteins, which act as upstream regulators, downstream substrates or binding partners of the kinases (Figure 6B). Kinase regulators include small G proteins (CDC42, RAC1, and RHOA), other kinases (PRKCA and CSNK2A1), Tyr phosphatases (PTPN6 and -1), and proteases (CASP3). Kinase substrates include mostly structural proteins, such as membrane (OCLN and CDH1), adaptor (CTNNB1, CTNND1, and JUP), cytoskeletal adaptor (VCL and DSP), and cytoskeletal (KRT8 and 18) proteins. Both Ser/Thr and Tyr kinases phosphorylate the structural proteins, even though Ser/Thr kinases (CSNK2A1 and PRKCA) are almost exclusively responsible for phosphorylating membrane proteins of the TJs (OCLN, F11R, and CLDN1). There is also evidence for regulator-target hierarchies among kinases. For example, some Ser/Thr kinases (PRKCA, CSNK2A1, and PRKACA) regulate the Tyr kinase SRC (either directly or indirectly via the Tyr phosphatases PTPN1 and -6). In turn, SRC lies upstream of several other Tyr kinases (EGFR, ERBB2, and FER), which together regulate structural proteins.
Subnet analysis allowed us to examine whether membrane-associated adaptors are targets of the same kinases that phosphorylate the associated membrane proteins. To this purpose, we searched all the three-component motifs (Milo et al., 2002) composed of a kinase, a membrane protein, and an adaptor (Figure 7A). We found that almost all the kinases (e.g., GSK3B) phosphorylate not only the target membrane protein (e.g., CDH1) but also the associated adaptor (e.g., CTNND1). Similar findings were obtained with other kinases (CSNK2A1, SRC, and EGFR), with the only exception of PRKCA, which phosphorylates F11R but not the adaptor PICK1. Thus, most membrane-associated adaptors are themselves substrates of the kinases. The observation is in keeping with the notions that the adaptors are structural components of the JC and that adaptor-targeting kinases either destabilize (Tyr kinases) or stabilize (Ser/Thr kinases) junctions (Nelson and Nusse, 2004).
The phosphatase subnet (40 proteins linked by 50 PPI) comprises 13 phosphatases and 27 associated proteins (Figure 6C). Specifically, there are six receptor (PTPRF, -J, -K, -M, -U, and -Z1) and five nonreceptor (PTPN1, -6, -13, -14, and ACP1) Tyr phosphatases, as well as one Ser/Thr (PPP2R5) and 1 protein-lipid (PTEN) phosphatase. Phosphatase regulators include kinases (but neither small G proteins nor other phosphatases), whereas targets include membrane, adaptors, cytoskeletal adaptors, and kinases (but neither cytoskeletal nor small G proteins). Notably, there are three major clusters within the subnet. First, the Ser/Thr phosphatase PPP2R5 (which is regulated by the Ser/Thr kinases CSNK2A1 and CSNK1A1) targets membrane proteins of the TJ (CLDN1 and OCLN) and a polarity-associated kinase (PRKCI). Second, receptor-type Tyr phosphatases dephosphorylate membrane (CDH1) and adaptor (CTNNB1, CTNND1, and JUP) proteins of the AJs and DEs. Third, the nonreceptor Tyr phosphatases PTPN1 and PTPN6 regulate a set of kinases and contribute to the regulation of the AJ adaptors CTNNB1 and CTNND1.
Subnet analysis also allowed us to examine whether kinases and phosphatases interact with each other in regulating the phosphorylation state of their structural targets (Figure 7B). First, regulation of some DE and AJ adaptors (JUP, CTNNB1, and CTNND1) mostly involves Tyr kinases and Tyr phosphatases, with some evidence of kinase–phosphatase interaction. For example, the Tyr kinase FYN phosphorylates not only JUP but also two Tyr phosphatases that target JUP (ACP1 and PTPRF). Conversely, the Tyr phosphatases PTNPN6 and PTPN1 dephosphorylate not only CTNND1 but also two Tyr kinases (SRC and EGFR) that phosphorylate CTNND1. Similarly, regulation of some membrane proteins of the TJ (CLDN1 and OCLN) and AJ (CDH1) mostly involves Ser/Thr kinases, with some examples of mutual kinase-phosphatase (CSNK1A1/PPP2R5 and CSNK2A1/PPP2R5) and phosphatase-kinase (PPP2R5/PRKCI) interactions centered on OCLN. Thus, the phosphorylation state of adaptor and membrane proteins likely depends on both the overall balance and the mutual interactions between kinases and phosphatases.
Finally, the small G protein subnet (31 proteins linked by 41 PPI) comprises six small G proteins (CDC42, RAC1, RHOA, RAP1A, KRAS, and NET1), four GEF (DNMB, VAV2, ARHGEF2, and RAPGEF2), one GAP (ARHGAP5), and 20 associated proteins (Figure 6D). Besides the GEF and GAP, regulators include kinases (EGFR and PRKACA), whereas targets include cytoskeletal proteins (ACTR3) and kinases (PRKCI and PRKCA).
Topological Modules within the JC Network
After the functional subnets, we analyzed the topological modules. Defining how the JC network is subdivided into modules may help understand how the JC is structurally organized. In addition, defining the interactions between some accessory (i.e., regulatory) and intrinsic (i.e., structural) nodes of each module, as well as the interactions between modules, may help understand how the JC is functionally regulated. To identify modules, we measured the shortest paths between all pairs of nodes and then performed hierarchical clustering of the paths (Rives and Galitski, 2003). The assumption here was that the shortest path between any two proteins is likely the most important path for their functional association. Therefore, hierarchical clustering allowed us to identify groups of proteins with similar (i.e., clustered) shortest path profiles and to assign these proteins to the same module.
Thus, we first subdivided (by hierarchical clustering) the JC network into modules (Figure 8A) and then represented schematically the composition of the accessory periphery (Figure 8B) and the intrinsic core (Figure 8C) of each module in terms of junction types and functional categories. Then, we reconstructed hierarchical regulatory interactions within the major modules (Figure 9). Finally, we analyzed (aided by functional cartography) the intermodule interactions and represented the JC as a simplified network of four collapsed and interlinked modules (Figure 10).
In general, our analysis highlights that the JC network can be subdivided into four major modules (hereafter labeled 1, 2, 3, and 5) and the small module 4. In particular, two modules correspond mostly to the TJ/polarity (module 1) and the AJ/DE (module 3) complexes, whereas two other modules are connecting platforms. Specifically, module 2 is a structural platform that connects nodes of the TJ (module 1) and AJ (module 3) with the actin cytoskeleton. In addition, module 5 is a signaling platform that integrates regulatory interactions between the global interactome of the cell and either module 1 or 3.
Description of the Topological Modules and Their Internal Organization
Module 1 comprises structural components of the TJ (OCLN, CLDN1, F11R, TJPs, and CGN) and the actin cytoskeleton (ACTN4 and ACTB), as well as members of the polarity system (PARD6A and PARD3). In addition, within module 1, accessory nodes of the regulatory periphery (the Ser/Thr kinases PRKCI and CSNK1A1, as well as the Ser/Thr phosphatase PPP2R5) directly control structural core components of the TJ (OCLN). Other hierarchical regulatory interactions comprise the CDC42-dependent activation of PRKCI, as well as mutual interactions between kinases and phosphatases (CSNK1A1/PPP2R5, and PPP2R5/PRKCI). In addition, few other TJ proteins (CXADR and MAGI1) cluster into the small module 4.
Module 3 comprises key structural components of both AJs (CDH1 and CTNNB1) and DEs (DSC2, DSG2, JUP, DSP, PKPs, and KRTs). Module 3 comprises two internal sets of hierarchical regulatory interactions, both of which mostly involve Tyr phosphorylation. The former, which is centered on EGFR (with the Ser/Thr kinase CSNK2A1 and the Tyr phosphatase PTPN1 upstream, as well as the Tyr kinases ERBB2 and FER downstream), regulates AJ (CDH1) and DE (JUP, KRT8, and KRT18) proteins. The latter, which is centered on FYN (with the Tyr phosphatases PTPRZ1 upstream and PTPRF, PTPN13 and ACP1 downstream), regulates CTTNB1.
Module 2 comprises important structural nodes, such as adaptors (MLLT4) and actin-associated cytoskeletal adaptors (CTNNA1 and VCL), but few regulatory nodes and regulatory interactions. As detailed below, the structural nodes in module 2 interact with many structural nodes in modules 1 and 3, thus stressing further that module 2 mostly acts as a platform for structural (rather than regulatory) intermodule connections.
Module 5 is a signaling platform that integrates regulatory interactions of the diverse junctions. Interestingly, several nodes belong to the mixed TJ/AJ and TJ/AJ/DE junction types. In addition, module 5 comprises several accessory nodes that play regulatory roles not only internally (i.e., within module 5) but also externally (i.e., between module 5 and either module 1 or module 3). The regulators comprise the small G protein RHOA, the Ser/Thr kinases PRKCA and PRKACA, the Tyr kinase SRC, and the Tyr phosphatase PTPN6. Hierarchical regulatory interactions internal to module 5 are centered on the axis RHOA/PRKCA/PTPN6/SRC. In turn, SRC activates directly CTTN and the adaptor CTNND1.
Interactions among the Modules: A General Overview of the Epithelial JC
As shown in Figure 10, numerous intermodule interactions occur between either the TJ-based module 1 or the AJ/DE-based module 3 on one side, and either the structural module 2 or the signaling module 5 on the other side.
Concerning the structural platform (module 2), structural nodes of module 2 bind structural nodes in module 1 (MLLT4/TJP1, MLLT4/TJP3, MLLT4/F11R, VCL/ACTB, CTTNA1/TJP1, and CTNNA1/ACTN4) and module 3 (CTNNA1/CTNNB1, CTNNA1/JUP, and VCL/CTNNB1).
Interestingly, the signaling platform (module 5) uses similar patterns of connectivity to interact with either module 1 or module 3, because in both cases module 5 exchanges both nondirectional (binding) and directional (activation and/or inhibition) interactions with the two modules. Specifically, to connect to module 1, structural nodes of module 5 bind structural nodes in module 1 (CTTN/ACTB, CTTN/TJP1, EPB41/ACTB, and CTNND1/TJP3). In addition, accessory nodes of module 5 control nodes in module 1 (PRKCA/OCLN, PRKCA/F11R, and SRC/PRKCI), whereas in turn an accessory node of module 1 controls a node in module 5 (CDC42/PRKCA).
Similarly, to connect to module 3, structural nodes in module 5 bind structural nodes in module 3 (CTNND1/CDH1 and CTNND1/JUP). In addition, accessory nodes of module 5 control nodes in module 3 (SRC/EGFR, SRC/CDH1, SRC/CTNNB1, SRC/JUP, PTPN6/CTNNB1, PTPN6/EGFR, and PRKACA/PTPN13), whereas accessory nodes of module 3 in turn control nodes in module 5 (PTPN1/SRC, EGFR/CTNND1, FYN/CTNND1, and FER/CTNND1).
Finally, it should be noted for completeness, that accessory nodes in module 5 also regulate module 2 (SRC/VCL and PRKCA/VCL) and that accessory nodes in module 3 also regulate nodes in module 1 (CSNK2A1/OCLN and CSNK2A1/PP2R5).
Analysis of the intermodule interactions has been complemented by evaluation of the cartographic role of each protein in intermodule connection, as described previously (Guimera and Nunes Amaral, 2005). Briefly, nodes that are well connected with other nodes in the same module have a high within-module degree z, whereas nodes that connect preferentially to nodes in modules other than their own have a high participation coefficient P (and are defined as connectors). Remarkably, most of the high-P (and high-z) connectors (CTNNB1, PRKCA, and MLLT4) or high-P (and low-z) connectors (CSNK2A1, ACTB, ACTN4, ACTR3, EPB41, CTNNA1, VCL, CDC42, PTPN6, PRKACA, and SRC) are proteins that provide important links between modules. Thus, functional cartography and hierarchical clustering contribute together to defining the molecular basis for intermodule connection.
DISCUSSION
Network analysis provided a comprehensive view of the molecular architecture of the JC (Figure 1) and indicated that the topology of the JC network is characterized by an exponential (and, thus, hub-less) distribution of connectivity (Figure 2). Nonetheless, the same analysis also showed that the highly connected (albeit nonhub) proteins play key roles, as demonstrated by the correlation of connectivity with network vulnerability (Figure 3) and with gene essentiality (Figure 4). In addition, dissection of the network into functional families (Figure 5) and subnets (Figure 6) provided insight that would have been more difficult to acquire by conventional (i.e., molecule-centered) than by systemic (i.e., network-centered) approaches. The interplay between JC-associated kinases and phosphatases (Figure 7) is an example of these insights. Finally, dissection of the network into topological modules (Figure 8) identified regulatory hierarchies between accessory periphery and structural core of each module (Figure 9), as well as key connections between modules (Figure 10).
Previous studies in the biological, social, and information sciences have analyzed the large-scale topology of complex systems, including global networks of protein interactions, metabolic reactions and gene coexpression. These studies reported that rare hubs hold together all the other nodes, thus identifying the power law distribution of connectivity as a common feature of different global networks (Barabasi and Albert, 1999). However, many cell functions depend on important fractions of the global networks that are restricted either locally (to cell components) or functionally (to biological processes). Thus, it is important to define whether the interactions between proteins retain the same topological features across many levels of resolution from the whole (the global network) down to the parts (the local and/or functional networks). The present study contributes to this general issue, because it analyzes a fraction of the PPI network that is restricted both locally (to the apical junction complex) and functionally (to cell–cell adhesion). The herein reported finding of an exponential distribution of connectivity is not unprecedented. For example, an exponential distribution characterized both the network of essential proteins in the yeast interactome (Pereira-Leal et al., 2005) and the process-specific subnetworks of a power-law network (Rachlin et al., 2006).
Furthermore, similarly to the cell–cell adhesion network of the epithelial JC, another adhesion system, namely, the cell–matrix adhesion network of the integrin adhesome, has been recently described in terms of network analysis (Zaidel-Bar et al., 2007). Interestingly, the <k> is ∼1.5-fold higher in the cell–matrix network than in the cell–cell network (8.66 vs. 5.82, respectively), which probably reflects differences in the methodology used for generating the networks (our analysis, for example, was restricted to one cell type). Nevertheless, the cell–cell and cell–matrix systems display topological similarities, such as an exponential distribution of connectivity, as well as comparable <C> and <l> values (0.24 vs. 0.23 and 2.59 vs. 2.95). In addition, similar organizing principles can be applied to both types of networks, such as the topologically central role of the adaptors, the hierarchy of some interactions (e.g., the Ser/Thr kinases PRKCA and PRKACA controlling most Tyr kinases) and the greater frequency of activating (vs. inhibitory) interactions.
We also applied the methods of hierarchical clustering (Rives and Galitski, 2003) and functional cartography (Guimera and Nunes Amaral, 2005). With the former method, we found that, far from being randomly organized, the JC network is orderly subdivided into functional modules (Figure 8). With the latter method, which allows the identification of important nodes based on their ability to connect modules (and not merely on their intrinsic connectivity), we confirmed that several connector proteins play key roles in ensuring intermodule cohesion and thus linking different processes that are essential for JC establishment and regulation (Figure 10). In a broader perspective, we propose that combining the methods of network clustering and role attribution may be regarded to as a general approach for future studies of other biologically defined networks, which are associated with subcellular organelles and/or processes.
In addition to gaining functional insight, the herein reported analysis is potentially helpful for other purposes. First, because novel methods have been devised to compare biological networks of distantly related species (Sharan and Ideker, 2006), outlining human adhesive networks will contribute to defining the evolution of adhesion, as soon as the “adhesome” of model organisms, including Drosophila melanogaster (Hynes and Zhao, 2000), C. elegans (Cox and Hardin, 2004), and the echinoderm Strongylocentrotus purpuratus (Whittaker et al., 2006), is completed. Second, because protein networks allow defining the robustness of cells to disease-related perturbation (Ideker and Sharan, 2008), outlining the adhesive networks may also prove useful in identifying critical nodes that are targets for genetic mutations and for pharmacological therapy.
Supplementary Material
ACKNOWLEDGMENTS
Support from Association International for Cancer Research, UK (grant 04-095) and the Fondazione Musarra is gratefully acknowledged.
Abbreviations used:
- AJ
adherens junction
- BC
betweenness centrality
- C
clustering coefficient
- DE
desmosome
- k
degree of connectivity
- JC
junctional complex
- PPI
protein–protein interaction
- TJ
tight junction.
Footnotes
This article was published online ahead of print in MBC in Press (http://www.molbiolcell.org/cgi/doi/10.1091/mbc.E08-05-0477) on October 15, 2008.
REFERENCES
- Albert R., Jeong H., Barabasi A. L. Error and attack tolerance of complex networks. Nature. 2000;406:378–382. doi: 10.1038/35019019. [DOI] [PubMed] [Google Scholar]
- Barabasi A. L., Albert R. Emergence of scaling in random networks. Science. 1999;286:509–512. doi: 10.1126/science.286.5439.509. [DOI] [PubMed] [Google Scholar]
- Barabasi A. L., Oltvai Z. N. Network biology: understanding the cell's functional organization. Nat. Rev. Genet. 2004;5:101–113. doi: 10.1038/nrg1272. [DOI] [PubMed] [Google Scholar]
- Bazzoni G., Dejana E. Endothelial cell-to-cell junctions: molecular organization and role in vascular homeostasis. Physiol. Rev. 2004;84:869–901. doi: 10.1152/physrev.00035.2003. [DOI] [PubMed] [Google Scholar]
- Cox E. A., Hardin J. Sticky worms: adhesion complexes in C. elegans. J. Cell Sci. 2004;117:1885–1897. doi: 10.1242/jcs.01176. [DOI] [PubMed] [Google Scholar]
- de Hoon M. J., Imoto S., Nolan J., Miyano S. Open source clustering software. Bioinformatics. 2004;20:1453–1454. doi: 10.1093/bioinformatics/bth078. [DOI] [PubMed] [Google Scholar]
- Eisen M. B., Spellman P. T., Brown P. O., Botstein D. Cluster analysis and display of genome-wide expression patterns. Proc. Natl. Acad. Sci. USA. 1998;95:14863–14868. doi: 10.1073/pnas.95.25.14863. [DOI] [PMC free article] [PubMed] [Google Scholar]
- Garrod D., Chidgey M. Desmosome structure, composition and function. Biochim. Biophys. Acta. 2008;1778:572–587. doi: 10.1016/j.bbamem.2007.07.014. [DOI] [PubMed] [Google Scholar]
- Girvan M., Newman M. E. Community structure in social and biological networks. Proc. Natl. Acad. Sci. USA. 2002;99:7821–7826. doi: 10.1073/pnas.122653799. [DOI] [PMC free article] [PubMed] [Google Scholar]
- Goh K. I., Cusick M. E., Valle D., Childs B., Vidal M., Barabasi A. L. The human disease network. Proc. Natl. Acad. Sci. USA. 2007;104:8685–8690. doi: 10.1073/pnas.0701361104. [DOI] [PMC free article] [PubMed] [Google Scholar]
- Green K. J., Simpson C. L. Desmosomes: new perspectives on a classic. J. Invest. Dermatol. 2007;127:2499–2515. doi: 10.1038/sj.jid.5701015. [DOI] [PubMed] [Google Scholar]
- Guimera R., Nunes Amaral L. A. Functional cartography of complex metabolic networks. Nature. 2005;433:895–900. doi: 10.1038/nature03288. [DOI] [PMC free article] [PubMed] [Google Scholar]
- Hartsock A., Nelson W. J. Adherens and tight junctions: Structure, function and connections to the actin cytoskeleton. Biochim. Biophys. Acta. 2008;1778:660–669. doi: 10.1016/j.bbamem.2007.07.012. [DOI] [PMC free article] [PubMed] [Google Scholar]
- Hartwell L. H., Hopfield J. J., Leibler S., Murray A. W. From molecular to modular cell biology. Nature. 1999;402:C47–C52. doi: 10.1038/35011540. [DOI] [PubMed] [Google Scholar]
- Hynes R. O., Zhao Q. The evolution of cell adhesion. J. Cell Biol. 2000;150:F89–F96. doi: 10.1083/jcb.150.2.f89. [DOI] [PubMed] [Google Scholar]
- Ideker T., Sharan R. Protein networks in disease. Genome Res. 2008;18:644–652. doi: 10.1101/gr.071852.107. [DOI] [PMC free article] [PubMed] [Google Scholar]
- Jeong H., Mason S. P., Barabasi A. L., Oltvai Z. N. Lethality and centrality in protein networks. Nature. 2001;411:41–42. doi: 10.1038/35075138. [DOI] [PubMed] [Google Scholar]
- Matter K., Balda M. S. Epithelial tight junctions, gene expression and nucleo-junctional interplay. J. Cell Sci. 2007;120:1505–1511. doi: 10.1242/jcs.005975. [DOI] [PubMed] [Google Scholar]
- Milo R., Shen-Orr S., Itzkovitz S., Kashtan N., Chklovskii D., Alon U. Network motifs: simple building blocks of complex networks. Science. 2002;298:824–827. doi: 10.1126/science.298.5594.824. [DOI] [PubMed] [Google Scholar]
- Nelson W. J., Nusse R. Convergence of Wnt, beta-catenin, and cadherin pathways. Science. 2004;303:1483–1487. doi: 10.1126/science.1094291. [DOI] [PMC free article] [PubMed] [Google Scholar]
- Paris L., Tonutti L., Vannini C., Bazzoni G. Structural organization of the tight junctions. Biochim. Biophys. Acta. 2008;1778:646–659. doi: 10.1016/j.bbamem.2007.08.004. [DOI] [PubMed] [Google Scholar]
- Pereira-Leal J. B., Audit B., Peregrin-Alvarez J. M., Ouzounis C. A. An exponential core in the heart of the yeast protein interaction network. Mol. Biol. Evol. 2005;22:421–425. doi: 10.1093/molbev/msi024. [DOI] [PubMed] [Google Scholar]
- Perez-Moreno M., Jamora C., Fuchs E. Sticky business: orchestrating cellular signals at adherens junctions. Cell. 2003;112:535–548. doi: 10.1016/s0092-8674(03)00108-9. [DOI] [PubMed] [Google Scholar]
- Rachlin J., Cohen D. D., Cantor C., Kasif S. Biological context networks: a mosaic view of the interactome. Mol. Syst. Biol. 2006;2:66. doi: 10.1038/msb4100103. [DOI] [PMC free article] [PubMed] [Google Scholar]
- Ravasz E., Somera A. L., Mongru D. A., Oltvai Z. N., Barabasi A. L. Hierarchical organization of modularity in metabolic networks. Science. 2002;297:1551–1555. doi: 10.1126/science.1073374. [DOI] [PubMed] [Google Scholar]
- Rives A. W., Galitski T. Modular organization of cellular networks. Proc. Natl. Acad. Sci. USA. 2003;100:1128–1133. doi: 10.1073/pnas.0237338100. [DOI] [PMC free article] [PubMed] [Google Scholar]
- Saldanha A. J. Java Treeview–extensible visualization of microarray data. Bioinformatics. 2004;20:3246–3248. doi: 10.1093/bioinformatics/bth349. [DOI] [PubMed] [Google Scholar]
- Shannon P., Markiel A., Ozier O., Baliga N. S., Wang J. T., Ramage D., Amin N., Schwikowski B., Ideker T. Cytoscape: a software environment for integrated models of biomolecular interaction networks. Genome Res. 2003;13:2498–2504. doi: 10.1101/gr.1239303. [DOI] [PMC free article] [PubMed] [Google Scholar]
- Sharan R., Ideker T. Modeling cellular machinery through biological network comparison. Nat. Biotechnol. 2006;24:427–433. doi: 10.1038/nbt1196. [DOI] [PubMed] [Google Scholar]
- Wagner A. The yeast protein interaction network evolves rapidly and contains few redundant duplicate genes. Mol. Biol. Evol. 2001;18:1283–1292. doi: 10.1093/oxfordjournals.molbev.a003913. [DOI] [PubMed] [Google Scholar]
- Watts D. J., Strogatz S. H. Collective dynamics of ‘small-world’ networks. Nature. 1998;393:440–442. doi: 10.1038/30918. [DOI] [PubMed] [Google Scholar]
- Whittaker C. A., Bergeron K. F., Whittle J., Brandhorst B. P., Burke R. D., Hynes R. O. The echinoderm adhesome. Dev. Biol. 2006;300:252–266. doi: 10.1016/j.ydbio.2006.07.044. [DOI] [PMC free article] [PubMed] [Google Scholar]
- Zaidel-Bar R., Itzkovitz S., Ma'ayan A., Iyengar R., Geiger B. Functional atlas of the integrin adhesome. Nat. Cell Biol. 2007;9:858–867. doi: 10.1038/ncb0807-858. [DOI] [PMC free article] [PubMed] [Google Scholar]
Associated Data
This section collects any data citations, data availability statements, or supplementary materials included in this article.


