Abstract
Cardiac cells mature in the first postnatal week, concurrent with altered extracellular mechanical properties. To investigate the effects of extracellular stiffness on cardiomyocyte maturation, we plated neonatal rat ventricular myocytes for 7 days on collagen-coated polyacrylamide gels with varying elastic moduli. Cells on 10 kPa substrates developed aligned sarcomeres, whereas cells on stiffer substrates had unaligned sarcomeres and stress fibers, which are not observed in vivo. We found that cells generated greater mechanical force on gels with stiffness similar to the native myocardium, 10 kPa, than on stiffer or softer substrates. Cardiomyocytes on 10 kPa gels also had the largest calcium transients, sarcoplasmic calcium stores, and sarcoplasmic/endoplasmic reticular calcium ATPase2a expression, but no difference in contractile protein. We hypothesized that inhibition of stress fiber formation might allow myocyte maturation on stiffer substrates. Treatment of maturing cardiomyocytes with hydroxyfasudil, an inhibitor of RhoA kinase and stress fiber-formation, resulted in enhanced force generation on the stiffest gels. We conclude that extracellular stiffness near that of native myocardium significantly enhances neonatal rat ventricular myocytes maturation. Deviations from ideal stiffness result in lower expression of sarcoplasmic/endoplasmic reticular calcium ATPase, less stored calcium, smaller calcium transients, and lower force. On very stiff substrates, this adaptation seems to involve RhoA kinase.
INTRODUCTION
In the early postnatal period, cardiomyocytes undergo rapid growth and maturation that is essential for normal cardiac development. This postnatal growth is modulated by not only biochemical and paracrine, but also mechanical factors (1). An understanding of how mechanical factors influence cardiomyocyte maturation could aid in the development of cardiac cell therapies, especially because these usually assume stem cells will be injected or implanted in scarred tissue, which has significantly altered mechanical properties from healthy myocardium (2–5).
Recent in vitro studies have shown that alterations in the elastic modulus of the substrate affects proliferation rates of vascular smooth muscle cells (6), cell association and tissue formation (7), differentiation of myoblasts into striated myotubes (8,9), and differentiation of mesenchymal stem cells into myocytes and other cell types (10). These responses tend to approximate normal in vivo behavior more closely when the substrate stiffness is near that of the native extracellular matrix.
In the myocardium, tissue elasticity shows significant regional variation during heart disease (11–15). Specifically, Berry et al. (16) observed that ischemic areas of rat myocardium showed a large increase in elastic modulus, from a normal modulus of approximately 10–20 kPa to a modulus of ∼50 kPa. However, the effects of alterations to the extracellular elastic modulus on the phenotype of individual cardiac myocytes have not been investigated. In this study, we investigate this relationship using an in vitro model system of neonatal rat ventricular myocytes (NRVM) cultured on elastic polyacrylamide gels during maturation. Maturation of NRVMs in an in vitro culture for a week post-isolation is apparent from their morphology and the appearance of well-defined sarcomeres (17) as well as functional changes, hyperplasia (18), and binucleation (19).
Force and stress development in individual myocytes have generally been presented in terms of cell shortening and velocity (20), although some studies have used microdevices to measure single-axis force directly (21–23). Traction force microscopy can resolve forces at each point of contact between the cell and substrate (24,25) by tracking markers embedded in the substrate and calculating the force generated by the cell. This method has been used to examine tractions in migrating cells as a function of adhesive molecule type and surface concentration (26,27) and investigate forces produced by migrating myofibroblasts (28).
One important regulator of cell morphology in regions of contractile stress is the RhoA/RhoA-kinase (ROCK) pathway. Previous studies have found relationships between the RhoA/ROCK pathways and changes in cytoskeletal structure and contractility in diabetic mice (29). ROCK activation can be induced by mechanical stress and acts to prevent actin depolymerization (30). ROCK also inhibits myosin light chain phosphatase, resulting in increased phosphorylation of nonmuscle myosin light chain (MLC) (31). These effects result in an increase in the number and size of focal adhesions and lead to the development of stress fibers. ROCK is necessary for cardiac fibrosis in models of heart failure and can be specifically inhibited by either fasudil or Y-27632, each of which are equipotent (32).
We hypothesized that functional maturation of NRVMs, as measured by cell morphology and contractile force, depends on the stiffness of the extracellular substrate, and that the stiffness influences on contractility involves the RhoA/ROCK pathway. We tested this hypothesis by plating NRVMs on collagen-coated polyacrylamide gels and subsequently quantified contractile force produced by NRVMs with traction force microscopy. We also quantified influence of calcium and ROCK signaling in regulating force production by myocytes in these gels.
MATERIALS AND METHODS
All polyacrylamide and Western blot reactants were purchased from BioRad Laboratories (Hercules, CA) and other reactants were purchased from Sigma-Aldrich (St. Louis, MO) unless otherwise stated.
Deformable polyacrylamide cell substrate preparation and tensile modulus measurement
The deformable polyacrylamide substrates used in cell culture were made as in previous studies (26,27,33). Briefly, 3%–7% acrylamide and a 1:20 ratio of bisacrylamide with 5% fluorescent beads (Polysciences, Warrington, PA) were polymerized with 0.1% ammonium persulfate and 0.5% N,N,N′,N′-tetramethylethylenediamine. This solution was pipetted onto 18-mm glass coverslips activated with 3-aminopropyltrimethoxysilane and 0.8% glutaraldehyde. Gels were coated with 0.5 mg/mL of rat tail type I collagen bound through the heterobifunctional crosslinker N-sulfosuccinimidyl-6-[4′-azido-2′-nitrophenylamino] hexanoate (sulfo-SANPAH, Pierce Biotechnology, Rockville, IL).
The tensile elastic moduli of these gels were measured as in previous studies (26,27) by calculating the slope of the stress-strain curve found by hanging weights from a 15-mm thick cylinder of gel.
NRVM cell isolation, culture, and plating
Cardiac myocytes were harvested from freshly dissected ventricles of 1- to 3-day-old Sprague-Dawley rats using an isolation kit (Cellutron, Highland Park, NJ). Cells were plated and cultured as described previously (34) in high-serum plating media (Dulbecco modified Eagle media, 17% M199, 10% horse serum, 5% fetal bovine serum, 100 U/mL penicillin and 50 mg/mL streptomycin) at 10,000 cells/cm2. Approximately 18 h later, cells were transferred to low serum maintenance media (Dulbecco modified Eagle media, 18.5% M199, 5% horse serum, 1% fetal bovine serum, and antibiotics). Cell cultures were maintained at 37°C and 5% CO2 and fresh maintenance media was added every 2–3 days. For hydroxyfasudil treatment studies, cells were cultured in 1 μmol/L hydroxyfasudil. For C3 toxin treatment studies, cells were cultured in 5 μg/mL exoenzyme C3 from Clostridium botulinum (Calbiochem, San Diego, CA). All culture media was purchased from Invitrogen, Carlsbad, CA and sera was purchased from Gemini BioProducts, West Sacramento, CA. Animal studies were in accordance with University of California guidelines.
Morphology of NRVMs on gels of varying stiffness
To evaluate sarcomeric definition and organization, NRVMs were fixed and stained at 7 days after initial plating. Cells were fixed in 0.75% glutaraldehyde on ice for 20 min, permeabilized with 0.1% Triton X-100 for 5 min and stained with anti-α-actinin (Sigma), diluted in 1% bovine serum albumin (Gemini BioProducts) for 60 min. Secondary antibodies of tetra-rhodamine isothiocyanate-conjugated goat anti-rabbit (Jackson ImmunoResearch, West Grove, PA) in 1% bovine serum albumin were added for 30 min. Cells were imaged using a Nikon Eclipse TE300 inverted microscope with a Photometrics Cascade 512X CCD camera and acquired using Metamorph software (Molecular Devices, Sunnyvale, CA).
NRVMs used in confocal imaging experiments were stained with Vibrant CM-DiI (Invitrogen), then fixed in 4% paraformaldehyde (Electron Microscopy Sciences, Hatfield, PA) on ice for 20 min and permeabilized with 0.5% Triton X-100. Cells were stained with FITC-phalloidin and covered with gelvatol mounting medium and a coverslip. Cells were imaged on a spinning disk confocal microscope (Olympus, Center Valley, PA).
In addition, cell area and aspect ratio (long axis/short axis) were computed for all myocytes evaluated for histology, traction force, and calcium concentration by manually outlining cells in ImageJ (National Institutes of Health, Bethesda, MD).
Dynamic traction force microscopy
A complete traction force map of shear stresses at the surface of the gel was obtained through traction force microscopy, in which fluorescent beads embedded in the gel were tracked during cell contraction (24,25). Individual NRVMs at 7 days post-isolation were stimulated with an 8 ms pulse at 0.5 Hz. Voltage was increased from 0.1 V until the cell began beating. Cells that were in contact with other cells and those that did not beat were excluded. The deformation field and corresponding traction field were computed with custom-written MATLAB 7.0 code (The MathWorks, Natick, MA) as described in the Expanded Materials and Methods in Supplementary Material, Data S1.
Calcium transient and caffeine-induced calcium release measurement with Fura-2 and Fluo-4
NRVMs at 7 days post-isolation were loaded with 2 μmol/L Fura-2 or Fluo-4 (Molecular Probes) in high-calcium Tyrodes buffer (130 mmol/L NaCl, 5.4 mmol/L KCl, 2 mmol/L CaCl, 1 mmol/L MgCl2, 0.3 mmol/L Na2HPO4, 10 mmol/L HEPES, 5.5 mmol/L glucose at pH 7.4). Cells were stimulated as detailed above and imaged using a Nikon Eclipse TE3000 inverted microscope with a Lambda DG-4 filter changer (Sutter Instruments, Novato, CA) and a Photometrics Cascade 512X CCD camera, acquired using Metamorph software (Molecular Devices) and analyzed as detailed in the Expanded Materials and Methods in Data S1.
The amount of calcium stored in the sarcoplasmic reticulum of NRVMs was quantified by adding 10 mmol/L caffeine and measuring the resulting change in fluorescence as described above. Caffeine-induced calcium release was then reported as the plateau of fluorescence intensity after the addition of caffeine divided by the baseline fluorescence.
Western blot analysis of contractile and calcium handling proteins
Western blot analysis was used to assess the amount of actin, myosin, sarcoplasmic/endoplasmic reticular calcium ATPase (SERCA), phospholamban (PLN), and L-type calcium channel protein. At 7 days after plating, a lysate buffer (1% Triton X-100, 5 mmol/L EDTA, 5 mmol/L EGTA, 150 mmol/L NaCl, 20 mmol/L TRIS, 1 μmol/L PMSF, 2 μmol/L Na3VO4, 1 ng/mL leupeptin, and 1 ng/mL aprotinin) was added on ice for 30 min. As controls, freshly isolated NRVMs (106 cells) and cardiomyocytes from a freshly dissected and lyophilized adult rat heart were lysed in 1 mL of the same lysate buffer solution on ice for 15 min. The lysates were centrifuged for 15 min at 4500 × g and 4°C and the supernatant was frozen at −20°C. Protein content was determined with a BCA protein assay kit (Pierce Biotechnology). Cell lysates with equal amount of total protein were separated with 4%–12% denaturing SDS PAGE and transferred to a nitrocellulose membrane. Total protein content and transfer effectiveness was assayed by staining with Ponceau Solution and myosin heavy chain (MHC) content was assessed from scans of this stain. Membranes were washed in a TBST buffer (20 mmol/L Tris, 500 mmol/L NaCl, and 0.5% Tween 20), blocked with 5% nonfat dry milk (Carnation, Nestle USA, Glendale, CA), and blotted with antibodies to cardiac α-actin (mouse monoclonal; Sigma), SERCA2a (rabbit polyclonal, a gift from Wolfgang Dillman, University of California, San Diego), PLN (mouse monoclonal, Affinity Bioreagents, Golden, CO), phosphor-serine-16-PLN (rabbit polyclonal, Millipore, Billerica, MA), calcium channel cardiac α1C subunit (L-type calcium channel, rabbit; Sigma), myosin light chain (MLC2, rabbit polyclonal; Cell Signaling Technology, Danvers, MA), or Phospho-Ser19-MLC2 (rabbit polyclonal, Cell Signaling Technology) overnight. Secondary labeling was carried out with horse radish peroxidase-linked secondary antibodies for 30 min, developed with an ECL Detection System (GE Healthcare, Waukesha, WI) and exposed to film. Band densities were quantified using ImageJ.
Statistical analysis
Experimental differences were evaluated with ANOVA followed by post hoc Bonferroni t-tests. Comparisons with p < 0.05 were determined to be significant, although comparisons with p < 0.10 are noted. Error bars represent SD unless otherwise noted.
RESULTS
Tensile modulus of polyacrylamide gels
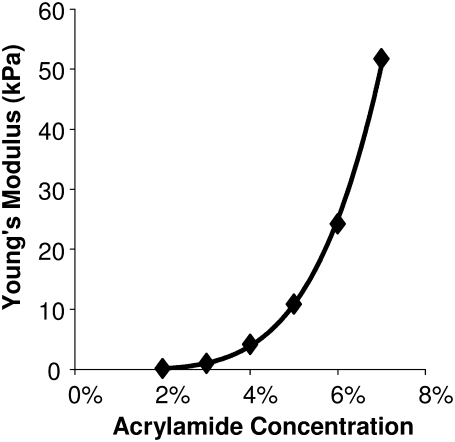
Polyacrylamide gel elastic modulus was measured using tensile tests. The tensile modulus of the gel substrates increased exponentially with the concentration of acrylamide and bisacrylamide (Fig. 1). The elastic modulus of each individual gel was linear up to at least 25% strain (data not shown). For simplicity, the elastic modulus reported here for each gel in the rest of the results and graphs was rounded to 1 kPa, 5 kPa, 10 kPa, 25 kPa, and 50 kPa for 3%, 4%, 5%, 6%, and 7% acrylamide gels, respectively.
FIGURE 1.
The Young's modulus of elasticity of polyacrylamide gels varies over a physiologic range of 1–50 kPa with varying monomer from 2% to 7% and a 1:20 monomer/cross-linker ratio.
Morphology of ventricular myocytes on different gels
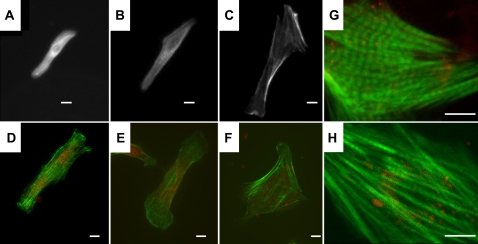
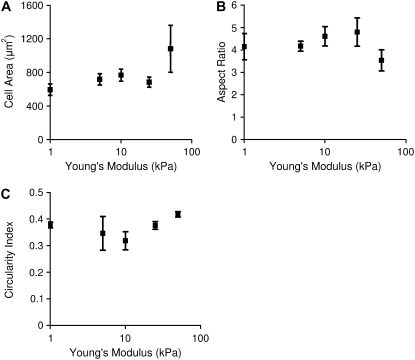
Differences in the structure and organization of the actin cytoskeleton were observed in cells stained for α-actinin (Fig. 2, A–C) or F-actin (Fig. 2, D–H). Cells on the stiffest substrates appear to have a less structured cytoskeleton, with no apparent aligned sarcomeres and with actin localized both in the nucleus and around the perimeter of the cell. These cells also have stress fibers, which were not seen in cells on softer substrates or in vivo. However, cells on the stiffest substrate could still be induced to beat when a voltage stimulus was applied. Despite these apparent morphological differences, analysis of the cell spread area and the aspect ratio, calculated as the length of the long axis of the cell divided by the length of the short axis, was not significantly different between gel stiffness (Fig. 3, A and B). The circularity index, calculated as 4πA/P2 where A is the area and P is the perimeter, is significantly greater for the cells on the stiffest gels compared to the cells on the 10 kPa gels (Fig. 3 C). The circularity index would be exactly 1 for a circular cell and decreases as the cell becomes less circular and develops a spindle, myocytes-like morphology.
FIGURE 2.
NRVMs on polyacrylamide gels and labeled for α-actin have poorly defined striations on soft 1 kPa substrates (A), well defined and aligned striations on 10 kPa substrates (B), and unaligned striations with long, large stress fibers on stiff 50 kPa gels (C). NRVMs plated on polyacrylamide gels and labeled with phalloidin (green) and DiI (red) show an axially-aligned cytoskeleton throughout the cell on 1 kPa (D) and 10 kPa (E) gels but F-actin concentrated on the periphery and nucleus and no axial alignment on 50 kPa gels (F). Zoomed-in confocal images of NRVMs on 10 kPa gels (G) and 50 kPa gels (H) better show differences in sarcomeric structure and alignment. Scale bars = 10 μm.
FIGURE 3.
Cell area (A) and aspect ratio (B) are not significantly different across the gel stiffnesses (ANOVA, Area p = .13). Circularity index (C) is significantly different between cells on 10 kPa and cells on 50 kPa gels (p < 0.05). Data points represent 15 cells/point. Error bars represent SE.
Dynamic traction force microscopy and shortening velocity
An analysis of the percentage of cells that contracted when electrically stimulated shows a negative correlation with elastic modulus, as 85%, 65%, 55%, 55%, and 45% of cells (n = 20) on 1, 5, 10, 25, and 50 kPa gels, respectively, contracted when stimulated. All reported values in this study only include cells that contracted when stimulated.
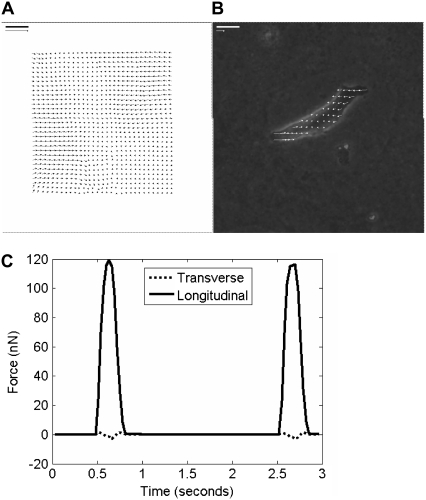
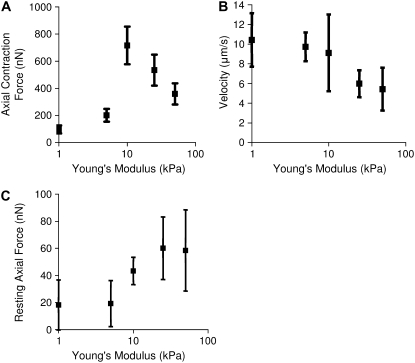
Images of fluorescent beads captured at 66 images/s were compared to the cell-free reference image to generate a displacement map (Fig. 4 A) and analyzed based on continuum equations describing gel mechanics to generate a traction map (Fig. 4 B). Tractions (in units of force/area) were then integrated over area, resolved into their x and y components and projected onto cell axes to evaluate force versus time (Fig. 4 C). Neonatal rat cardiac myocytes cultured for 7 days after isolation generated an average of 720 ± 140 nN of axial force on mid-range gels of 10 kPa. However, cells plated on softer 1 kPa or stiffer 50 kPa substrates generated significantly less force during contraction (Fig. 5 A). Myocytes on intermediate gels of 5 kPa or 25 kPa elastic modulus generated intermediate forces.
FIGURE 4.
Traction force microscopy provides a measurement of cell contractile force without disturbing cell attachment. Cells were stimulated at 0.5 Hz for 0.8 ms and the movement of fluorescent beads embedded in the substrate was imaged. Bead displacement between images was tracked using a cross-correlation algorithm (A). Scale bar = 10 μm, scale arrow is 10 μm displacement. These displacements were converted to shear stresses on the gel surface (B). Scale bar = 10 μm, scale arrow is 1 kPa (1000 nN/μm2). The stresses were projected onto the long and short axis of the cell and integrated over the cell area to calculate an axial and longitudinal force over time (C).
FIGURE 5.
Axial contraction force (A) peaks in cells on 10 kPa gels and decreases in cells on stiffer or softer gels. The contraction force was calculated through dynamic traction force microscopy. Contraction force is significantly different across all gels per ANOVA and force was significantly greater on 10 kPa gels compared to 1 kPa and 5 kPa gels (p < 0.05). The velocity of shortening of the major axis (B) trends downward as stiffness increases though individual velocities are not significantly different per ANOVA. The resting axial force increases as the substrate stiffness increase (C) though individual points are not different per ANOVA. All points are averages of 15 cells. Error bars represent SE.
The velocity of shortening of the major axis of the cardiomyocyte decreased as the extracellular substrate modulus increased (Fig. 5 B). In addition, NRVMs on 50 kPa gels had sarcomeres of 2.23 ± 0.09 μm (n = 5) and contracted 0.8 ± 0.2% (n = 15) of the cell length at 5 ± 2 μm/s (n = 15). NRVMs on 1 kPa gels had sarcomeres of 1.69 ± 0.15 μm (n = 5) and contracted 23 ± 0.4% (n = 15) of the cell length at 10 ± 1 μm/s (n = 15).
Calcium transients and caffeine-induced calcium release
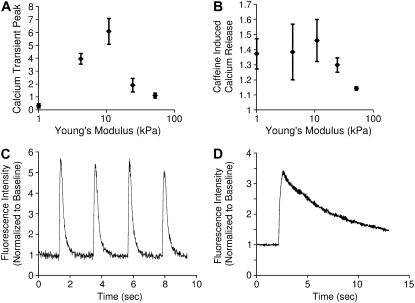
The magnitudes of calcium transients were measured in stimulated NRVMs using Fura-2 or Fluo-4 calcium indicator (Fig. 6 A). The transient size was greatest in cardiomyocytes cultured on 10 kPa gels (computed as 84 ± 21 nmol/L from Fura-2 data, n = 6) and lower in cells cultured on substrates with a higher or lower elastic modulus. Note that the shape of the relationship between the calcium transient and substrate stiffness mirrored that of axial force and substrate stiffness (from Fig. 5). The magnitude of the caffeine-induced calcium release again was highest on the 10 kPa substrates and progressively lower on softer or stiffer substrates (Fig. 6 B).
FIGURE 6.
The relationship between measures of calcium handling in NRVMs and substrate stiffness mirrors the force relationship. The magnitude of calcium transients (A), measured as peak fluorescence divided by baseline fluorescence, in Fura-2 or Fluo-4 labeled NRVMs on 10 kPa gels was significantly greater than transients on 1 kPa and 50 kPa gels (p < 0.05) (A). n = 6, 7, 10, 7, and 9 for 1, 5, 10, 25, and 50 kPa substrates, respectively. The magnitude of sarcoplasmic calcium stores (B), measured as the plateau of Fluo-4 fluorescence after stimulation with caffeine divided by baseline fluorescence, was significantly different per ANOVA (p < 0.05) and the calcium release of the cells cultured on 50 kPa gels was significantly lower than on 1 kPa and 10 kPa gels (p < 0.05). n = 13, 8, 12, 4, and 4 for 1, 5, 10, 25, and 50 kPa substrates, respectively. Representative traces of calcium transients (C) and of caffeine-induced calcium release transients (D) are also shown.
Western blot analysis of contractile and calcium handling proteins
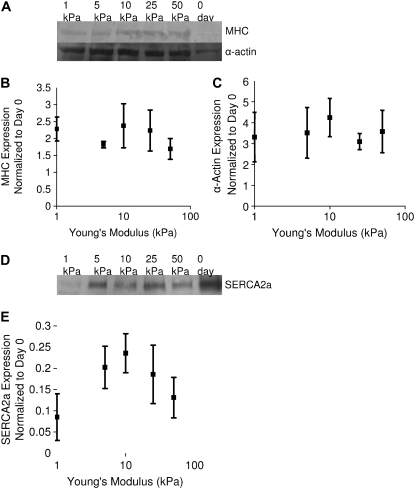
Western blots of cardiac α-actin and MHC expression (Fig. 7, A and B) show no significant differences between cardiomyocytes on any stiffness gel, suggesting the above observations are functional differences, as opposed to contractile protein expression differences. Western blot analysis of SERCA2a expression (Fig. 7, C and D) showed a substrate stiffness-dependent expression that mirrors calcium transients (Fig. 6) and axial force (Fig. 5), with the maximal SERCA2a expression occurring in cardiomyocytes cultured on gels of 10 kPa. SERCA2a expression in day-0 myocytes was four times the amount of the expression in cells on 10 kPa gels and significantly greater than any day-7 conditions (Fig. 7 C). Western blots showed no differences in abundance of PLN and the L-type calcium channel had no differences in expression between cells cultured on gels of different stiffnesses (not shown). Phospho-(Ser-16)-PLN was present in adult whole heart lysate but not in day-0 or day-7 NRVMs (not shown).
FIGURE 7.
Results of Western blots of cell lysates for cardiac α-actin and MHC (A) show no differences in expression (B and C). Amounts of α-actin are significantly different per ANOVA and cells cultured on 10 kPa gels have significantly more actin than 0-day controls. Amount of myosin is greater in all cases but individual results were not significant. Western blot for SERCA2a (D) shows differences in expression that mirrors sarcoplasmic calcium stores, calcium transients, and force (E). Expression of SERCA2a is significantly different across gels per ANOVA (p < 0.05) though individual differences are not significant. Data presented are the average of protein analysis from four separate lysates, normalized to the average expression of the protein from day-0 unplated NRVMs.
Contractile force and calcium handling in hydroxyfasudil-treated cells
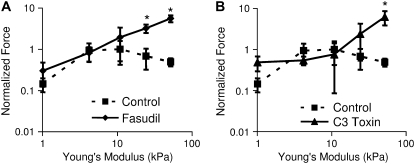
Seven-day treatment of cell cultures with 1 μM hydroxyfasudil, a ROCK inhibitor (Fig. 8 A), or C3 toxin, a RhoA inhibitor (Fig. 8 B), resulted in a positive correlation between force and elastic modulus (Fig. 8). NRVMs cultured on both 25 kPa and 50 kPa gels and treated with hydroxyfasudil exhibited significantly greater traction force than control cells (p < 0.05). NRVMs treated cultured on 50 kPa gels and treated with C3 toxin also exhibited significantly greater traction force than control cells (p < 0.05). These results suggest that the effects of substrate stiffness on NRVM maturation, at least on substrates stiffer than the native myocardium, are regulated through the RhoA/ROCK pathway. Though Western blots could detect phosphorylated myosin light chain in adult rat whole heart lysate controls, phosphorylated myosin light chain levels in NRVMs were too low to detect on any gel stiffness (results not shown). However, immunostaining of fixed cells shows very low levels of phospho-(ser19)-MLC in NRVMs on soft gels and phospho-(ser19)-MLC associated with cytoskeletal fibers on gels of 25 kPa and higher stiffness (results not shown).
FIGURE 8.
Inhibition of ROCK with hydroxyfasudil (A) significantly inhibits the decrease in force observed by NRVMs on stiff gels of 25 kPa and 50 kPa elastic modulus (p < 0.05) and force continually increases with increasing stiffness in fasudil-treated cells. Similarly, inhibition of RhoA with C3 toxin (B) also inhibits the force reduction on the stiffest gels (p < 0.05). Results are normalized to average for control cells at 10 kPa elastic modulus. These results suggest that the adaptation of NRVMs to stiff gels requires the RhoA/ROCK pathway. In addition, force increases directly with elastic modulus of the gel. Fasudil-treated n = 8, 9, 9, 10, and 7 for 1, 5, 10, 25, and 50 kPa substrates, respectively. Control n = 5 in all cases. Error bars represent SE.
DISCUSSION
We hypothesized that substrate stiffness affects the maturation of cultured NRVMs. We found that substrate stiffness does affect force generation, with maximal force generation on substrates of 10 kPa, near the stiffness of native myocardium.
In cardiac myocytes, contractile force is regulated by the size and duration of the calcium transient during contraction, and in adult myocytes, most of this calcium comes from the sarcoplasmic reticulum (SR). The size of these stores and the rate of their release are strongly controlled through actions involving SERCA2a, which pumps calcium ions into the sarcoplasmic stores, and the ryanodine receptor (RyR2), which releases calcium from the SR (35). SERCA2a is predominantly regulated by PLN, which is itself inhibited when phosphorylated (36). Studies have found significantly increased expression in both RyR2 (37) and SERCA2a (38,39) in maturing NRVMs. On the other hand, the expression of PLN does not change significantly after embryo day 12 (37). As a result, the amount and regulation of calcium storage in these cardiac myocytes significantly changes (40), resulting in altered shape and size of calcium transients during cell contraction (41). We found that the magnitude of force generation in NRVMs correlates with the magnitude of the calcium transient, the amount of SR calcium and the expression of SERCA2a, suggesting that substrate stiffness affects calcium dynamics as a mechanism of contractile force regulation. However, the effect of substrate stiffness on NRVM force generation seems to also involve cytoskeletal structure and sarcomere alignment, as NRVMs cultured on 10 kPa gels, as well as softer gels, have well defined sarcomeres whereas NRVMs on the stiffest gels have less sarcomere definition and alignment and many of these cells have stress fibers. One might hypothesize that these stress fibers interfere with the development and organization of sarcomeres and the maturation of NRVMs.
Having shown that substrate stiffness affects cell behavior, morphology, and calcium handling in NRVMs cultured for 7 days, we tested the hypothesis that the observed maturation differences on gels of different stiffness involves the ROCK pathway. We found that blocking the ROCK pathway with hydroxyfasudil inhibits the reduction in cell traction force on substrates stiffer than 10 kPa. The force of cardiomyocyte contraction has been shown to be directly related to the change in cell length and indirectly related to the contractile velocity (42). Though the direct relationship between length, velocity, tension, and contractile force depends on many kinetic parameters (43) not measured as part of this study, we did measure greater starting sarcomere length, lower change in cell length and lower velocity in cells on the stiffest gel versus the softest gel and these effects could, in themselves, cause the observed force relationship in cells treated with hydroxyfasudil. These results suggest that NRVMs fail to mature when plated on substrates that are stiffer than the native myocardium through a mechanism that results in lower contractile force and involves RhoA and ROCK. Because stimulation of the RhoA/ROCK pathway leads to the formation of actin stress fibers (32) and fasudil-treated cardiomyocytes on the stiffest gels exhibit well defined sarcomeres rather than stress fibers, this result is congruent with a hypothesis that the formation of actin stress fibers has a negative effect on sarcomeric formation and the maturation of neonatal ventricular myocytes. In addition, some models of the formation of mature myofibrils involve stress fiber scaffolds in the earliest stage of sarcomere development, which then allow premyofibrils, which are scattered units of sarcomeric proteins, to form into sarcomeres (44). This model is consistent with the hypothesis that stress fibers represent a less mature stage in cardiomyocyte development, and also consistent with the observation that the amount of the sarcomeric α-actin and MHC proteins are constant across gels of varying stiffness but the organization into sarcomeres changes as NRVMs mature.
NRVMs cultured for 7 days after isolation generated ∼700 nN of force on mid-stiffness gels of 10 kPa, which is approximately the range of stiffness found in normal resting heart tissue (45). This force is about half the axial force measured in fully mature adult myocytes (22). Furthermore, the peak calcium transient on 10 kPa gels for NRMVs at 7 days past isolation was 81 nM, which is only ∼25% of the magnitude of the calcium transient measured in NRVMs at 7 days post isolation in other studies of cells cultured on glass (40). In addition, NRVMs cultured for 7 days, even on the ideal gel stiffness of 10 kPa, expressed less cardiac-α-actin and MHC than adult rat cardiomyocyte controls. These cells are more likely somewhere between neonatal and adult phenotypes and morphology, indicating that a synergy exists between mechanical cues and chemical ones, as has been found in stiffness control experiments of myocyte development from mesenchymal stem cells (10).
In summary, we have shown that substrate stiffness affects functional maturation in NRVMs. NRVMs cultured for 7 days post-isolation produce maximal force on substrates of ∼10 kPa. The mechanism of altering contraction force appears to act through maximal expression of SERCA2a on the 10-kPa gels, resulting in maximal SR calcium load and calcium transients during contraction.
The mechanotransduction pathway leading to this effect involves protein signaling by ROCK and inhibition of ROCK seems to inhibit cell adaptation to extracellular stiffness. We speculate that cytoskeletal rearrangements induced by activation of the ROCK pathway in environments stiffer than those typically found in native myocardium may prevent sarcomere development and maturation of cardiomyocytes. These pathways may be applicable not only in cardiomyocyte development, but also in the progression of congenital heart diseases and cardiomyopathies. Furthermore, extracellular substrate stiffness could possibly influence stem cell differentiation in recent therapies of injected stem cells postinfarction and could play a role in cardiomyopathies after infarction-induced changes in myocardial stiffness.
SUPPLEMENTARY MATERIAL
To view all of the supplemental files associated with this article, visit www.biophysj.org.
Supplementary Material
Acknowledgments
The authors acknowledge Zhuangjie Li and Aundrea Graves for assistance in ventricular myocyte isolation and culture, Elliot Howard and Peter Alexandrov for assistance in polyacrylamide gel manufacture, Fred Lionetti for assistance in manuscript preparation and Darrell Belke for assistance in Western blotting protocols. We thank the lab of Wolfgang Dillman at UCSD for providing us with the antibodies against α-actin, SERCA2a, PLN, and phospho-(serine-13)-PLN.
This study was supported by the National Institutes of Health (HL-07770, HL-07089, HL-43026 and HL-46345) and the National Science Foundation (BES-0506252). Confocal images presented here were generated at the National Center for Microscopy and Imaging Research at San Diego, which is supported by the National Institutes of Health (NIH) through a National Center for Research Resources program grant P41 PR04050 awarded to Dr. Mark Ellisman.
Editor: Denis Wirtz.
References
- 1.Hudlicka, O., and M. D. Brown. 1996. Postnatal growth of the heart and its blood vessels. J. Vasc. Res. 33:266–287. [DOI] [PubMed] [Google Scholar]
- 2.Fukuda, K., and S. Yuasa. 2006. Stem cells as a source of regenerative cardiomyocytes. Circ. Res. 98:1002–1013. [DOI] [PubMed] [Google Scholar]
- 3.Dowell, J. D., M. Rubart, K. B. Pasumarthi, M. H. Soonpaa, and L. J. Field. 2003. Myocyte and myogenic stem cell transplantation in the heart. Cardiovasc. Res. 58:336–350. [DOI] [PubMed] [Google Scholar]
- 4.Menasche, P. 2005. The potential of embryonic stem cells to treat heart disease. Curr. Opin. Mol. Ther. 7:293–299. [PubMed] [Google Scholar]
- 5.Srivastava, D., and K. N. Ivey. 2006. Potential of stem-cell-based therapies for heart disease. Nature. 441:1097–1099. [DOI] [PubMed] [Google Scholar]
- 6.Brown, X. Q., K. Ookawa, and J. Y. Wong. 2005. Evaluation of polydimethylsiloxane scaffolds with physiologically-relevant elastic moduli: interplay of substrate mechanics and surface chemistry effects on vascular smooth muscle cell response. Biomaterials. 26:3123–3129. [DOI] [PubMed] [Google Scholar]
- 7.Guo, W. H., M. T. Frey, N. A. Burnham, and Y. L. Wang. 2006. Substrate rigidity regulates the formation and maintenance of tissues. Biophys. J. 90:2213–2220. [DOI] [PMC free article] [PubMed] [Google Scholar]
- 8.Griffin, M. A., S. Sen, H. L. Sweeney, and D. E. Discher. 2004. Adhesion-contractile balance in myocyte differentiation. J. Cell Sci. 117:5855–5863. [DOI] [PubMed] [Google Scholar]
- 9.Engler, A. J., M. A. Griffin, S. Sen, C. G. Bonnemann, H. L. Sweeney, and D. E. Discher. 2004. Myotubes differentiate optimally on substrates with tissue-like stiffness: pathological implications for soft or stiff microenvironments. J. Cell Biol. 166:877–887. [DOI] [PMC free article] [PubMed] [Google Scholar]
- 10.Engler, A. J., S. Sen, H. L. Sweeney, and D. E. Discher. 2006. Matrix elasticity directs stem cell lineage specification. Cell. 126:677–689. [DOI] [PubMed] [Google Scholar]
- 11.Koltai, M. Z., I. Balogh, M. Wagner, and G. Pogatsa. 1984. Diabetic myocardial alterations in ultrastructure and function. Exp. Pathol. 25:215–221. [DOI] [PubMed] [Google Scholar]
- 12.Mazhari, R., J. H. Omens, J. W. Covell, and A. D. McCulloch. 2000. Structural basis of regional dysfunction in acutely ischemic myocardium. Cardiovasc. Res. 47:284–293. [DOI] [PubMed] [Google Scholar]
- 13.Herrmann, K. L., A. D. McCulloch, and J. H. Omens. 2003. Glycated collagen cross-linking alters cardiac mechanics in volume-overload hypertrophy. Am. J. Physiol. Heart Circ. Physiol. 284:H1277–H1284. [DOI] [PMC free article] [PubMed] [Google Scholar]
- 14.Omens, J. H., T. P. Usyk, Z. Li, and A. D. McCulloch. 2002. Muscle LIM protein deficiency leads to alterations in passive ventricular mechanics. Am. J. Physiol. Heart Circ. Physiol. 282:H680–H687. [DOI] [PubMed] [Google Scholar]
- 15.Weis, S. M., J. L. Emery, K. D. Becker, D. J. McBride, Jr., J. H. Omens, and A. D. McCulloch. 2000. Myocardial mechanics and collagen structure in the osteogenesis imperfecta murine (OIM). Circ. Res. 87:663–669. [DOI] [PubMed] [Google Scholar]
- 16.Berry, M. F., A. J. Engler, Y. J. Woo, T. J. Pirolli, L. T. Bish, V. Jayasankar, K. J. Morine, T. J. Gardner, D. E. Discher, H. L. Sweeney. 2006. Mesenchymal stem cell injection after myocardial infarction improves myocardial compliance. Am. J. Physiol. Heart Circ. Physiol. 290:H2196–H2203. [DOI] [PubMed] [Google Scholar]
- 17.Lucchesi, P. A., and K. J. Sweadner. 1991. Postnatal changes in Na,K-ATPase isoform expression in rat cardiac ventricle. Conservation of biphasic ouabain affinity. J. Biol. Chem. 266:9327–9331. [PubMed] [Google Scholar]
- 18.Li, F., X. Wang, J. M. Capasso, and A. M. Gerdes. 1996. Rapid transition of cardiac myocytes from hyperplasia to hypertrophy during postnatal development. J. Mol. Cell. Cardiol. 28:1737–1746. [DOI] [PubMed] [Google Scholar]
- 19.Soonpaa, M. H., K. K. Kim, L. Pajak, M. Franklin, and L. J. Field. 1996. Cardiomyocyte DNA synthesis and binucleation during murine development. Am. J. Physiol. 271:H2183–H2189. [DOI] [PubMed] [Google Scholar]
- 20.Fraticelli, A., R. Josephson, R. Danziger, E. Lakatta, and H. Spurgeon. 1989. Morphological and contractile characteristics of rat cardiac myocytes from maturation to senescence. Am. J. Physiol. 257:H259–H265. [DOI] [PubMed] [Google Scholar]
- 21.Tasche, C., E. Meyhofer, and B. Brenner. 1999. A force transducer for measuring mechanical properties of single cardiac myocytes. Am. J. Physiol. 277:H2400–H2408. [DOI] [PubMed] [Google Scholar]
- 22.Shepard, N., M. Vornanen, and G. Isenberg. 1990. Force measurements from voltage-clamped guinea pig ventricular myocytes. Am. J. Physiol. 258:H452–H459. [DOI] [PubMed] [Google Scholar]
- 23.Brandt, P. W., F. Colomo, N. Piroddi, C. Poggesi, and C. Tesi. 1998. Force regulation by Ca2+ in skinned single cardiac myocytes of frog. Biophys. J. 74:1994–2004. [DOI] [PMC free article] [PubMed] [Google Scholar]
- 24.Dembo, M., and Y. L. Wang. 1999. Stresses at the cell-to-substrate interface during locomotion of fibroblasts. Biophys. J. 76:2307–2316. [DOI] [PMC free article] [PubMed] [Google Scholar]
- 25.Marganski, W. A., M. Dembo, and Y. L. Wang. 2003. Measurements of cell-generated deformations on flexible substrata using correlation-based optical flow. Methods Enzymol. 361:197–211. [DOI] [PubMed] [Google Scholar]
- 26.Rajagopalan, P., W. A. Marganski, X. Q. Brown, and J. Y. Wong. 2004. Direct comparison of the spread area, contractility, and migration of Balb/c 3T3 fibroblasts adhered to fibronectin- and RGD-modified substrata. Biophys. J. 87:2818–2827. [DOI] [PMC free article] [PubMed] [Google Scholar]
- 27.Gaudet, C., W. A. Marganski, S. Kim, C. T. Brown, V. Gunderia, M. Dembo, and J. Y. Wong. 2003. Influence of type I collagen surface density on fibroblast spreading, motility, and contractility. Biophys. J. 85:3329–3335. [DOI] [PMC free article] [PubMed] [Google Scholar]
- 28.Marganski, W. A., V. M. De Biase, M. L. Burgess, and M. Dembo. 2003. Demonstration of altered fibroblast contractile activity in hypertensive heart disease. Cardiovasc. Res. 60:547–556. [DOI] [PubMed] [Google Scholar]
- 29.Lin, G., G. P. Craig, L. Zhang, V. G. Yuen, M. Allard, J. H. McNeill, and K. M. MacLeod. 2007. Acute inhibition of Rho-kinase improves cardiac contractile function in streptozotocin-diabetic rats. Cardiovasc. Res. 75:51–58. [DOI] [PubMed] [Google Scholar]
- 30.Peters, S. L. M., and M. C. Michel. 2007. The Rhoa/Rho kinase pathway in the myocardium. Cardiovasc. Res. 75:3–4. [DOI] [PubMed] [Google Scholar]
- 31.Kimura, K., M. Ito, M. Amano, K. Chihara, Y. Fukata, M. Nakafuku, B. Yamamori, J. Feng, T. Nakano, K. Okawa, and others. 1996. Regulation of myosin phosphatase by Rho and Rho-associated kinase (Rho-kinase). Science. 273:245–248. [DOI] [PubMed] [Google Scholar]
- 32.Noma, K., N. Oyama, and J. K. Liao. 2006. Physiological role of rocks in the cardiovascular system. Am. J. Physiol. Cell Physiol. 290:C661–C668. [DOI] [PMC free article] [PubMed] [Google Scholar]
- 33.Jacot, J. G., S. Dianis, J. Schnall, and J. Y. Wong. 2006. A simple microindentation technique for mapping the microscale compliance of soft hydrated materials and tissues. J. Biomed. Mater. Res. A. 79:485–494. [DOI] [PubMed] [Google Scholar]
- 34.Gopalan, S. M., C. Flaim, S. N. Bhatia, M. Hoshijima, R. Knoell, K. R. Chien, J. H. Omens, and A. D. McCulloch. 2003. Anisotropic stretch-induced hypertrophy in neonatal ventricular myocytes micropatterned on deformable elastomers. Biotechnol. Bioeng. 81:578–587. [DOI] [PubMed] [Google Scholar]
- 35.Lodish, H., A. Berk, S. L. Zipursky, P. Matsudaira, D. Baltimore, and J. Darnell. 2000. Molecular Cell Biology, 4th ed. WH Freeman and Company, New York.
- 36.Asahi, M., K. Otsu, H. Nakayama, S. Hikoso, T. Takeda, A. O. Gramolini, M. G. Trivieri, G. Y. Oudit, T. Morita, Y. Kusakari, and others. 2004. Cardiac-specific overexpression of sarcolipin inhibits sarco(endo)plasmic reticulum Ca2+ ATPase (SERCA2a) activity and impairs cardiac function in mice. Proc. Natl. Acad. Sci. USA. 101:9199–9204. [DOI] [PMC free article] [PubMed] [Google Scholar]
- 37.Wibo, M., G. Bravo, and T. Godfraind. 1991. Postnatal maturation of excitation-contraction coupling in rat ventricle in relation to the subcellular localization and surface density of 1,4-dihydropyridine and ryanodine receptors. Circ. Res. 68:662–673. [DOI] [PubMed] [Google Scholar]
- 38.Fisher, D. J., C. A. Tate, and S. Phillips. 1992. The role of dicarboxylic anion transport in the slower Ca2+ uptake in fetal cardiac sarcoplasmic reticulum. Pediatr. Res. 32:664–668. [DOI] [PubMed] [Google Scholar]
- 39.Moorman, A. F., J. L. Vermeulen, M. U. Koban, K. Schwartz, W. H. Lamers, and K. R. Boheler. 1995. Patterns of expression of sarcoplasmic reticulum Ca(2+)-ATPase and phospholamban MRNAs during rat heart development. Circ. Res. 76:616–625. [DOI] [PubMed] [Google Scholar]
- 40.Gomez, J. P., D. Potreau, and G. Raymond. 1994. Intracellular calcium transients from newborn rat cardiomyocytes in primary culture. Cell Calcium. 15:265–275. [DOI] [PubMed] [Google Scholar]
- 41.Husse, B., and M. Wussling. 1996. Developmental changes of calcium transients and contractility during the cultivation of rat neonatal cardiomyocytes. Mol. Cell. Biochem. 163–164:13–21. [DOI] [PubMed] [Google Scholar]
- 42.McDonald, K. S., M. R. Wolff, and R. L. Moss. 1998. Force-velocity and power-load curves in rat skinned cardiac myocytes. J. Physiol. 511:519–531. [DOI] [PMC free article] [PubMed] [Google Scholar]
- 43.Niederer, S. A., and N. P. Smith. 2007. A mathematical model of the slow force response to stretch in rat ventricular myocytes. Biophys. J. 92:4030–4044. [DOI] [PMC free article] [PubMed] [Google Scholar]
- 44.Sanger, J. W., S. Kang, C. C. Siebrands, N. Freeman, A. Du, J. Wang, A. L. Stout, and J. M. Sanger. 2005. How to build a myofibril. J. Muscle Res. Cell Motil. 26:343–354. [DOI] [PubMed] [Google Scholar]
- 45.Wen, H., E. Bennett, N. Epstein, and J. Plehn. 2005. Magnetic resonance imaging assessment of myocardial elastic modulus and viscosity using displacement imaging and phase-contrast velocity mapping. Magn. Reson. Med. 54:538–548. [DOI] [PMC free article] [PubMed] [Google Scholar]
Associated Data
This section collects any data citations, data availability statements, or supplementary materials included in this article.


