Abstract
To better understand bilayer property dependency on lipid electrostatics and headgroup size, we use atomistic molecular dynamics simulations to study negatively charged and neutral lipid membranes. We compare the negatively charged phosphatidic acid (PA), which at physiological pH and salt concentration has a negative spontaneous curvature, with the negatively charged phosphatidylglycerol (PG) and neutrally charged phosphatidylcholine (PC), both of which have zero spontaneous curvature. The PA lipids are simulated using two different sets of partial charges for the headgroup and the varied charge distribution between the two PA systems results in significantly different locations for the Na+ ions relative to the water/membrane interface. For one PA system, the Na+ ions are localized around the phosphate group. In the second PA system, the Na+ ions are located near the ester carbonyl atoms, which coincides with the preferred location site for the PG Na+ ions. We find that the Na+ ion location has a larger effect on bilayer fluidity properties than lipid headgroup size, where the Alipid and acyl chain order parameter values are more similar between the PA and PG bilayers that have Na+ ions located near the ester groups than between the two PA bilayers.
INTRODUCTION
Cell membranes are composed of a medley of lipids. The expansive variety in chemical composition of biological lipids indicates that a wide range of structural features are needed to maintain cellular processes. In biological membranes, the majority of lipids are zwitterionic (without an overall charge), the most abundant being phosphatidylcholine (PC). Negatively charged lipids are also an important constituent of membranes; they typically comprise 10–20 mol % of lipids (1). The importance of these anionic lipids can be seen in a variety of cellular functions. For example, if the leaflet of the cell membrane facing the extracellular matrix contains the negatively charged lipid phosphatidylserine (PS), macrophages will know that cellular apoptosis has occurred and will digest the cell (2). Charged lipids also enable specific regions of a membrane to have very precise electrochemical properties. If the function of a transmembrane protein is to transfer positively charged ions across a membrane, negatively charged lipids solvating that protein will increase the concentration of positively charged ions near the protein opening (3). Besides classifying lipids by their charge state, lipid shape can influence bilayer properties and it is strongly dependent on the environmental pH and ion concentration. For example, in a supported lipid bilayer composed of 1,2-dioleoyl-sn-glycero-3-phosphocholine (DOPC)/1,2-dioleoyl-sn-glycero-3-phosphate (DOPA) bilayers, Cambrea et al. (4) found that when the salt asymmetry between leaflets was 51–100 mM KCl, the DOPA headgroup area increased in the upper leaflet, which caused the bilayer to bend away from the support.
Phosphatidylethanolamine (PE) lipids have small headgroups, where only three H atoms are attached to the N atom as compared to the three methyl groups attached to the N atom in PC lipids, resulting in the formation of the nonlamellar inverted hexagonal phase (5). Lipids, whose headgroups occupy a significantly different amount of area than that of the acyl chains, are called nonbilayer lipids, indicating that the lipids prefer to aggregate into nonlamellar structures in aqueous solution (6). Lipids having headgroup cross-sectional areas that are larger than that of the acyl chains will prefer to form micelles in aqueous solution and the lipid spontaneous curvature is one method of evaluating the formation of nonbilayer structures (7,8). The ubiquitous PC lipids have a cylindrical shape and will self-assemble into a lamellar phase, which is similar to the structure of biological membranes (6). The characteristic shape that a lipid exhibits is not only dependent on the area occupied by the headgroup and the acyl chains, but also on environmental conditions, such as pH, temperature, and salt concentration (6).
The existence of nonbilayer lipids in biological membranes is an interesting phenomenon considering that their preferred aggregate conformation is not a lamellar structure. It has been found that certain transmembrane proteins require the presence of these nonbilayer lipids to maintain functionality and that the stress that nonbilayer lipids impose on neighboring proteins may impact the protein conformational states (3). One interesting example is the interaction between phosphatidic acid (PA) lipids and the nicotinic acetylcholine receptor (nAChR), which is an ion channel that helps to initiate muscle contractions. Experimental studies have shown that unless the nAChR lipid neighborhood contains PA, the channel will favor a nonfunctional desensitized state (9–11). This connection between PA lipids and the nAChR is not only dependent on electrostatic interactions. Poveda et al. (12) reconstituted the nAChR in membranes that contained either PA, PS, or phosphatidylglycerol (PG) (all negatively charged) probes and found that only the membranes containing PA formed domains around the protein. PA lipids have a very small headgroup when compared with that of PG and PS, both of which have headgroups of similar size to PC lipids. Under physiological conditions of pH and salt (150 mM), PA lipids have a negative spontaneous curvature (8). A negative spontaneous curvature is common for lipids with small headgroups and in aqueous solution; these lipids may aggregate to form a Hexagonal II phase structure (13). Interestingly, if the PA lipids are not in contact with salt, they adopt a lamellar rather than a hexagonal structure because of strong headgroup repulsions (8). Since PA lipids comprise a very small fraction of the lipids found in biological membranes, it is intriguing that the membrane surrounding the nAChR has evolved such that it contains enough PA lipids to form a domain (12). A similar scenario has been seen for the vesicular stomatitis virus, where the viral protein interacts favorably with a host cell's PA lipids, which results in the formation of a PA domain (14).
Here we compare PA, PG, and PC lipids using molecular dynamics (MD) simulations to determine how lipid headgroup size and charge affect the structural properties of a bilayer. One experimental study found that as the fraction of PA and PG lipids increases in a PC membrane, the stability of the membrane decreases (15). In a supported DOPC/DOPA bilayer containing 30 mol % DOPA, it was shown that asymmetric salt concentrations across the leaflets caused the bilayer to bend away from the support. However, bending in the bilayer was not induced by salt asymmetry in 1-palmitoyl-2-oleoyl phosphatidylcholine (POPC)/1-palmitoyl-2-oleoyl phosphatidylglycerol (POPG) bilayers (30 or 50 mol % POPG) (4). This result shows that the spontaneous curvatures of the PA and PG lipids clearly diverge in response to similar environmental stimuli.
SIMULATION METHODS
We simulated 1-palmitoyl-2-oleoyl phosphatidic acid (POPA), 1-palmitoyl-2-oleoyl phosphatidylglycerol (POPG), and 1-palmitoyl-2-oleoyl phosphatidylcholine (POPC) bilayer systems that contained 128 lipids (64 per leaflet) and varying numbers of water molecules, Na+ ions, and Cl− ions (Table 1). The lipid structures for each simulation were based on a united atom model where the lipid acyl chain hydrogen atoms are not explicitly represented. For POPG, the  is 2.9 and for POPA, the
  is 3.5 and the
  is 9.5 (16). Hence, both the POPA and POPG lipids have a charge of negative one at neutral pH and therefore 128 Na+ ions were added to all POPA and POPG simulations to maintain system neutrality. In addition to these neutralizing Na+ ions, some of the systems included a 150 mM NaCl solution to replicate physiological salt concentrations.
TABLE 1.
The components found in each system, along with their equilibration time, Alipid, and bilayer thickness
| System | Equil. time (ns) | Water No. | Na+ ion No. | Cl− ion No. | Alipid (nm2) | Thickness (nm) |
|---|---|---|---|---|---|---|
| PAGAUSS | 20 | 5443 | 143 | 15 | 0.485 ± 0.003 nm2 | 4.68 ± 0.14 nm |
| PAFFGMX | 23 | 5443 | 143 | 15 | 0.520 ± 0.004 nm2 | 4.56 ± 0.01 nm |
| PAFFGMX−2 | 24 | 2332 | 128 | 0 | 0.511 ± 0.003 nm2 | 4.56 ± 0.05 nm |
| PGSALT | 29 | 5443 | 143 | 15 | 0.548 ± 0.004 nm2 | 4.45 ± 0.05 nm |
| PGNO_SALT | 7 | 5425 | 128 | 0 | 0.568 ± 0.005 nm2 | 4.30 ± 0.02 nm |
| PC | 25 | 3655 | 10 | 10 | 0.641 ± 0.006 nm2 | 4.05 ± 0.01 nm |
| PCNO_SALT | 26 | 2460 | 0 | 0 | 0.660 ± 0.006 nm2 | 3.85 ± 0.02 nm |
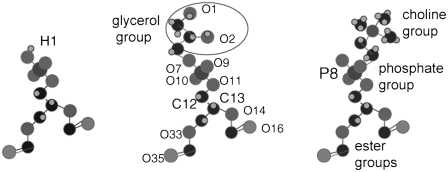
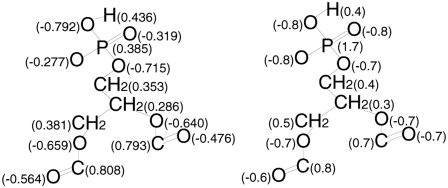
The simulations for PAFFGMX (see Table 1) were performed using the MD package GROMACS 3.3.1 and the remaining simulations were performed with GROMACS 3.2 (17–19). The force-field parameters for the POPA, POPG, and POPC phosphate group, ester groups, and acyl chains were identical and were a combination of lipid nonbonded parameters described by Berger et al. and the GROMOS87 force field (20,21). The starting configuration for the POPC bilayers was obtained from the end of a 1.6 ns simulation performed by Tieleman et al. (http://moose.bio.ucalgary.ca) and the POPC lipid choline groups are represented using ffgmx parameters (22). The starting configuration for the POPG bilayers came from the end of a 50-ns simulation by D. Elmore as well as the glycerol group charges and parameters (http://www.wellesley.edu/Chemistry/Don/home.html) (23). The POPA lipid was constructed by removing two methyl groups and the choline group from the POPC headgroup and adding a hydroxyl hydrogen (H1 in Fig. 1). Because we did not find published partial charges for the POPA headgroup, we used two different methods to calculate these values. In the first method, the POPA lipid geometry was optimized using the Smart algorithm in the software Materials Studio (Accelrys, San Diego, CA). No partial charges are assigned to the united atom tails and the charges for the remaining atoms were calculated at the HF level with the 6-31+G* basis set using the CHELPG method in Gaussian 03 (24). The POPA bilayer that used these charges is labeled PAGAUSS. In the second method, the POPA atoms were assigned the same partial charges that were used for identical atoms found in POPC and POPG. POPA has one additional hydroxyl group not present in POPC and this atom was a given a charge of +0.40, which is the ffgmx partial charge of a hydroxyl hydrogen from a methanol molecule. The POPA bilayer that used these charges is labeled PAFFGMX. The partial charges that were calculated using the two methods are shown in Fig. 2. The water parameters are from the simple point charge model (25). The simulations were coupled to a heat bath (T = 310 K) to maintain a physiological temperature using a Berendsen thermostat with a coupling time constant of 0.1 ps (26). The system pressure was maintained anisotropically at 1.0 bar using a Berendsen barostat with a coupling constant of 0.2 ps. Bond lengths were constrained using the LINCS algorithm (27). The Lennard-Jones interaction cutoff was 1.0 nm with a switch function starting at 0.8 nm. The electrostatics was calculated using the PME method (28) with a short-range cutoff of 1.0 nm. The center of mass motion of each leaflet was removed at every time step.
FIGURE 1.
Comparison of the POPA, POPG, and POPC headgroups.
FIGURE 2.
Comparison of the POPA partial charges. The charges on the left were calculated using Gaussian03 and the charges on the right match the partial charges found for identical POPG and POPC atoms, where the hydroxyl hydrogen charge is the same as a ffgmx methanol molecule.
The main phase transition temperatures for POPA (301 K), POPG (269 K), and POPC (268 K) are all lower than the system temperature of 310 K and thus the bilayers were in the fluid phase (29–31). The time step was 2 fs. The equilibration times are shown in Table 1 and the simulations were deemed equilibrated when the area per lipid had stabilized. The measurement of area per lipid is frequently used to monitor simulation equilibration because it is an experimentally accessible property and it reflects the state of a membrane. The equilibration phase was followed by an additional 10 ns of simulations for data analysis.
To ensure that there was not a large variation in the Na+ ion location during the 10-ns trajectory used for data analysis, we calculated the Na+ ion coordination number for the first and last 5 ns separately. The standard deviation in Na+ ion coordination number between the two trajectory segments is shown in Table 2. In the simulation of a system that contained a POPC bilayer and a 220 ± 30 mM NaCl solution, it was found that the ion distribution across the bilayer became equilibrated in 20 ns (32).
TABLE 2.
The first coordination shell for the Na+ ions with oxygen atoms O7, O11, O16, and O35 in the 10-ns trajectory; the standard deviation in the Na+ ion coordination number is shown in parentheses
| System | O7 | O11 | O16 | O35 |
|---|---|---|---|---|
| PAGAUSS | 5.78 (0.04) | 4.82 (0.06) | 0.19 (0.03) | 0.64 (0.03) |
| PAFFGMX | 1.02 (0.00) | 0.36 (0.10) | 2.65 (0.02) | 1.71 (0.03) |
| PAFFGMX−2 | 0.78 (0.05) | 0.23 (0.01) | 1.84 (0.05) | 1.25 (0.03) |
| PGSALT | 0.65 (0.01) | 0.062 (0.022) | 2.22 (0.07) | 1.45 (0.02) |
| PGNO_SALT | 0.85 (0.04) | 0.072 (0.014) | 2.42 (0.09) | 1.51 (0.02) |
| PC | 0.0044 (0.0054) | 0.031 (0.022) | 6.03 (0.21) | 2.22 (0.15) |
POPA partial charge
The discrepancies between the PAGAUSS and the PAFFGMX partial charges shown in Fig. 2 will result in different electronic distributions in the bilayer headgroups. PAGAUSS contains a negative dipole moment in the direction of atom P8 to atom O9 and a quadrupole moment in the phosphate group that is not present in PAFFGMX. Another significant difference between the two sets of partial charges is that in PAFFGMX, atoms H1, O7, P8, O9, and O10 have a net charge of −1. However, in PAGAUSS, these same atoms (phosphate group constituents) have a net charge of −1.3. Hence, the Na+ ions will have stronger interactions with the PAGAUSS phosphate group than the PAFFGMX phosphate group.
RESULTS
Bilayer fluidity comparison
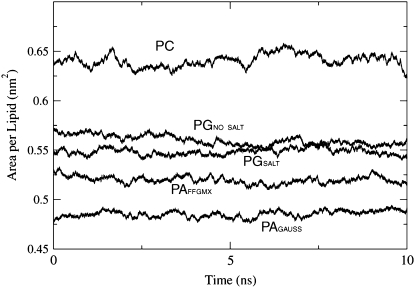
Bilayer fluidity can be monitored by calculating the area per lipid (Alipid), bilayer thickness, and acyl chain order parameters. As can be seen in Fig. 3, POPA has a smaller Alipid than both POPG and POPC, which is not surprising since its headgroup is significantly smaller than that of POPG and POPC (Fig. 1). Fig. 3 also shows that the addition of a 150 mM salt solution to the POPG bilayer resulted in a decrease in the Alipid. In a POPG simulation that contained a 100 mM NaCl solution, Elmore found that the Alipid was 0.561 ± 0.007 nm2 (23). The Alipid for this system, which had a slightly smaller salt concentration than the PGSALT system (150 mM), is between the Alipid values for the PGNO_SALT = 0.568 ± 0.005 nm2 and the PGSALT = 0.548 ± 0.004 nm2 systems. This order shows that an increase in NaCl concentration reduces the Alipid. In a simulation study of dipalmitoylphosphatidylcholine (DPPC) bilayers, Pandit et al. found that a 183 mM NaCl concentration reduces the DPPC lipid area by 0.22 nm2 (33). The Alipid value for system PCNO_SALT is comparable to the values seen in previous POPC bilayer simulations by Patra et al. (0.677 ± 0.003) nm2 (34) and Chiu et al. (0.664 ± 0.001) nm2 (35). Upon the addition of a 220 ± 30 mM NaCl solution to a POPC bilayer, Böckmann et al. (32) found that the average Alipid value decreased from 0.655 nm2 to 0.606 nm2. The POPG Alipid is significantly smaller than that of POPC, even though both have bulky headgroups. This reduced POPG area may be caused by interactions between the Na+ ions and the negatively charged lipids. Through experimental observations of dioleoylphosphatidylglycerol (DOPG) vesicle size, Claessens et al. (36) found that if headgroup charges are screened by counterions, the lipids will have closer packing, which leads to thicker membranes. We are unaware of any pure PA bilayer simulation studies with which to compare our Alipid values. In a recent simulation of a ternary mixture composed of POPC/POPA/cholesterol, Cheng et al. used Voronoi tessellation to calculate the Alipid. They found that the Alipid was fairly heterogeneous, which could be attributed to the variety of different interactions among bilayer constituents (37). However, the most common POPA Alipid value appeared to be similar to that of POPC (37). One experimental study found that at a pH of 7.2, POPA lipids in a monolayer have an area of 0.646 nm2 (29). This value is much larger than our simulated values and this disparity may be the result of a difference in experimental conditions. The experimentally determined force-area curves were measured at an air-water interface of 295 K and a surface pressure of 20 mN/m, whereas the simulations were conducted at 310 K and a surface tension of ∼35 mN/m, which corresponds to a tension-free lipid bilayer (38).
FIGURE 3.
The area per lipid during the 10-ns data analysis phase.
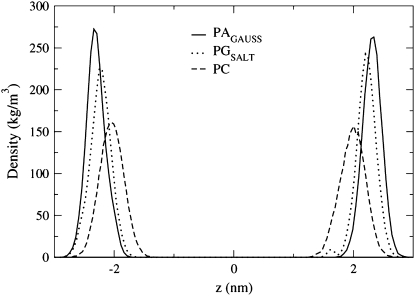
The thickness of the bilayer is here defined as the distance between the phosphorus (P) atom density profile peaks in the two leaflets. Based on this definition, Fig. 4 shows that the bilayer thickness decreases as Alipid increases. The crystal structure of dimyristoylphosphatidic acid (DMPA), which has the same headgroup as POPA but shorter acyl chains (only 14 carbons per chain and no sn−2 double bond), was found to have a bilayer thickness of 4.42 nm (39). The addition of a 150 mM NaCl solution increased the bilayer thickness in the POPG and POPC systems by 0.15 nm and 0.2 nm, respectively. In the simulation of a POPC bilayer, the bilayer thickness was found to increase by 0.22 nm upon the addition of a 220 ± 30 mM NaCl solution (32).
FIGURE 4.
The thickness of the PAGAUSS, PGSALT, and PC bilayers is defined as the distance between the P atom density profile peaks in opposite leaflets.
A third parameter used to measure fluidity is the chain order parameter. Since the hydrocarbon chain structures are based on united atom models, hydrogen atoms are not explicitly represented and the C-H bonds are reconstructed assuming tetrahedral geometry of the CH2 groups. The order parameter is defined as
 |
(1) |
where θCD is the angle between the CD-bond and the bilayer normal in experiments and in simulations the CD-bond is replaced by the CH-bond.
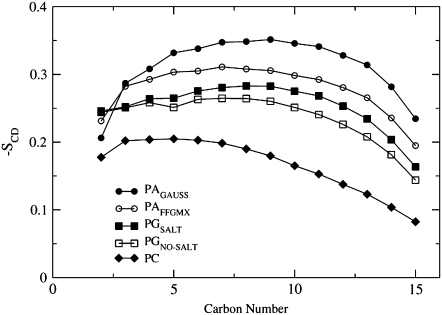
The order parameters are defined for carbon atoms Cn−1 through Cn+1 and thus for the three lipids examined, the order parameters are calculated for atoms C2 through C15 for the sn−1 chain. Just as POPA has the smallest area per lipid, its fatty-acid chains are the most ordered (Fig. 5). The high chain order seen for POPA corresponds with the close packing that accompanies small headgroups, where in a similar study, Murzyn et al. (40) found that there was a much denser packing of atoms in the chain region near the interface for a POPE/POPG bilayer than a POPC bilayer. It is interesting to note that for POPG carbon atoms 2–3, the order parameter profile is rather flat when compared with that of POPA, indicating that the upper chain region in POPG does not increase in fluidity. Mukhopadhyay et al. (41) found that in the presence of NaCl, the upper chain order parameter was increased and this was a result of the Na+ ions constricting the motion of the carbon-carbon bonds next to the carbonyl oxygen atoms. The POPC sn−1 SCD values in Fig. 5 span from 0.18 for atom C2 to 0.08 for atom C15. NMR measurements performed on POPC at 300 K show similar values for the sn−1 chain, where the SCD value for atom C2 is 0.2 and the value for atom C15 is 0.075 (31). Overall, we clearly see that POPC is the most fluid of the three, as its chains are the most disordered, leading to the largest Alipid, and smallest bilayer thickness.
FIGURE 5.
The PAGAUSS, PAFFGMX, PGSALT, PGNO_SALT, and PC order parameter profiles for the sn−1 chains.
Lipid interaction sites for Na+ ions and water molecules
To determine whether there is a preferred lipid interaction site for the Na+ ions, we use a radial distribution function (rdf) to calculate the likelihood of finding a Na+ ion a distance r from the phosphate and ester oxygen atoms.
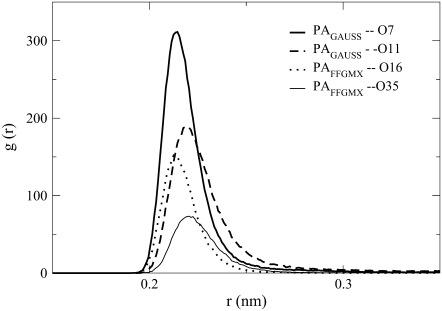
Fig. 6 shows the largest Na+ ion rdf profiles for PAGAUSS and PAFFGMX at the phosphate and ester oxygen atoms. The figure shows that there is a significant difference in Na+ ion location between the two POPA bilayers. In the PAGAUSS bilayer, the Na+ ions are concentrated near the phosphate group, and in the PAFFGMX bilayer, the Na+ ions prefer to reside near the ester carbonyl oxygen atoms. It is not surprising that the Na+ ion location varies between the two systems because the phosphate group has significantly different partial charges in the two bilayers. In the PAGAUSS system, the partial charges create a negative dipole across the phosphate group, which is strongly attractive to the Na+ ions. The PAFFGMX lipids do not, however, have a strong negative dipole moment in the phosphate group. The rdf for POPG is not shown in Fig. 6. However, the Na+ ions in both the PGSALT and the PGNO_SALT bilayers show a preference for the ester carbonyl oxygen atoms and this has been seen in a previous POPG simulation (42).
FIGURE 6.
The rdf between the Na+ ions and PAGAUSS atoms O7, O11 and PAFFGMX atoms O16, O35.
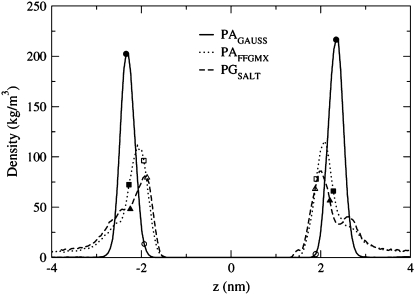
The preference that the Na+ ions show for the phosphate group in the PAGAUSS bilayer is again seen in Fig. 7, where the Na+ ion density profile peak corresponds to the location of the P atom density profile peak. The PAFFGMX peak is located between the P and O16 atom density profile peaks and the PGSALT peak is located very close to atom O16. The shape of the POPG density profile in Fig. 7 shows a distinguishable second Na+ ion peak, located above the lipid P atom near the water phase. This second peak was also seen in POPG simulations by Zhao et al. (23) and Elmore (42).
FIGURE 7.
Density profiles for the Na+ ions in the PAGAUSS, PAFFGMX, and PGSALT systems. The data points with a solid color show the location of the P atom density profile peak and the data points with no color in the interior show the location of the sn−2 carbonyl oxygen atom (O16) density profile peak.
Another useful method for characterizing the interactions between the Na+ ions and the phosphate and ester oxygen atoms is through the Na+ ion coordination number. This value represents the number of phosphate/ester oxygen atoms that are located within the first coordination shell of a Na+ ion. To obtain this value, we calculate the rdf between the Na+ ions and oxygen atoms O7, O11, O16, and O35 and integrate the peak from zero to 0.3 nm (see Fig. 6). To ensure that there was not a large variation in the ion location in the 10 ns trajectory used for data analysis, we calculated the coordination number for the first and last 5 ns separately. The standard deviation between the two sets of coordination numbers is shown in parentheses in Table 2.
Table 2 shows that the Na+ ion coordination numbers are much larger with the PAGAUSS phosphate oxygen atoms than with the PAFFGMX ester carbonyl oxygen atoms. The table also shows that the 10 Na+ ions in the PC system strongly interact with the sn−2 ester carbonyl (O16).
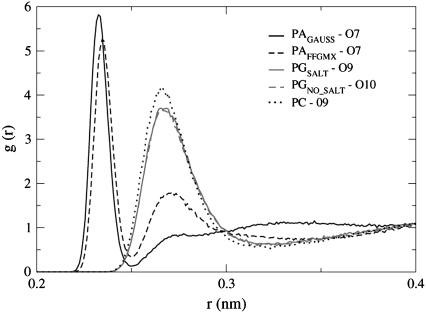
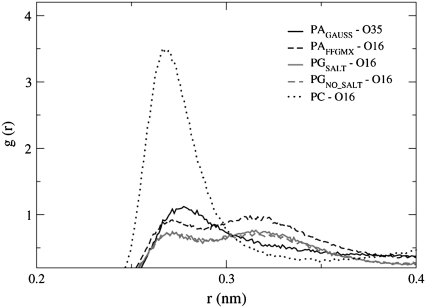
The rdf between the water oxygen atoms and the PAGAUSS, PAFFGMX, PGSALT, PGNO_SALT, and PC phosphate and ester oxygen atoms is shown in Figs. 8 and 9. Fig. 8 shows that the rdf peaks for both PAGAUSS and PAFFGMX are larger than the peaks for the POPG and POPC bilayers. The location of the POPA peaks is also different, where the largest peak for the POPA bilayers corresponds to atom O7 and the largest peak for the POPG and the POPC bilayers corresponds to atoms O9 and O10. Structurally, atom O7 may be more sterically hindered than O9 and O10 in the POPG and POPC lipids because the POPG glycerol groups and the POPC choline groups are attached to the phosphate group via atom O7. One fairly significant difference between the POPA rdf profiles is a substantial second rdf peak that can be seen for the PAFFGMX bilayer at r = 0.27 nm. This peak is not present in the PAGAUSS profile and its existence indicates that the water distribution in the PAFFGMX bilayer is not as narrowly confined to the vicinity of atom O7 as in the PAGAUSS bilayer. If we compare the rdf peak values between the water molecules and atoms O9 and O10 in the two POPA bilayers (not shown in Fig. 8), we find that the average O9/O10 peak height for PAGAUSS = 1.65 and for PAFFGMX = 3.53. This indicates that even though the preferred water interaction site in the phosphate group is atom O7 in both POPA bilayers, the likelihood of finding water near the O9/O10 atoms in the PAFFGMX bilayer is much greater than in the PAGAUSS bilayer.
FIGURE 8.
The rdf between water oxygen atoms and PAGAUSS, PAFFGMX, PGSALT, PGNO_SALT, and PC phosphate oxygen atoms. Only the rdfs with the oxygens exhibiting the largest peaks for each of the five systems is displayed.
FIGURE 9.
The rdf between water oxygen atoms and PAGAUSS, PAFFGMX, PGSALT, PGNO_SALT, and PC ester oxygen atoms. Only the largest rdf peak for each of the five systems is displayed.
The rdf between the water oxygen atoms and the lipid ester groups (Fig. 9) is three times larger in the POPC bilayer than in either the POPA or the POPG bilayer. This indicates that the negatively charged lipids are more dehydrated near the ester carbonyl oxygen atoms than the neutral bilayer. In a simulation comparison of POPG and POPC bilayers, Zhao et al. (42) found that water molecules located near the POPG water/membrane interface are highly polarized and show different ordering than water molecules located near the POPC interface. However, the translational diffusion of interfacial water molecules in these two bilayers is similar (43).
If we compare the POPC peaks shown in Figs. 8 and 9, we can see that the peak height is larger for the phosphate group than the ester group. Marshl et al. examined the effects of hydration level on a dioleoylphosphatidylcholine (DOPC) membrane and they calculated the rdf between the water oxygen atoms and the lipid headgroup atoms. They found that the largest peak, which was located at r ∼ 0.26–0.27 nm, had contributions from the phosphorus oxygen atoms, and to a lesser extent, the carbonyl atoms (44). This matches the results seen in Figs. 8 and 9, where the likelihood of finding a water molecule near the O9/O10 atoms is slightly larger than the likelihood of finding a water molecule near the carbonyl oxygen atoms.
Headgroup hydrogen bonding
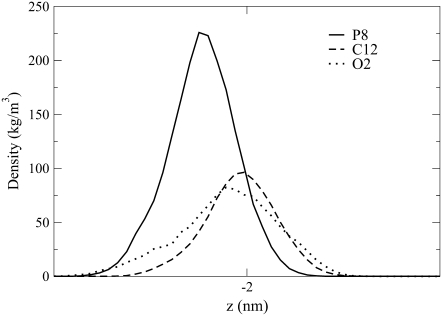
Since the POPG and the POPA headgroups each have at least one hydrogen bond donor and acceptor, hydrogen-bond formation may be an important factor in determining lipid behavior. Before calculating the hydrogen bonds, we examine the density profile for the glycerol O2 oxygen atom in the POPG headgroup to determine its location relative to the phosphate group. As is shown in Fig. 10, the O2 density profile peak value lies between that of the P atom and the adjoining carbon atom (C2).
FIGURE 10.
The most frequently observed position of the glycerol O2 oxygen atom in the POPG headgroup (Fig. 1) is located between the P atom and its neighboring carbon atom (C12).
Similarly, Zhao et al. (42) found that the POPG headgroup lies almost parallel to the membrane interface. Since the hydroxyl hydrogen atoms in the glycerol group reside near the phosphate groups, they could easily form hydrogen bonds with the phosphate and ester oxygen atoms.
POPA and POPC have eight oxygen atoms that are hydrogen-bond acceptors (O7, O9, O10, O11, O14, O16, O33, O35) and POPG has two additional acceptors (O1, O2). POPA has one hydroxyl hydrogen atom and POPG has two hydroxyl hydrogen atoms, hence both POPA and POPG lipids can form hydrogen bonds with themselves as well as with neighboring lipids. POPC may also serve as a hydrogen-bond donor by lending a hydrogen atom from one of the CHn groups to a neighboring oxygen atom. However, hydrogen bonds of this type are considerably weaker than the hydrogen bonds that form between hydroxyl hydrogen atoms and lipid oxygen atoms, and hence we do not consider them here (45,46). The criteria that we use for hydrogen-bond existence is that the distance between the hydrogen atom and the hydrogen-bond acceptor be <3.5 Å and the angle between the hydrogen atom, hydrogen bond donor, and hydrogen-bond acceptor be <30° (17,18).
The results in Table 3 show that the POPG lipids form a much larger number of both intra- and intermolecular hydrogen bonds than the POPA lipids. The PAGAUSS and the PAFFGMX bilayers only form hydrogen bonds at the phosphate oxygen atoms (Table 4). Table 5 shows that the lipids in the PGSALT bilayer form very similar percentages of hydrogen bonds at each of the three oxygen acceptor groups between themselves and neighboring lipids, where again the phosphate oxygen atoms participate in the largest number of hydrogen bonds. Since the two POPG glycerol hydroxyl groups are located so close to the four phosphate oxygen atoms, a large number of hydrogen-bond donors and acceptors are located within very close proximity. Similarly, Mukhopadhyay et al. (41) found that the amine group on the POPS lipid can form intra- and intermolecular hydrogen bonds with the phosphate group. The immiscibility of a 1,2-dimyristoyl-sn-glycero-3-phosphate (DMPA)/1,2 dihexadecanoyl-sn-glycerol-3-phosphocholine (DMPC) bilayer at a pH of 4 has been attributed to a reduction in the PA headgroup repulsion and an increase in the number of hydrogen bonds that form between the PA lipids (47). This finding highlights that the number of hydrogen bonds that we calculate for the POPA and POPG bilayers is only representative of bilayers that have the same environmental conditions as are used in our simulations.
TABLE 3.
The number of intra- and intermolecular hydrogen bonds that form in the PAGAUSS, PAFFGMX, and PGSALT bilayers during the 10 ns trajectory
| System | Number of H-bonds w/self | Number of H-bonds w/neighbors |
|---|---|---|
| PAGAUSS | 0 | 53 |
| PAFFGMX | 0 | 51 |
| PGSALT | 537 | 1455 |
TABLE 4.
The percentage of hydrogen bonds that form at the phosphate oxygen atoms (O7, O9, O10, O11) and at the ester oxygen atoms (O14, O16, O33, O35) in both the PAGAUSS and the PAFFGMX bilayers
| Oxygen atom | Location of H-bonds w/self (%) | Location of H-bonds w/neighbors (%) |
|---|---|---|
| Phosphate oxygens | 0 | 100 |
| Ester oxygens | 0 | 0 |
TABLE 5.
The percentage of hydrogen bonds that form at the glycerol oxygen atoms (O1, O2), at the phosphate oxygen atoms (O7, O9, O10, O11), and at the ester oxygen atoms (O14, O16, O33, O35) in the PGSALT bilayer
| Oxygen atom | Location of H-bonds w/self (%) | Location of H-bonds w/neighbors (%) |
|---|---|---|
| O1,O2 | 23.2 | 23.1 |
| Phosphate oxygens | 51.7 | 44.6 |
| Ester oxygens | 25.1 | 32.3 |
Bilayer area distribution
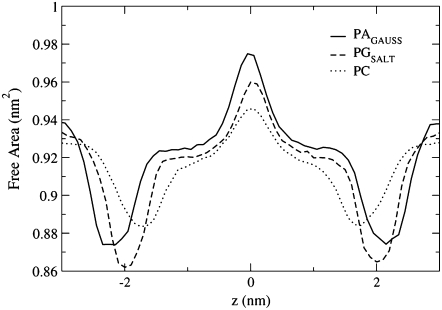
Even though lipids that spontaneously form bilayers have an overall cylindrical shape, the area that they occupy varies along the z axis as the lipid chemical composition changes from polar headgroups to hydrophobic acyl chains. As we saw in Fig. 3, POPG has a smaller area per lipid than POPC even though both have bulky headgroups, and that for the same salt concentration, the POPA and POPG area per lipid values are more similar than the POPG and POPC values. Hence, it appears that for these three lipids, the lipid charge makes a larger contribution to bilayer fluidity than the lipid shape. It has been observed using MD simulations and x-ray diffraction techniques that PS lipids, whose headgroups contain a carboxylate group, have structural properties that are similar to PE lipids (48,49). This shows that lipids with varying charge and headgroup compositions can have similar behavior under specific environmental conditions. The similarity in fluidity between POPA and POPG may indicate that despite one lipid being conical and the other being cylindrical, the distribution of their free space, which can be defined as the area that is not occupied by atoms, may be more similar than is seen for the POPC and POPG bilayers. To calculate the distribution of free area in the three bilayers, we use a method that has previously been described by Falck et al. (50). To calculate the free area, the location of each atom in the bilayer is mapped onto a grid every 100 ps. The grid contains 100 × 100 elements in the xy plane and the size of each element fluctuates slightly with system size for each time frame. In the z direction, the bilayer was divided into 0.1 nm slices. If any atom in the system is located within the van der Waals radius (1.2 Å for a H-atom) of a grid point, then that grid point is considered to be occupied. By finding the occupied grid points for a sequence of time frames in the trajectory, the average area profiles for each component in the system can be calculated (lipid, ions, water). Simultaneously, the location and number of nonoccupied grid spaces can be calculated and the summation of these grid points gives the free area.
Fig. 11 shows that the POPC bilayer has the most free area in the headgroup region, which correlates well with it having the largest fluidity. The figure also shows that at the minima, which correspond to the headgroups region, the PAGAUSS profile is wider than the PGSALT profile. This difference may be caused by the attractive interactions that POPA atom O7 shows for both the water molecules and the Na+ ions. Since atom O7 is located near the top of the POPA headgroup, the large number of molecules found in this region will increase the width of the minima profile. Also, since POPG forms a large number of intermolecular hydrogen bonds, this may reduce the width of the profile at the minima.
FIGURE 11.
The distribution of free area in the PAGAUSS, PGSALT, and PC bilayers, where the center of the bilayer is located at 0.0 nm. The free area curves have been normalized by the maximum number of nonoccupied grid points.
Mean-squared displacement
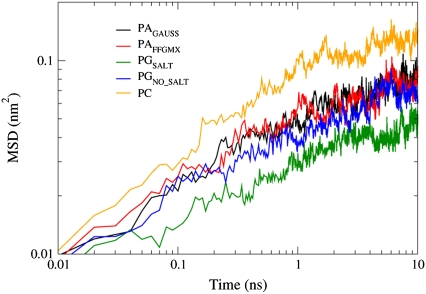
If we calculate the mean-squared displacement (MSD) of the lipids in the z direction, we can compare the vertical mobility between the anionically and neutrally charged lipids. Marrink and Mark (51) performed simulations on glycerolmonoolein bilayers and they found that when not subjected to an applied membrane tension, the bilayers had fluctuations that caused the average projected area to be smaller than the local surface area. However, when a surface tension was applied to the bilayers, the undulations were suppressed. Similarly, in a theoretically study by Pincus et al. (52), it was found that electrostatic interactions in a lipid bilayer suppress undulations. Fig. 12 shows that for the POPG and POPA bilayers, the MSD displacement along the z axis is more restricted than in the POPC bilayers. It therefore appears that having a membrane with negatively charged lipids reduces bilayer undulations in a manner that is similar to applying a surface tension.
FIGURE 12.
The MSD in the z direction.
Since the PC bilayer has the largest fluidity (largest Alipid, smallest bilayer thickness, and smallest order parameter values), it is not surprising that it has the largest MSD value. In comparing the PGSALT and the PGNO_SALT systems, we see that the MSD is reduced in the presence of a 150 mM salt solution. This salt-induced restriction is similar to the reduction seen in the POPG Alipid value in Fig. 3. Even though the PA bilayers appear to be the least fluid of the three lipid types (Fig. 3–5), they have larger MSD values than that of the PGSALT bilayer. As was shown in Tables 3–5, the POPG lipids form a significantly larger number of hydrogen bonds than the POPA lipids. The interactions between neighboring lipids may partially restrain the vertical mobility of the POPG lipids, which leads to reduced MSD values. Another unexpected trend seen in the MSD is the similarity between the PAGAUSS and PAFFGMX values. As has been seen in previous simulations, Na+ ions that are located near the ester carbonyl groups restrict the movement of the water molecules and carbonyl oxygen atoms (41). Hence, we might project that the PAFFGMX lipids would have a smaller vertical mobility than the POPA lipids in the PAGAUSS bilayer since the Na+ ions in the PAFFGMX system are located near the ester carbonyl groups (Fig. 6). However, the fluidity in the PAFFGMX bilayer is larger than that of the PAGAUSS bilayer. Hence, the combination of the PAFFGMX bilayer being restrained by Na+ ions and the PAGAUSS bilayer being more fluid than the PAFFGMX bilayer may cause the PA bilayers to have similar MSD values.
DISCUSSION
Even though nonbilayer lipids may prefer to exist in nonlamellar aggregates in solution, they naturally integrate into biological membranes with cylindrically shaped lipids. Their existence in lamellar biological membranes hints at their importance in promoting a resilient and functional bilayer, i.e., one that can effectively solvate transmembrane proteins and prevent unwanted small molecules from passing through the membrane. In this study, we examined how lipid headgroup size and charge contribute to the overall POPA, POPG, and POPC bilayer properties. POPA is a negatively charged lipid with a negative spontaneous curvature at physiological pH and salt concentration. POPG and POPC both have a zero spontaneous curvature, where POPG carries a negative charge at physiological pH, and POPC is neutral. The POPA lipids were simulated using two different sets of partial charges for the headgroup. The first set was calculated using the CHELPG method with Gaussian 03 (PAGAUSS) and the second set of partial charges were the same as those used for identical atoms in the POPC and POPG headgroups (PAFFGMX). Because the POPA and POPG lipids were negatively charged, these systems included counterions (Na+) and in addition, some systems contained a 150 mM NaCl solution.
We found that lipid fluidity for POPA, POPG, and POPC is dependent on the location of the Na+ ions relative to the water/membrane interface. For PAFFGMX, the POPG bilayers (with/without 150 mM NaCl), and the POPC bilayer, the most favorable location for the Na+ ions was near the ester carbonyl oxygen atoms, which is the same location that was seen in previous POPG and POPS simulations (23,41). When the POPG bilayer was in the presence of a 150 mM NaCl solution, an increase in lipid packing, decrease in Alipid, increase in acyl chain order parameters, and decrease in the z direction, MSD were seen when compared with the POPG system that did not contain NaCl. In the PAGAUSS system, the Na+ ions were highly localized near the phosphate group rather than the ester carbonyl oxygen atoms. This difference in Na+ ion location can be attributed to the varied charge distribution between the two POPA systems, where the phosphate group has a net charge of −1 for a PAFFGMX lipid and a net charge of −1.3 for a PAGAUSS lipid. In confining the Na+ ions to the phosphate group, the PAGAUSS lipids had a smaller area than the PAFFGMX lipids. We did not find experimental results with which to evaluate the accuracy of the two sets of partial charges. However, it has been shown that the spontaneous curvature of PA lipids is very sensitive to the local ionic environment (4). This suggests that since the Na+ ions in the PAGAUSS bilayer are located near the phosphate group, they would be more affected by small changes in ion concentration. During the 10-ns trajectory that was used for data analysis, we found that the POPA hydroxyl hydrogen atoms formed 52 ± 1 hydrogen bonds with the phosphate group oxygen acceptors in neighboring lipids in both POPA systems. Hence, the small PAGAUSS Alipid value can be attributed to strong interactions between the phosphate headgroup charge and the Na+ ions. One interesting effect of having the Na+ ions located near the phosphate group in PAGAUSS was that the upper acyl chain region (atoms C2-C4), which was constricted in the systems that had Na+ ions near the ester group, had order parameter values that were as small as the acyl chain-ends.
In the PAGAUSS, PAFFGMX, and POPG bilayers, the preferred interaction site for the water molecules was the phosphate group. In the POPC system, however, the water molecules were not only commonly found near the phosphate group, but also near the ester groups. The likelihood of finding a water molecule near a sn−2 carbonyl oxygen atom was three times larger for POPC than for either POPA or POPG. In a simulation study of POPG, Zhao et al. (42) found that counterions strongly adsorb to the bilayer interface, which results in reduced water dynamics. Hence, the existence of counterions in the POPA and POPG bilayers may cause the ester groups in these bilayers to be dehydrated compared to POPC. In a discussion on the impacts of hydration, electrostatics, and dispersion forces, Parsegian and Rand (53) found that counterions can replace water molecules residing near polar atoms in the bilayer interface when interacting with specific anionic lipids, such as PA and PS.
In conclusion, the lipid headgroup size, net charge, and distribution of partial charges are all important factors in determining bilayer behavior. POPG and POPC both have bulky headgroups; however, because POPG contains counterions in the water/membrane interface and can form intramolecular and intermolecular hydrogen bonds, its fluidity is smaller than that of POPC. The Na+ ions in the POPG and PAFFGMX bilayers prefer to reside near the ester carbonyl atoms, whereas in the PAGAUSS bilayer, the Na+ ions are located near the phosphate group. The POPG and PAFFGMX bilayers show surprisingly similar Alipid and acyl chain order parameter values compared to PAGAUSS. Therefore, under the system conditions and parameters that were set forth in the simulations, these fluidity properties are more strongly dependent on Na+ ion location than headgroup size.
Acknowledgments
We thank S. Deore for guidance on the partial charge calculations.
This work was partially supported by the National Institutes of Health-National Institute of General Medical Sciences through grant No. T32-GM08799. We gratefully acknowledge computer time at the Texas Advanced Computer Center (grant No. TG-MCB070076N). R.F. also acknowledges a generous endowment by Joe and Essie Smith.
Editor: Thomas J. McIntosh.
References
- 1.Lee, A. G. 2003. Lipid-protein interactions in biological membranes: a structural perspective. Biochim. Biophys. Acta. 1612:1–40. [DOI] [PubMed] [Google Scholar]
- 2.Alberts, B., A. Johnson, J. Lewis, M. Raff, K. Roberts, and P. Walter. 2002. Molecular Biology of the Cell, 4th Ed. Garland Science Textbooks, New York.
- 3.Lee, A. G. 2004. How lipids affect the activities of integral membrane proteins. Biochim. Biophys. Acta. 1666:62–87. [DOI] [PubMed] [Google Scholar]
- 4.Cambrea, L. R., and J. S. Hovis. 2007. Formation of three-dimensional structures in supported lipid bilayers. Biophys. J. 92:3587–3594. [DOI] [PMC free article] [PubMed] [Google Scholar]
- 5.Rand, R. P., N. Fuller, V. A. Parsegian, and D. C. Ras. 1988. Variation in hydration forces between neutral phospholipid bilayers—evidence for hydration attraction. Biochemistry. 27:7711–7722. [DOI] [PubMed] [Google Scholar]
- 6.Killian, J. A., B. de Kruijff, and E. van den Brink-van der Laan. 2004. Nonbilayer lipids affect peripheral and integral membrane proteins via changes in the lateral pressure profile. Biochim. Biophys. Acta. 1666:275–288. [DOI] [PubMed] [Google Scholar]
- 7.Cullis, P. R., and B. de Kruijff. 1979. Lipid polymorphism and the functional roles of lipids in biological membranes. Biochim. Biophys. Acta. 559:399–420. [DOI] [PubMed] [Google Scholar]
- 8.Kooijman, E. E., V. Chupin, N. L. Fuller, M. M. Kozlov, B. de Kruijif, K. N. J. Burger, and P. R. Rand. 2005. Spontaneous curvature of phosphatidic acid and lysophosphatidic acid. Biochemistry. 44:2097–2102. [DOI] [PubMed] [Google Scholar]
- 9.daCosta, C., A. Ogrel, E. McCardy, M. Blanton, and J. Baezinger. 2002. Lipid-protein interactions at the nicotinic acetylcholine receptor. J. Biol. Chem. 277:201–208. [DOI] [PubMed] [Google Scholar]
- 10.Wenz, J., and F. Barrantes. 2005. Nicotinic acetylcholine receptor induces lateral segregation of phosphatidic acid and phosphatidylcholine in reconstituted membranes. Biochemistry. 44:398–410. [DOI] [PubMed] [Google Scholar]
- 11.Sunshine, C., and M. McNamee. 1992. Lipid modulation of nicotinic acetylcholine receptor function: the role of neutral and negatively charged lipids. Biochim. Biophys. Acta Biomembr. 1108:240–246. [DOI] [PubMed] [Google Scholar]
- 12.Poveda, J. A., J. A. Encinar, A. M. Fernandez, C. R. Mateo, J. A. Ferragut, and J. M. Gonzalez-Ros. 2002. Segregation of phosphatidic acid-rich domains in reconstituted acetylcholine receptor membranes. Biochemistry. 41:12253–12262. [DOI] [PubMed] [Google Scholar]
- 13.van den Brink-van der Laan, E., J. Killian, and B. de Kruijff. 2004. Nonbilayer lipids affect peripheral and integral membrane proteins via changes in the lateral pressure profile. Biochim. Biophys. Acta. 1666:275–288. [DOI] [PubMed] [Google Scholar]
- 14.Luan, P., L. Yang, and M. Glaser. 1995. Formation of membrane domains created during the budding of vesicular stomatitis virus. A model for selective lipid and protein sorting in biological membranes. Biochemistry. 34:9874–9883. [DOI] [PubMed] [Google Scholar]
- 15.Shoemaker, S. D., and T. K. Vanderlick. 2002. Intramembrane electrostatic interactions destabilize lipid vesicles. Biophys. J. 83:2007–2014. [DOI] [PMC free article] [PubMed] [Google Scholar]
- 16.Cevc, G. 1990. Membrane electrostatics. Biochim. Biophys. Acta. 1031:311–382. [DOI] [PubMed] [Google Scholar]
- 17.Lindahl, E., B. Hess, and D. van der Spoel. 2001. GROMACS 3.0: a package for molecular simulation and trajectory analysis. J. Mol. Model. 7:306–317. [Google Scholar]
- 18.Berendsen, H. J. C., D. van der Spoel, and R. van Drunen. 1995. GROMACS: a message-passing parallel molecular dynamics implementation. Comput. Phys. Commun. 91:43–56. [Google Scholar]
- 19.van der Spoel, D., E. Lindahl, B. Hess, G. Groenhof, A. E. Mark, and H. J. C. Berendsen. 2005. GROMACS: fast, flexible and free. J. Comput. Chem. 26:1701–1718. [DOI] [PubMed] [Google Scholar]
- 20.Berger, O., O. Edholm, and F. Jahnig. 1997. Molecular dynamics simulations of a fluid bilayer of dipalmitoylphosphatidylcholine at full hydration, constant pressure, and constant temperature. Biophys. J. 72:2002–2013. [DOI] [PMC free article] [PubMed] [Google Scholar]
- 21.van Gunsteren, W. F., P. Kruger, S. R. Billeter, A. E. Mark, A. A. Eising, W. R. P. Scott, P. H. Hunenberger, and I. G. Tironi. 1996. Biomolecular Simulation: The GROMOS 96 Manual and User Guide. vdf Hochschulverlag AG an der ETH Zürich and BIOMOS b.v.: Zürich, Groningen.
- 22.Tieleman, D. P., M. S. Sansom, and H. J. Berendsen. 1999. Alamethicin helices in a bilayer and in solution: molecular dynamics simulations. Biophys. J. 76:40–49. [DOI] [PMC free article] [PubMed] [Google Scholar]
- 23.Elmore, D. 2006. Molecular dynamics simulation of a phosphatidylglycerol membrane. FEBS Lett. 580:144–148. [DOI] [PubMed] [Google Scholar]
- 24.Frisch, M. J., G. W. Trucks, H. B. Schlegel, G. E. Scuseria, M. A. Robb, J. R. Cheeseman, J. A. Montgomery, Jr., T. Vreven, K. N. Kudin, J. C. Burant, J. M. Millam, S. S. Iyengar, J. Tomasi, V. Barone, B. Mennucci, M. Cossi, G. Scalmani, N. Rega, G. A. Petersson, H. Nakatsuji, M. Hada, M. Ehara, K. Toyota, R. Fukuda, J. Hasegawa, M. Ishida, T. Nakajima, Y. Honda, O. Kitao, H. Nakai, M. Klene, X. Li, J. E. Knox, H. P. Hratchian, J. B. Cross, V. Bakken, C. Adamo, J. Jaramillo, R. Gomperts, R. E. Stratmann, O. Yazyev, A. J. Austin, R. Cammi, C. Pomelli, J. W. Ochterski, P. Y. Ayala, K. Morokuma, G. A. Voth, P. Salvador, J. J. Dannenberg, V. G. Zakrzewski, S. Dapprich, A. D. Daniels, M. C. Strain, O. Farkas, D. K. Malick, A. D. Rabuck, K. Raghavachari, J. B. Foresman, J. V. Ortiz, Q. Cui, A. G. Baboul, S. Clifford, J. Cioslowski, B. B. Stefanov, G. Liu, A. Liashenko, P. Piskorz, I. Komaromi, R. L. Martin, D. J. Fox, T. Keith, M. A. Al-Laham, C. Y. Peng, A. Nanayakkara, M. Challacombe, P. M. W. Gill, B. Johnson, W. Chen, M. W. Wong, C. Gonzalez, and J. A. Pople. 2004. Gaussian 03, Rev. C.02. Gaussian, Wallingford, CT.
- 25.Berendsen, H. J. C., J. P. M. Postma, W. F. van Gunsteren, and J. Hermans. 1981. Interaction models for water in relation to protein hydration. In Intermolecular Forces. B. Pullman, editor. Reidel, Dordrecht, The Netherlands.
- 26.Berendsen, H. J. C., J. P. M. Postma, W. F. van Gunsteren, A. DiNola, and J. R. Haak. 1984. Molecular dynamics with coupling to an external bath. J. Chem. Phys. 81:3684–3690. [Google Scholar]
- 27.Hess, B., H. Bekker, H. J. C. Berendsen, and J. G. E. M. Fraaije. 1997. LINCS: a linear constraint solver for molecular simulations. J. Comput. Chem. 18:1463–1472. [Google Scholar]
- 28.Essman, U., L. Perela, M. L. Berkowitz, H. L. T. Darden, and L. G. Pedersen. 1995. A smooth particle mesh Ewald method. J. Chem. Phys. 103:8577–8592. [Google Scholar]
- 29.Demel, R. A., C. C. Yin, B. Z. Lin, and H. Hauser. 1992. Monolayer characteristics and thermal behavior of phosphatidic acids. Chem. Phys. Lipids. 60:209–223. [DOI] [PubMed] [Google Scholar]
- 30.Boggs, J. M., and B. Tümmler. 1993. Interdigitated gel phase bilayers formed by unsaturated synthetic and bacterial glycerolipids in the presence of polymyxin B and glycerol. Biophys. J. 1145:42–50. [DOI] [PubMed] [Google Scholar]
- 31.Seelig, J., and N. Waespe-Sarcevic. 1978. Molecular order in cis and trans unsaturated phospholipid bilayers. Biochemistry. 17:3310–3315. [DOI] [PubMed] [Google Scholar]
- 32.Böckmann, R. A., A. Hac, T. Heimburg, and H. H. Grubmüller. 2003. Effect of sodium chloride on a lipid bilayer. Biophys. J. 85:1647–1655. [DOI] [PMC free article] [PubMed] [Google Scholar]
- 33.Pandit, S. A., D. Bostick, and M. L. Berkowitz. 2003. Molecular dynamics simulation of a dipalmitoylphosphatidylcholine bilayer with NaCl. Biophys. J. 84:3743–3750. [DOI] [PMC free article] [PubMed] [Google Scholar]
- 34.Patra, M., E. Salonen, E. Terama, I. Vattulainen, R. Faller, B. W. Lee, J. Holopainen, and M. Karttunen. 2006. Under the influence of alcohol: the effect of ethanol and methanol on lipid bilayers. Biophys. J. 90:1121–1135. [DOI] [PMC free article] [PubMed] [Google Scholar]
- 35.Chiu, S. W., E. Jakobsson, S. Subramanian, and H. L. Scott. 1999. Combined Monte Carlo and molecular dynamics simulation for fully hydrated dioleyl and palmitoyl-oleyl phosphatidylcholine lipid bilayers. Biophys. J. 77:2462–2469. [DOI] [PMC free article] [PubMed] [Google Scholar]
- 36.Claessens, M. M. A. E., F. A. M. Leermakers, F. A. Hoekstra, and M. A. C. Stuart. 2007. Opposing effects of cation binding and hydration on the bending rigidity of anionic lipid bilayers. J. Phys. Chem. B. 111:7127–7132. [DOI] [PubMed] [Google Scholar]
- 37.Cheng, M. H., L. T. Liu, A. C. Saladino, Y. Xu, and P. Tang. 2007. Molecular dynamics simulations of ternary membrane mixture: phosphatidylcholine, phosphatidic acid, and cholesterol. J. Chem. Phys. B. 111:14186–14192. [DOI] [PMC free article] [PubMed] [Google Scholar]
- 38.Marsh, D. 1996. Lateral pressure in membranes. Biochim. Biophys. Acta. 1286:183–223. [DOI] [PubMed] [Google Scholar]
- 39.Harlos, K., H. Eibl, I. Pascher, and S. Sundell. 1984. Conformation and packing properties of phosphatidic acid: the crystal structure of monosodium dimyristoylphosphatidate. Chem. Phys. Lipids. 34:115–126. [Google Scholar]
- 40.Murzyn, K., T. Rog, and M. Pasenkiewicz-Gierula. 2005. Phosphatidylethanolamine-phosphatidylglycerol bilayer as a model of the inner bacterial membrane. Biophys. J. 88:1091–1103. [DOI] [PMC free article] [PubMed] [Google Scholar]
- 41.Mukhopadhyay, P., L. Monticelli, and D. P. Tieleman. 2004. Molecular dynamics simulation of a palmitoyl-oleoyl phosphatidylserine bilayer with Na+ counterions and NaCl. Biophys. J. 86:1601–1609. [DOI] [PMC free article] [PubMed] [Google Scholar]
- 42.Zhao, W., T. Rog, A. A. Gurtovenko, I. Vattulainen, and M. Karttunen. 2007. Atomic-scale structure and electrostatics of anionic palmitoyloleoylphosphatidylglycerol lipid bilayers with Na+ counterions. Biophys. J. 92:1114–1124. [DOI] [PMC free article] [PubMed] [Google Scholar]
- 43.Murzyn, K., W. Zhao, M. Kartunnen, M. Kurdziel, and T. Rog. 2006. Dynamics of water at membrane surfaces: Effect of headgroup structure. Biointerphases. 1:98–105. [DOI] [PubMed] [Google Scholar]
- 44.Marshl, R. J., L. H. Scott, S. Subramaniam, and E. Jakobsson. 2001. Molecular simulation of dioleoylphosphatidylcholine lipid bilayers at differing levels of hydration. Biophys. J. 81:3005–3015. [DOI] [PMC free article] [PubMed] [Google Scholar]
- 45.Gu, Y., T. Kar, and S. Scheiner. 1999. Fundamental properties of the CH-O interaction: is it a true hydrogen bond? J. Am. Chem. Soc. 121:9411–9422. [Google Scholar]
- 46.Pandit, S. A., D. Bostick, and M. L. Berkowitz. 2003. Mixed bilayer containing dipalmitoylphosphatidylcholine and dipalmitoylphosphatidylserine: lipid complexation, ion binding, and electrostatics. Biophys. J. 85:3120–3131. [DOI] [PMC free article] [PubMed] [Google Scholar]
- 47.Garidel, P., C. Johann, and A. Blume. 1997. Nonideal mixing and phase separation in phosphatidylcholine phosphatidic acid mixtures as a function of acyl chain length and pH. Biophys. J. 72:2196–2210. [DOI] [PMC free article] [PubMed] [Google Scholar]
- 48.Pandit, S. A., and M. L. Berkowitz. 2002. Molecular dynamics simulation of dipalmitoylphosphatidylserine bilayer with Na counterions. Biophys. J. 82:1818–1827. [DOI] [PMC free article] [PubMed] [Google Scholar]
- 49.Petrache, H. I., S. Tristam-Nagle, K. Gawrisch, D. Harries, V. A. Parsegian, and J. F. Nagle. 2004. Structure and fluctuations of charged phosphatidylserine bilayers in the absence of salt. Biophys. J. 86:1574–1586. [DOI] [PMC free article] [PubMed] [Google Scholar]
- 50.Falck, E., M. Patra, M. Karttunen, M. T. Hyvönen, and I. Vattulainen. 2004. Lessons of slicing membranes: interplay of packing, free area, and lateral diffusion in phospholipid/cholesterol bilayers. Biophys. J. 87:1076–1091. [DOI] [PMC free article] [PubMed] [Google Scholar]
- 51.Marrink, S. J., and A. E. Mark. 2001. Effect of undulations on surface tension in simulated bilayers. J. Phys. Chem. 105:6122–6127. [Google Scholar]
- 52.Pincus, P., J. Joanny, and D. Andelman. 1990. Electrostatic interactions, curvature elasticity, and steric repulsion in multimembrane systems. Biophys. Lett. 15:763–768. [Google Scholar]
- 53.Parsegian, V. A., and R. P. Rand. 1983. Membrane interaction and deformation. Ann. N. Y. Acad. Sci. 416:1–12. [DOI] [PubMed] [Google Scholar]


