

Abstract
The purpose of the present study was to characterize in detail the 24 h blood pressure (BP) phenotype of mice lacking the gene for endothelial nitric oxide synthase (eNOS−/−) and the corresponding control strain (C57Bl/6J). Twenty-four hour BP recordings were made in conscious 12- to 16-week-old male mice 10 days following the implantation of a BP telemeter (n = 9 per group). The BP and heart rate of both strains were markedly affected by brief locomotor activity cycles, resulting in bimodal distributions of BP and heart rate within both light and dark periods. Data from active periods were associated with the higher of the two modes, whereas data from inactive periods were associated with the lower of the two modes. In eNOS−/− mice, the 24 h average BP level was significantly elevated (+15 %, 104 ± 2 vs. 119 ± 1 mmHg), as was its daily range (+44 %), its coefficient of variation (+26 %), dark-light difference (+48 %), and the separation of the two modes of its distribution (+41 %). Pulse pressure was also significantly greater (+23 %) in eNOS−/− mice. The 24 h heart rate level did not differ between control and eNOS−/− mice. Considerable variation was noted among previously published values of BP in eNOS−/− mice, but not in the corresponding control mice. Our results indicate that eNOS−/− mice have mild hypertension that is accompanied by more pronounced increases in BP lability and/or reactivity. Our results also demonstrate a marked effect of locomotor activity on BP in mice, which may confound short-term measurements of BP.
In recent years, the ability to produce highly targeted genetic alterations in mice has led to the possibility of testing the role of individual genes and gene products in blood pressure control. Although assessment of blood pressure in small animals such as mice requires new approaches and instrumentation, investigators and manufacturers have responded accordingly. Measurement of blood pressure by catheter in anaesthetized mice and by tail-cuff, chronic catheter and telemetry in conscious mice is now common. Nevertheless, as the influence of single genes (and the interaction of multiple genes) on blood pressure may often be subtle, full exploitation of knockout and transgenic mouse models in blood pressure research will require further advances in mouse blood pressure ‘phenotyping’ methods. Issues that remain poorly understood include the general characteristics of mouse blood pressure, how best to describe them, and the factors that may influence blood pressure and blood pressure measurements in mice. The need for such basic information is well illustrated by a recent publication in which mouse blood pressure was shown to be markedly affected by simple factors such as ambient temperature and food intake (Williams et al. 2002). To improve our understanding of mouse blood pressure and our ability to describe it comprehensively, the main purpose of the present study was to characterize blood pressure over a 24 h period in mice. To this end, we used the method of blood pressure telemetry (Carlsson & Wyss, 2000; Mills et al. 2000; Van Vliet et al. 2000; Butz & Davisson, 2001), which permitted the continuous measurement of blood pressure in conscious mice residing in their usual environment (i.e. usual cage and room) without the potential complications introduced by physical restraint, the presence of an investigator or recent anaesthesia or surgery.
Two strains of mice were selected for use in the study so that detailed aspects of their blood pressure phenotypes could be compared. These strains were C57Bl/6J mice and mice with a targeted deletion of the gene for endothelial nitric oxide synthase (eNOS−/−mice). The C57Bl/6 strain was selected because it is the most widely used inbred mouse strain (according to our supplier, Jackson Laboratories) and is therefore widely investigated and its characteristics are well documented. In addition, this strain is frequently used in cardiovascular research, has only a single copy of the renin gene (Wang et al. 2002) and is the appropriate control strain for the knockout mice also used in this study (see Methods). The eNOS−/− strain was selected for study in part because of the important role played by eNOS in cardiovascular physiology and pathophysiology. Not only is eNOS affected by cardiovascular disease, but also polymorphisms in the eNOS gene may contribute to the aetiology of several cardiovascular conditions including hypertension (Wattanapitayakul et al. 2001). More importantly, however, the blood pressure phenotype of this important knockout model has not been adequately determined. Although eNOS−/− mice have consistently been shown to have hypertension (Huang et al. 1995; Shesely et al. 1996, 2001; Gödecke et al. 1998; Kurihara et al. 1998; Stauss et al. 1999; Yang et al. 1999; Brandes et al. 2000; Duplain et al. 2001; Beierwaltes et al. 2002), there is little consensus on the severity of the blood pressure phenotype in this knockout model (mean blood pressure from 100 to 153 mmHg, or 107 to 169 % of the wild type). These previous estimates of blood pressure in eNOS−/− mice have been based on relatively brief recordings of blood pressure by catheter in mice under anaesthesia, or shortly after recovery from anaesthesia, and by tail-cuff in restrained conscious mice. Telemetry has not previously been used to assess blood pressure in eNOS−/− mice, and the 24 h profile of blood pressure has not been described, despite the possibility of a role for nitric oxide in circadian variations of blood pressure (Witte et al. 1995) and the report of increased variability of blood pressure in eNOS−/− mice in short-term recordings (Stauss et al. 1999).
During the course of this study it became apparent that locomotor activity cycles had an important effect on the blood pressure level. Indeed, activity appeared to be the major factor affecting the blood pressure level over the course of the day. Because such a pronounced effect is clearly relevant to our understanding of blood pressure and blood pressure measurement in this species, a third goal adopted during the course of the study was to describe and quantify the impact of locomotor activity cycles on blood pressure in mice.
Methods
General
Mice were maintained on a 12 h light–dark cycle (lights from 08.00 to 20.00 h), and fed a Prolab RMH 3000 rodent chow containing 0.26 % Na+, 0.91 % K+, 0.44 % Cl−, 22.5 % protein and 6.4 % fat. Experiments were performed in accordance with Institutional guidelines, and protocols were approved by the Memorial University of Newfoundland President's Animal Care Committee.
Breeding
Mice used in this study were the first- or second-generation male offspring of homozygote crosses of eNOS-deficient (eNOS−/−, B6.129P2-Nos3tm1Unc, stock no. 002684) or C57 control (eNOS+/+, C57BL/6J, stock no. 000664) mice obtained from Jackson Laboratories. The breeding colonies were maintained at 25–26 °C. The eNOS−/− mouse strain we used was originally produced by Shesely et al. (1996). Jackson Laboratories backcrossed this eNOS−/− strain to the C57Bl/6J strain eight times (which should bring the strains to homogeneity at 99.6 % of loci except for those of eNOS and linked genes) before establishing production colonies maintained by homozygote crosses. Each group of nine mice investigated was obtained from the first or second litter of a total of five mothers.
Experimental protocol
Offspring were weaned at 4 weeks of age and were moved to a recording room at 6 weeks of age. The recording room was maintained at 21–22 °C, and had a radio turned on at a low volume to reduce the impact of environmental noise. Mice were housed individually at 9–12 weeks of age, and underwent implantation of a telemeter (D.S.I. model TA11PA-C20) 2 weeks later (day 0; see below). Mice were returned to the recording room within 48 h of telemeter implantation with telemeters turned off. The implanted telemeter was activated on the morning of the 10th day, and the mice were left undisturbed for at least 48 h while their blood pressure was recorded. The second 24 h period was used for analysis of telemetered haemodynamics (i.e. day 11). On day 12, recordings continued while mice were treated with 5 % dextrose (2 ml kg−1i.p.), followed 2 h later by Nω-nitro-l-arginine methyl ester hydrochloride (l-NAME, 50 mg kg−1i.p., in 5 % dextrose, 2 ml kg−1). On the 13th day, mice were anaesthetized with a single intramuscular injection of a mixture of ketamine (90 mg kg−1) and xylazine (10 mg kg−1). Under deep anaesthesia, the chest was opened and the position of the telemeter tip was determined relative to the junction of the left carotid artery with the arch of the aorta. The telemeter was then removed and recalibrated.
Telemetry
Under ketamine and xylazine anaesthesia (90 and 10 mg kg−1, respectively), the tip of the telemeter catheter was inserted into the aortic arch via the left carotid artery, with the telemeter body positioned subcutaneously on the right flank (Butz & Davisson, 2001). Only a single dose of anaesthetic was required for the procedure. Direct inspection of the placement of the catheter at the end of the experiment revealed that all catheter tips were positioned between 0 and 1.5 mm into the aortic arch, relative to the origin of the left carotid artery. There was no relationship between the position of the catheter tip and the recorded pulse pressure. Telemeter calibration was performed following explantation and recorded blood pressure values were corrected for any drift in calibration that may have occurred (Van Vliet et al. 2000). The telemeter signal was processed using the following D.S.I. equipment: a model RLA1020 receiver, a 20 channel data exchange matrix, an APR-1 ambient pressure monitor and a DataQuest ART Silver 2.1 acquisition system. At 30 s intervals, the system was set to sample the mean, systolic and diastolic blood pressure and heart rate at 500 Hz for 3 s, and record their average values.
Analysis of activity data
The total number of activity counts reported by the telemetry system over each 30 s sample period was also recorded and used as an index of locomotor activity. Examination of activity data showed that it consisted largely of 0 values, and that the distribution of values > 0 was highly skewed to the right (e.g. Fig. 1). Use of a log or square-root transform (0.1 was added to each sample in the case of the log transform to avoid calculations involving the log of 0) resulted in an approximately normal distribution of activity values > 0 as judged both by eye and by the A2 statistic of the Anderson-Darling normality test (reduced from ∼47 to ∼16), although the distributions remained significantly different from a normal distribution. Because of these considerations, we used the following indices to describe activity levels. First, we calculated the ‘inactive time’, the percentage of activity samples with a value of 0. Second, we calculated the mean activity level (mean of all activity samples). Third, we report the mean of activity values > 0 (i.e. the mean of the distribution of values > 0). Finally, we also report the mean of the log of activity values > 0.
Figure 1. Distribution of 24 h activity values in a control mouse (W19).
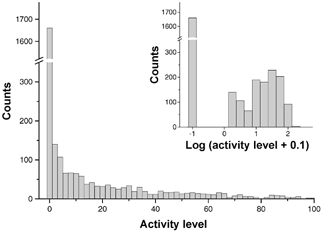
The distribution contains a large number of counts at activity = 0, and is highly skewed for values above 0. As shown in the inset, the distribution of values above 0 becomes more normal following logarithmic transformation (log (activity + 0.1)).
In addition to describing activity levels, we also used activity values to distinguish blood pressure samples that were associated with periods of activity and inactivity. For this purpose, we separated blood pressure samples on the basis of the activity level recorded during the same sample period: blood pressure samples associated with activity were defined as those for which the corresponding activity value was > 0, and blood pressure samples associated with inactivity were defined as those for which the corresponding activity level was equal to 0.
General statistics and analysis
Frequency distributions were constructed using a bin width of 2 mmHg in the case of mean arterial pressure (MAP) and 10 beats min−1 in the case of heart rate. The modes of each distribution were determined by eye. The range of each distribution was calculated as the difference between the 1st and 99th percentiles of the distribution. The variability of an individual's MAP or heart rate over a 12 or 24 h period was assessed in terms of the variation coefficient (the standard deviation for the period expressed as a percentage of the mean for the period). Differences between two means were evaluated using Student's t test for paired and unpaired data as appropriate. Data are expressed as the mean ± s.e.m.P < 0.05 was used as the limit of statistical significance.
Results
Blood pressure level
Table 1 lists the mean blood pressure and heart rate values determined during the 12 h light, 12 h dark and total 24 h periods, and the calculated differences between the dark and light period values. Relative to control mice, eNOS−/− mice exhibited a 15 % higher 24 h average MAP (Fig. 2, Table 1). The degree of elevation of blood pressure varied among different measurements and according to the period of the day, ranging from an 11 % higher diastolic pressure during the light period to an 18 % higher systolic pressure during the dark period (Table 1). Pulse pressure was also significantly higher by 21 % (12 h light period) to 26 % (12 h dark period; Fig. 2, Table 1).
Table 1.
Summary of basic haemodynamics and activity for eNOS-knockout mice (eNOS−/−) and their control strain (C57)
| Period | Variable | C57 | eNOS−/− | eNOS/C57 ratio | P value |
|---|---|---|---|---|---|
| 24 h | SAP(mmHg) | 119 ± 2 | 138 ± 2 | 1.16 | < 0.001 |
| MAP(mmHg) | 104 ± 2 | 119 ± 1 | 1.15 | < 0.001 | |
| DAP (mmHg) | 87 ± 2 | 99 ± 2 | 1.14 | < 0.001 | |
| PP(mmHg) | 31.6 ± 1.5 | 38.9 ± 1.7 | 1.23 | 0.005 | |
| HR (beats min−1) | 591 ± 6 | 595 ± 6 | 1.01 | ns (0.626) | |
| Inactive time (%) | 63 ± 2 | 62 ± 1 | 0.97 | ns (0.447) | |
| Mean activity (a.u.) | 10.4 ± 1.3 | 11.6 ± 0.9 | 1.12 | ns (0.476) | |
| Mean (activity > 0) (a.u.) | 27.8 ± 2.3 | 30.2 ± 1.9 | 1.09 | ns (0.434) | |
| Mean log (activity > 0) | 1.20 ± 0.03 | 1.24 ± 0.03 | 1.04 | ns (0.333) | |
| Light period | SAP (mmHg) | 112 ± 2 | 128 ± 2 | 1.14 | < 0.001 |
| MAP (mmHg) | 97 ± 1 | 109 ± 2 | 1.12 | < 0.001 | |
| DAP (mmHg) | 81 ± 2 | 90 ± 2 | 1.11 | 0.004 | |
| PP (mmHg) | 31.5 ± 1.5 | 38.0 ± 1.6 | 1.21 | 0.010 | |
| HR (beats min−1) | 556 ± 7 | 556 ± 7 | 1.00 | ns (0.983) | |
| Inactive time (%) | 80 ± 1 | 78 ± 1 | 0.97 | ns (0.172) | |
| Mean activity (a.u.) | 3.1 ±0.4 | 3.8 ± 0.4 | 1.21 | ns (0.257) | |
| Mean (activity > 0) (a.u.) | 15.7 ±1.0 | 18.2 ± 1.6 | 1.16 | ns (0.199) | |
| Mean log (activity > 0) | 0.96 ± 0.03 | 1.02 ± 0.03 | 1.06 | ns (0.192) | |
| Dark period | SAP (mmHg) | 125 ±3 | 148 ± 2 | 1.18 | < 0.001 |
| MAP (mmHg) | 110 ±3 | 128 ± 1 | 1.17 | < 0.001 | |
| DAP (mmHg) | 94 ± 2 | 108 ± 2 | 1.16 | < 0.001 | |
| PP(mmHg) | 31.7 ±1.5 | 39.9 ± 1.8 | 1.26 | 0.003 | |
| HR (beats min%1) | 625 ± 9 | 634 ± 7 | 1.01 | ns (0.983) | |
| Inactive time (%) | 46 ± 3 | 45 ± 2 | 0.97 | ns (0.748) | |
| Mean activity (a.u.) | 17.7 ±2.6 | 19.4 ±1.7 | 1.09 | ns (0.601) | |
| Mean (activity > 0) (a.u.) | 31.8 ±2.8 | 34.9 ± 2.3 | 1.10 | ns (0.406) | |
| Mean log (activity > 0) | 1.28 ± 0.04 | 1.33 ± 0.03 | 1.04 | ns (0.331) | |
| Dark-light difference | SAP (mmHg) | 13.3 ± 1.7 | 20.3 ± 1.8 | 1.53 | 0.012 |
| MAP (mmHg) | 13.0 ±1.4 | 19.3 ± 1.6 | 1.48 | 0.011 | |
| DAP (mmHg) | 13.1±1.2 | 18.5±1.4 | 1.41 | 0.010 | |
| PP(mmHg) | 0.2±0.7 | 1.8±0.5 | 7.63 | ns (0.078) | |
| HR (beats min−1) | 69 ±9 | 77 ± 7 | 1.12 | ns(0.491) |
a.u., arbitrary units; DAP, diastolic arterial pressure; HR, heart rate; MAP, mean arterial pressure; PP, pulse pressure; SAP, systolic arterial pressure, ns, not significant.
Figure 2. Comparison of the main 24 h haemodynamic parameters in eNOS-knockout (−/−) and control (+/+) mice.
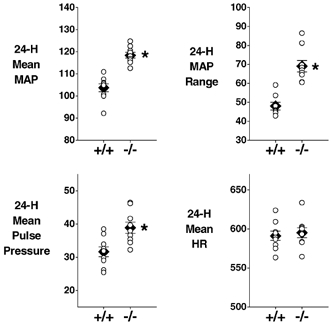
The mean (±s.e.m.) value for each group is represented by a filled diamond. Values from individual mice are represented by open circles. *Significant difference between the two groups. MAP, mean arterial pressure (mmHg); HR, heart rate (beats min−1). (Mean pulse pressure, mmHg.) n = 9 per group.
Contribution of body weight to the elevated blood pressure in eNOS−/− mice
The body weight of eNOS−/− mice was significantly less than that of control mice, both at the time of telemeter implantation (23.2 ± 0.8 g versus 27.3 ± 0.4 g, P = 0.001) and at the time of telemeter retrieval (22.9 ± 0.9 g versus 26.3 ± 0.4 g, P = 0.004). The lighter weight of eNOS−/− mice is consistent with previous reports for this knockout strain (Shesely et al. 1996). To determine whether the higher blood pressure level of eNOS−/− mice was associated with their lower body weight, we performed multiple regressions of 24 h MAP versus genotype and body weight. Although genotype was a highly significant predictor of MAP (P < 0.001), the contribution of body weight was not significant (P = 0.595 in the case of body weight at telemeter harvest and P = 0.178 in the case of body weight at telemeter implantation). Furthermore, the sign of the body weight regression terms was positive, indicating that within a given genotype, increases in body weight, not decreases, would tend to be associated with higher MAP levels.
Distribution of blood pressure values and the effect of locomotor activity
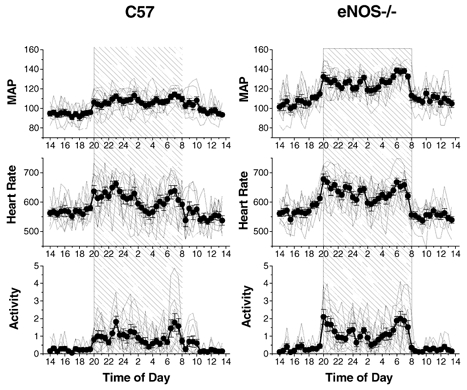
Values of MAP sampled over the 24 h period were distributed bimodally in all mice (Fig. 3, Table 2). The occurrence of two modes was not a consequence of circadian variation in MAP, since bimodal distributions were also apparent for individual 12 h light (9/9 control and 8/9 eNOS−/− mice) and 12 h dark (8/9 control and 7/9 eNOS−/− mice) periods (Fig. 3). The presence of two modes appeared to be attributable to short locomotor activity cycles that occurred within the 12 h light and 12 h dark periods and were accompanied by marked fluctuations in blood pressure and heart rate (Fig. 4). Such cycles occurred 6–11 times during the light period (9.2 ± 0.5 times in control and 7.4 ± 0.5 times in eNOS−/− mice) and 3–10 times during the dark period (5.6 ± 0.6 times in control and 6.6 ± 0.7 times in eNOS−/− mice). A link between the bimodal MAP distribution and locomotor activity cycles was confirmed by plotting the distribution of MAP values associated with periods of activity and inactivity. As illustrated in Fig. 3, the first (lower) mode of the MAP distribution was chiefly composed of MAP samples for which the corresponding activity signal was 0 (continuous line, Fig. 3), and the second (higher) mode was chiefly composed of MAP samples for which the corresponding activity signal value was > 0 (dashed lines, Fig. 3). The modes of the 24 h MAP distributions associated with activity (116 ± 2 mmHg in C57 mice and 137 ± 2 mmHg in eNOS−/− mice) and inactivity (90 ± 1 mmHg in C57 mice and 103 ± 2 mmHg in eNOS−/− mice) closely resembled the low and high modes of the overall 24 h MAP distribution given in Table 2. This was also generally true for the 12 h light (active: 112 ± 2 mmHg in C57 mice and 132 ± 2 mmHg in eNOS−/− mice; inactive: 90 ± 1 mmHg in C57 mice and 99 ± 2 mmHg in eNOS−/− mice) and 12 h dark periods (active: 118 ± 3 mmHg in C57 mice and 137 ± 2 mmHg in eNOS−/− mice; inactive: 100 ± 3 mmHg in C57 mice and 114 ± 5 mmHg in eNOS−/− mice), although the accuracy of these modes appeared to be severely reduced due to the smaller number of points used in these distributions (e.g. compared with the 2880 MAP samples in each 24 h data set, as few as 233 samples were associated with activity during the 12 h light period).
Figure 3. Distributions of MAP in a control (left) and an eNOS-knockout mouse (right).
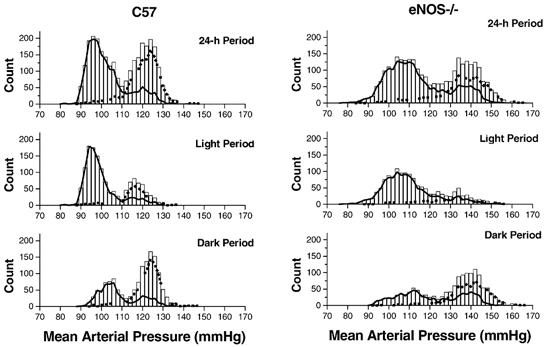
The histogram shows the total number of samples occurring within 2 mmHg bins during the 24 h (top) or 12 h (middle and bottom) periods. The dashed and continuous lines indicate the number of samples recorded with or without concurrent locomotor activity, respectively. The individual mice (W19 and K45) represent those with the median level of 24 h MAP for their group. The same vertical and horizontal scales are used in each plot.
Table 2.
MAP distribution statisticsfor eNOS-knockout mice (eNOS−/−) and their control strain (C57)
| Period | Variable | C57 | eNOS−/− | eNOS/C57 ratio | P value |
|---|---|---|---|---|---|
| 24 h | Median (mmHg) | 103 ± 2 | 118 ± 1 | 1.14 | < 0.001 |
| Mode 1 (mmHg) | 91 ± 1 | 102 ± 2 | 1.12 | 0.001 | |
| Mode 2 (mmHg) | 114 ± 2 | 134 ± 2 | 1.17 | < 0.001 | |
| Mode 2 – Mode 1 | 23 ± 1 | 33 ± 2 | 1.41 | 0.001 | |
| 1st percentile (mmHg) | 81 ± 2 | 87 ± 2 | 1.06 | ns (0.055) | |
| 99th percentile (mmHg) | 129 ± 2 | 156 ± 3 | 1.20 | < 0.001 | |
| Range (1–99%) | 48 ± 2 | 69 ± 3 | 1.44 | < 0.001 | |
| Variation coefficient (%) | 12.6 ± 0.4 | 15.9 ± 0.8 | 1.26 | 0.003 | |
| Light period | Median (mmHg) | 94 ± 1 | 104 ± 2 | 1.11 | 0.001 |
| Mode 1 (mmHg) | 90 ± 1 | 100 ± 2 | 1.11 | 0.001 | |
| Mode 2 (mmHg) | 114 ± 2* | 131 ± 2 | 1.14 | < 0.001 | |
| Mode 2 – Mode 1 | 23 ± 1* | 31 ± 2 | 1.32 | 0.006 | |
| 1st percentile (mmHg) | 81 ± 1 | 85 ± 2 | 1.06 | ns (0.086) | |
| 99th percentile (mmHg) | 124 ± 2 | 148 ± 2 | 1.19 | < 0.001 | |
| Range (1–99%) | 46 ± 1 | 64 ± 3 | 1.39 | < 0.001 | |
| Variation coefficient (%) | 11.6 ± 0.3 | 14.7 ±0.7 | 1.27 | 0.002 | |
| Dark period | Median (mmHg) | 12 ± 3 | 132 ± 1 | 1.18 | < 0.001 |
| Mode 1 (mmHg) | 98 ± 3 * | 107 ± 2 † | 1.09 | 0.037 | |
| Mode 2 (mmHg) | 117 ± 3 * | 137 ± 2 | 1.18 | < 0.001 | |
| Mode 2-Model | 19 ± 2 * | 31 ± 2 † | 1.63 | < 0.001 | |
| 1st percentile (mmHg) | 86 ± 2 | 94 ± 2 | 1.09 | 0.017 | |
| 99th percentile (mmHg) | 131 ± 2 | 158 ± 3 | 1.20 | < 0.001 | |
| Range (1 –99%) | 44 ± 2 | 62 ± 2 | 1.42 | < 0.001 | |
| Variation coefficient (%) | 10.2 ± 0.4 | 12.6 ± 0.7 | 1.23 | 0.012 |
n = 9 except where indicated
n = 8
= 7.
Figure 4. Recordings of MAP, heart rate and locomotor activity in individual control (C57) and eNOS-knockout (eNOS−/−) mice.
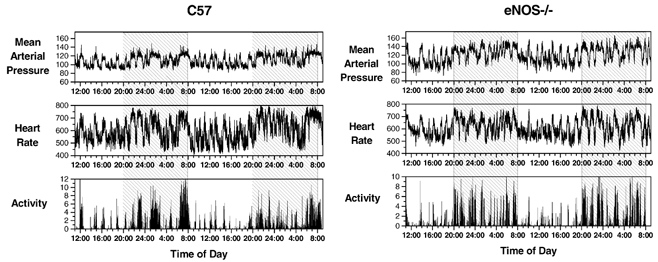
Activity data are normalized so that the 24 h mean level = 1. The raw data are from the same individual mice used in Fig. 3 (MAP, mmHg; heart rate, beats min−1). Shaded regions represent the 12 h dark periods.
Because the two modes of the MAP distribution can be attributed to the influence of inactivity and activity, the extent of their separation can be used to quantify the impact of activity on MAP. Furthermore, values obtained from the 12 h light or 12 h dark period should be independent of any circadian variation in blood pressure. In control and eNOS−/− mice, the two MAP modes were separated by 23 ± 1 and 31 ± 2 mmHg, respectively, during the 12 h light period, and by 19 ± 2 and 31 ± 2 mmHg, respectively, during the 12 h dark period (Table 2). This degree of separation of the modes suggests a relatively marked effect of locomotor activity on MAP in control mice and a significant (32–63 %) enhancement of this effect in eNOS−/− mice.
The breadth of MAP distributions was also significantly greater in eNOS−/− mice than in control mice (e.g. by 44 % for 24 h MAP, Table 2). This was associated with a 27 mmHg higher 24 h peak (99th percentile) MAP level (P < 0.001, Table 2), but only a 6 mmHg (P = 0.055, Table 2) higher 24 h minimum (1st percentile) MAP level. The coefficient of variation of MAP was also significantly greater in eNOS−/− mice (e.g. by 26 % during the 24 h period, Table 2).
Circadian variations in blood pressure
Although locomotor activity appeared to be a dominant influence on blood pressure and heart rate in individual recordings (e.g. Fig. 4), a diurnal trend was nevertheless evident in plots of the group means for blood pressure and heart rate (Fig. 5). The difference in blood pressure during the dark and light periods amounted to 13.0 ± 1.4 mmHg in control mice, and was significantly greater (by 48 %) in eNOS−/− mice (Table 1).
Figure 5. The diurnal trend in MAP, heart rate and locomotor activity (normalized so that the 24 h mean level = 1) in control (C57) and eNOS-knockout (eNOS−/−) mice.
Values are plotted at half-hourly intervals over a 24 h period (MAP, mmHg; heart rate, beats min−1). Group means (±s.e.m.) are indicated by filled circles. Values from individual mice are indicated by continuous lines without symbols. The shaded region represents the 12 h dark period. n = 9 per group.
Heart rate
Like blood pressure, heart rate was clearly affected by diurnal and locomotor activity cycles (Figs 4 and 5). The distribution of heart rate values was often bimodal (light period: 3/9 control and 8/9 eNOS−/−; dark period: 5/9 control and 7/9 eNOS−/−; 24 h period: 7/9 control and 9/9 eNOS−/−), the lower mode corresponding well with heart rate samples associated with inactivity (activity signal = 0) and the higher mode corresponding well with heart rate samples associated with activity (activity signal > 0). The two modes of the 24 h heart rate distribution were separated by 143 ± 16 beats min−1 in control and 140 ± 7 beats min−1 in eNOS−/− mice (Table 3).
Table 3.
Heart rate distribution statistics for eNOS-knockout mice (eNOS−/−) and their control strain (C57)
| Period | Variable | C57 | eNOS−/− | eNOS/C57 ratio | P value |
|---|---|---|---|---|---|
| 24 h | Median (beats min−1) | 588 ± 8 | 587 ± 7 | 0.99 | (0.972) |
| Mode 1 (beats min−1) | 513 ± 14* | 528 ± 9 | 1.03 | ns (0.384) | |
| Mode 2 (beats min−1) | 658 ± 10 * | 668 ± 9 | 1.01 | ns (0.489) | |
| Mode 2 – Mode 1 | 143 ± 16† | 140 ± 7 | 0.98 | ns (0.872) | |
| 1st percentile (beats min−1) | 441 ± 6 | 460 ± 8 | 1.04 | ns (0.077) | |
| 99th percentile (beats min−1) | 753 ± 6 | 747 ± 6 | 0.99 | ns (0.465) | |
| Range (1–9%) | 145 ± 9 | 137 ± 7 | 0.95 | ns (0.544) | |
| Variation coefficient (%) | 14.3 ± 0.7 | 13.4 ± 0.7 | 0.94 | ns (0.350) | |
| Light period | Median (beats min−1) | 544 ± 8 | 541 ± 9 | 0.995 | ns (0.827) |
| Mode 1 (beats min−1) | 512 ± 12 | 514 ± 11 | 1.01 | ns (0.815) | |
| Mode 2 (beats min−1) | 617 ± 3§ | 636 ± 10 * | 1.03 | ns (0.121) | |
| Mode 2 – Mode 1 | 130 ± 10 § | 121 ± 10* | 0.93 | ns (0.559) | |
| 1st percentile (beats min−1) | 441 ± 6 | 456 ± 8 | 1.03 | ns (0.172) | |
| 99th percentile (beats min−1) | 712 ± 5 | 709 ± 4 | 1.00 | ns (0.623) | |
| Range (1–99%) | 105 ± 5 | 89 ± 7 | 0.85 | ns (0.061) | |
| Variation coefficient (%) | 12.3 ± 0.5 | 11.3 ±0.7 | 0.91 | ns (0.241) | |
| Dark period | Median (beats min−1) | 644 ± 10 | 648 ± 7 | 1.01 | ns (0.745) |
| Mode 1 (beats min−1) | 488 ± 19 ‡ | 531 ± 16† | 1.09 | ns (0.123) | |
| Mode 2 (beats min−1) | 672 ± 12 | 673 ± 9 | 1.00 | ns (0.943) | |
| Mode 2 – Mode 1 | 180 ± 27 ‡ | 140 ± 11† | 0.78 | ns (0.228) | |
| 1st percentile (beats min−1) | 447 ± 8 | 474 ± 8 | 1.06 | 0.026 | |
| 99th percentile (beats min−1) | 761 ± 5 | 754 ± 6 | 0.99 | ns (0.368) | |
| Range (1–99%) | 128 ± 9 | 119 ±7 | 0.93 | ns (0.458) | |
| Variation coefficient (%) | 13.3 ± 0.6 | 11.8 ± 0.6 | 0.88 | ns(0.083) |
n = 9 except where indicated
n = 8
n = 7
n =5-
n = 3.
In contrast to the differences in 24 h MAP in eNOS−/− and control mice, the 24 h mean heart rate of the two strains was highly similar (Tables 1 and 3). The means and mode values of the two strains were not significantly different, nor were indices of the heart rate dispersion, including the 24 h range, variation coefficient, light–dark differences, or differences between modes.
Responses to l-name and vehicle
The blood pressure effect of l-NAME was investigated to verify that the mice responded in the manner appropriate to their genotypes: that is, an eNOS-mediated pressor response to l-NAME should be absent in eNOS-deficient mice (Kurihara et al. 1998; Kojda et al. 1999; Brandes et al. 2000; Beierwaltes et al. 2002). As expected, the administration of vehicle (5 % dextrose solution i.p.) to previously undisturbed mice resting in their home cage resulted in significant increases in activity, heart rate, pulse pressure and MAP. This response subsided over a period of 60 min (Fig. 6). Although this reaction tended to be greater in eNOS−/− mice, this difference only achieved statistical significance in the case of the initial increase in pulse pressure. Administration of l-NAME (50 mg kg−1 in 5 % dextrose) elicited a disturbance reaction similar to that seen with vehicle injection. However, whereas this reaction subsided in eNOS−/− mice, the elevation of MAP was sustained for at least 2 h in control mice (Fig. 6). The presence of a sustained blood pressure response to l-NAME in control but not eNOS−/− mice is consistent with previous findings reported for mice of these genotypes (Kurihara et al. 1998; Kojda et al. 1999; Brandes et al. 2000; Beierwaltes et al. 2002).
Figure 6. Effect of l-NAME and vehicle in control and eNOS−/− mice.
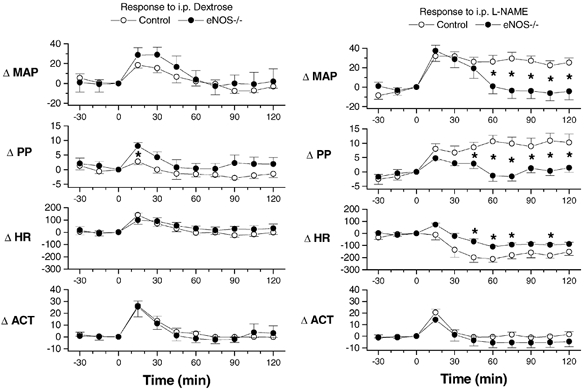
The plots illustrate the change in mean arterial pressure (ΔMAP, mmHg), pulse pressure (ΔPP, mmHg), heart rate (ΔHR, beats min−1) and activity (ΔACT, absolute units) in response to the administration of l-NAME (50 mg kg−1i.p., in 5 % dextrose, right) or vehicle (5 % dextrose, left). Plotted values represent the mean ±s.e.m. for seven control (open symbols) and six eNOS-knockout (eNOS−/−, filled symbols) mice. *Significant difference between the two groups.
Discussion
The importance of eNOS in long-term blood pressure control is supported by the association of hypertension with eNOS polymorphisms in man (Wattanapitayakul et al. 2001) and the consistent reporting of hypertension in eNOS-deficient mice (Huang et al. 1995; Shesely et al. 1996, 2001; Gödecke et al. 1998; Kurihara et al. 1998; Stauss et al. 1999; Yang et al. 1999; Brandes et al. 2000; Duplain et al. 2001; Beierwaltes et al. 2002). In the case of eNOS polymorphisms and hypertension in man, a number of contrasting results have been reported (Wattanapitayakul et al. 2001). Although hypertension has been consistently reported in eNOS-knockout mice, there is little consensus on the extent of hypertension in such animals, and few other characteristics of their blood pressure have been described. In the present study, we used the blood pressure telemetry method to obtain an extensive characterization of blood pressure in eNOS-knockout mice and their C57Bl/6J control strain. This is the first description of 24 h blood pressure in eNOS−/− mice by any method, and one of few detailed descriptions of 24 h blood pressure in mice in general. The use of the telemetry method allowed us to make continuous recordings in conscious mice residing in their usual cage and room under relatively stress-free conditions. In this manner, our objective was to obtain an evaluation of the blood pressure phenotype of eNOS−/− mice that was representative of the animal's normal life and relatively free of experimental artefact. Furthermore, we hoped that such a study might serve as a first step towards establishing a general method for describing the blood pressure phenotype of mouse strains in detail. Our results demonstrate that under these conditions, eNOS−/− mice exhibit a remarkably modest degree of hypertension relative to their control strain. However, our results also demonstrate this modest change to be accompanied by more pronounced increases in pulse pressure and several measures of blood pressure variability or reactivity, but normal heart rate levels. A circadian rhythm of blood pressure was present, and was even exaggerated, in eNOS−/− mice. Finally, the present study also described and quantified the influence of locomotor activity cycles on the blood pressure in both control and eNOS−/− mice. The effect of activity was pronounced, appearing to have a greater impact on the blood pressure level than that of the circadian rhythm or even the presence/absence of the eNOS gene itself.
What is the blood pressure level in eNOS−/− mice?
eNOS−/− mice exhibited a modest degree of hypertension, the extent of elevation ranging from 11 to 18 % depending upon which measure was used (Table 1). This degree of elevation is similar to previous results in eNOS−/− mice obtained using the tail-cuff method (systolic pressure being elevated by 11–20 % relative to controls; Shesely et al. 1996; Kurihara et al. 1998; Kojda et al. 1999; Yang et al. 1999; Shesely et al. 2001), is within the lower range of previously reported values assessed by direct catheter measurements in conscious mice (mean blood pressures were elevated by 7–44 %, relative to controls; Huang et al. 1995; Stauss et al. 1999; Duplain et al. 2001), and is at or below the lower range of values reported for direct catheter measurement in anaesthetized mice (mean blood pressures were elevated by 16–69 % relative to controls; Huang et al. 1995; Gödecke et al. 1998; Kurihara et al. 1998; Brandes et al. 2000; Beierwaltes et al. 2002).
A comparison of the actual values of blood pressure that have been reported for conscious eNOS−/− mice and their corresponding control strains is shown in Fig. 7. As the graph illustrates, there is marked variation among estimates of the blood pressure level in eNOS−/− mice. However, it is equally, if not more important to note that this variation, which is so pronounced in the case of values reported for eNOS−/− mice, is relatively modest in the case of values reported for control mice (Fig. 7). This suggests that the variation amongst the reported values of eNOS−/− mouse blood pressure is associated with a property of eNOS−/− mouse strains and does not simply reflect a problem with the measurement of blood pressure in mice in general.
Figure 7. Previously reported values of blood pressure in conscious eNOS-knockout and control mice.
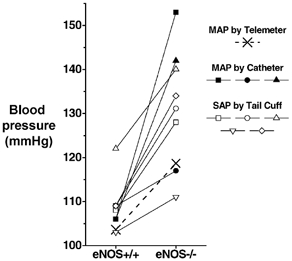
Each small symbol and line represents a reported value of MAP measured by chronic catheter (filled symbols) or a value of systolic arterial pressure (SAP) measured by tail-cuff (open symbols). The 24 h MAP values for the present study are indicated by two crosses connected by a dashed line. Based on values reported in Huang et al. 1995; Shesely et al. 1996, 2001; Kurihara et al. 1998; Kojda et al. 1999; Stauss et al. 1999; Yang et al. 1999; Duplain et al. 2001.
There are several possible explanations for this variation. First, this variation may represent real differences between different eNOS−/− mouse strains. eNOS−/− mouse strains have been produced independently by four different laboratories (Huang et al. 1995; Gödecke et al. 1998; Gregg et al. 1998; Shesely et al. 1998), and each of the three catheter-based studies used a different eNOS−/− strain (Huang et al. 1995; Stauss et al. 1999; Duplain et al. 2001), which could potentially explain the discrepancy in their reported blood pressure levels. Although we cannot presently rule out this possibility, it is also clear that considerable variation occurs independent of eNOS−/− strain, since significant variation was also evident in the blood pressure level reported in the five tail-cuff studies (Fig. 7; Shesely et al. 1996, 2001; Kurihara et al. 1998; Kojda et al. 1999; Yang et al. 1999), even though each of these studies used the same eNOS−/− mouse strain. Second, the variation in reported values of blood pressure in eNOS−/− mice could reflect real differences in the expression of hypertension in eNOS−/− mice raised in different environments. Finally, it is worth considering the increased variability/reactivity of blood pressure in eNOS−/− mice as a potential factor. When combined with the differences in the blood pressure recording environment and technique of different laboratories, heightened blood pressure reactivity (e.g. to activity, diurnal cycles, possibly stress, see below) could also promote large differences in reported blood pressure values between laboratories for eNOS−/− (but not eNOS+/+) mice. This is an important issue since it may also impede our ability to accurately assess the level of blood pressure in other knockout models or mouse strains. In the case of eNOS−/− mice, distinguishing the underlying causes of this variation will require additional studies.
Pulse pressure
The results of the present study also demonstrated a significant (∼23 %) increase in pulse pressure in eNOS−/− mice (Table 1). Although pulse pressure was not significantly affected in a previous study of conscious eNOS−/− mice (Stauss et al. 1999), we also observed a sustained ∼10 mmHg increase in the pulse pressure of control (but not eNOS−/−) mice following inhibition of nitric oxide formation with l-NAME (Fig. 6). Pulse pressure has several determinants, including heart rate, stroke volume and afterload, with the dynamic characteristics of afterload (i.e. characteristic impedance) being influenced by the compliance and resistance of the systemic circulation and the extent and timing of wave reflection. Although determining the exact mechanism underlying the increased pulse pressure in eNOS−/− mice is well outside the scope of the present study, it is clear that we cannot attribute the increased pulse pressure to differences in heart rate since, in contrast with previous studies that reported increases (Stauss et al. 1999; Brandes et al. 2000; Shesely et al. 2001; Beierwaltes et al. 2002) or decreases (Shesely et al. 1996; Gödecke et al. 1998; Kurihara et al. 1998; Yang et al. 1999) in heart rate in eNOS−/− mice, the heart rate of eNOS−/− and control mice was equivalent in the present study (Tables 1 and 3). With cardiac output reportedly normal in eNOS-knockout mice (Yang et al. 1999) and heart rate unaffected (Tables 1 and 3), stroke volume was unlikely to have been different in the two groups. The increased pulse pressure that we observed in eNOS−/− mice would, however, be consistent with several of the reported effects of NOS inhibition on the dynamic characteristics of afterload. First, NOS inhibition has been reported to increase pulse-wave velocity, and could in this manner influence the pulse pressure profile (Fitch et al. 2001; Wilkinson et al. 2002). However, changes in pulse wave velocity do not appear to be associated with either of two eNOS polymorphisms in man (Lacolley et al. 1998). Second, the nitric oxide system has also been shown to significantly affect the extent of pulse-wave reflection (Yaminuma et al. 1986; Hu et al. 1997; Weinberg et al. 2001), even in the absence of changes in pulse-wave velocity (Yaminuma et al. 1986; Weinberg et al. 2001), and in this manner influence the pulse pressure (Yaginuma et al. 1986) and the shape of the peripheral pressure pulse (Weinberg et al. 2001). Third, and finally, although both increases (e.g. Joannides et al. 1997) and decreases (e.g. Kinlay et al. 2001) in the distensibility of individual arteries have been reported following NOS inhibition, the results of several studies suggest that NOS inhibition may lead to a reduction in the compliance of the major conduit vessels within the systemic arterial system, at least based on reports of several measurements of systemic arterial compliance (Hu et al. 1997) and pulse-wave velocity (Fitch et al. 2001; Wilkinson et al. 2002).
Blood pressure variability
eNOS−/− mice exhibited marked increased in overall blood pressure variation, as evidenced by a 44 % increase in the width of the 24 h MAP distribution and a 26 % increase in the coefficient of variation (Table 2). Increased variations of blood pressure were also observed in eNOS−/− mice in association with the diurnal trend (e.g. a 41 % greater difference in MAP levels between light and dark periods, Table 1, Fig. 5) and activity cycles (e.g. a 48 % greater separation of the two modes of the 24 h MAP distribution, Table 2, Fig. 3, and see Discussion below). In addition, when a subset of the mice were administered an injection of vehicle solution, the eNOS−/− group showed a tendency towards a greater blood pressure response (Fig. 6), although this tendency did not reach statistical significance. Overall, our results suggest that the blood pressure of eNOS−/− mice is more variable and reactive than that of control animals. This greater reactivity may have contributed to the generally higher blood pressure levels reported in previous studies of eNOS−/− mice (see above).
An increased variability of blood pressure has previously been observed following administration of blockers of NOS in dogs, rats and mice (Just et al. 1994; Nafz et al. 1997; Janssen et al. 2000), and in eNOS-knockout mice (Stauss et al. 1999). In these studies, NOS inhibition or deficiency was shown to result in marked increases in blood pressure variation in a low-frequency band (0.2–0.6 Hz in rats (Nafz et al. 1997); 0.1–0.5 Hz in dogs Just et al. 1994); 0.05–0.4 Hz in mice (Stauss et al. 1999; Janssen et al. 2000)). The present study extends these observations, showing that there is an increased dispersion of blood pressure values over a 24 h period in undisturbed eNOS−/− mice, and that blood pressure variations associated with the diurnal and activity cycles are increased. Combined with a modest increase in the 24 h mean blood pressure level, the increase in blood pressure variability/dispersion resulted in a pronounced increase in the peak blood pressure levels experienced by eNOS−/− mice in a 24 h period (156 ± 3 versus 129 ± 2 mmHg, P < 0.001, Table 2).
The increased blood pressure variability that occurs in animals following eNOS blockade and in eNOS−/− mice has been suggested to be the consequence of interrupting an eNOS-dependent blood pressure-buffering mechanism (Just et al. 1994; Nafz et al. 1997; Stauss et al. 1999). Specifically, it has been proposed that increases in blood pressure lead to increases in blood flow and shear stress, which in turn induce the release of nitric oxide from the vascular endothelium. The ensuing vasodilatation would help correct the initial blood pressure disturbance, thereby completing a negative feedback loop for the regulation of the blood pressure level. Alternatively, it is also possible that the observed increase in blood pressure variability in eNOS−/− mice and other animals treated with NOS inhibitors may reflect the increased reactivity of vascular smooth muscle to vasoconstrictors that occurs when tissues are deprived of nitric oxide (e.g. after removal of the endothelium; Adeagbo & Triggle, 1993; Zonta et al. 1998), following treatment with NOS inhibitors (Adeagbo & Triggle, 1993; Zonta et al. 1998), in eNOS−/− mice (Kojda et al. 1999) and in the coronary vessels of humans with the G894T eNOS polymorphism (Philip et al. 1999). Additional studies will be required to determine the precise mechanisms underlying the increased blood pressure variability in eNOS-deficient animals.
Locomotor activity as a source of blood pressure variability
In both eNOS−/− and control mice, striking fluctuations in blood pressure occurred in association with episodes of locomotor activity throughout the 24 h period (e.g. Fig. 4). The blood pressure cycles were pronounced, resulting in bimodal distributions of blood pressure (Fig. 3) that had been described previously in mice by Janssen et al. (2000). Estimated in terms of the separation of the low and high modes of the MAP, the influence of activity cycles amounted to 23 and 19 mmHg, respectively, in control mice during the 12 h light and 12 h dark periods, and 31 and 31 mmHg, respectively, during the corresponding periods in eNOS−/− mice (Table 2). To put these values into context, they are above the day-night difference in MAP for these mice (13 mmHg in control and 19 mmHg in eNOS−/− mice, Table 1) or the impact of the eNOS−/− gene itself (e.g. a 15 mmHg effect on 24 h MAP, Table 1), and are greater than the separation of the two peaks of the bimodal blood pressure distribution observed during the dark period in Wistar-Kyoto rats (11 mmHg, Janssen et al. 1992). Activity appeared to be a remarkably dominant influence on blood pressure level. Indeed, a correlation analysis suggested that it could account for 66–70 % of the variation in 0.5 h mean MAP levels of control and eNOS−/− mice over a 24 h period (data not shown). Relative to other species commonly used in cardiovascular research (e.g. rat; Janssen et al. 1992), the impact of locomotor activity cycles on the blood pressure in the mouse appears to be pronounced in terms of the size of the effect, the relatively high frequency of these cycles, and their occurrence throughout both the light and dark phases of the 24 h period.
Control and eNOS−/− mice also exhibited a diurnal trend in the group means of their activity, blood pressure and heart rate levels (Fig. 5). The difference in the mean MAP level during the 12 h light and 12 h dark periods amounted to 12.5 and 16.2 % of the respective 24 h MAP values in control and eNOS−/− mice, respectively (Table 1). This diurnal blood pressure trend appeared to be largely the result of the diurnal modulation of the underlying pattern of locomotor activity cycles. For example, the tendency for blood pressure levels to be higher during the 12 h dark period was largely attributable to a change in the proportion of time spent in the active state (Table 1, Fig. 4), and consequently, the proportion of time MAP resided at or near its high mode. Thus, during the 12 h dark period, the mean MAP was closer to the second blood pressure mode (63 and 70 % along the distance separating the two modes in control and eNOS−/− mice, respectively), whereas during the 12 h light period, the mean MAP level was closest to the first blood pressure mode (29 % along the distance separating the two modes in both control and eNOS−/− mice). A shift in the actual level of the MAP modes also contributed to the diurnal trend in blood pressure, the average mode for the 12 h dark period being slightly higher than for the 12 h light period (Table 2).
Activity as a potential confounder of blood pressure measurements
The quantitatively important influence of locomotor activity cycles on blood pressure that we have observed in the present study has several implications for the measurement of blood pressure in conscious, undisturbed mice. First, in conditions in which locomotor activity cycles and associated blood pressure fluctuations occur, short-term estimates of the blood pressure level will be less reliable and less repeatable. In the case of the nine C57Bl/6J mice used in the present study, for example, the 95 % confidence intervals for the group's mean blood pressure spanned 22 mmHg in the case of measurements made at a single point in time (mean result for measurements made at 10.00, 12.00 and 14.00 h), 14 mmHg when the mean blood pressure levels were determined over 30 min periods and 8 mmHg in the case of their 24 h mean blood pressure. The corresponding values for the 12 h light and 12 h dark periods were 6 and 11 mmHg, respectively. Second, because locomotor activity has such a marked impact on blood pressure in mice, experimental treatments that affect blood pressure in conscious mice may do so as a consequence of their effect on locomotor activity. As shown in Fig. 6, for example, administration of the vehicle solution alone resulted in increases in blood pressure and locomotor activity that were sustained for more than 30 min. As in the present study, such effects can be controlled for by the use of an appropriate experimental design (i.e. an appropriate control group) and by the monitoring of activity. Third, it is important to realize that the overall level of locomotor activity may have the potential to influence the long-term mean blood pressure level in mice. For example, treatments causing an increase (or decrease) in the proportion of time spent active may increase (or decrease) the 24 h mean blood pressure level, even if the treatment did not affect the level of blood pressure occurring during active and inactive periods. Indeed, this sort of mechanism clearly contributed to the diurnal trend in blood pressure (see above). In the present study, locomotor activity was unlikely to have biased our estimates of the 24 h mean blood pressure level since by all measures, activity levels were similar in the eNOS−/− and control mouse groups (Table 1). Nevertheless, locomotor activity will be an important factor to consider in future characterizations of blood pressure in knockout and transgenic models, since marked changes in activity occasionally occur in such models (e.g. Espinosa et al. 2001; Gerber et al. 2001; Toyota et al. 2002) and because the modification of single genes may often be expected to have an effect on blood pressure that is modest and therefore easily confounded.
Acknowledgments
This work was supported by a grant from the Canadian Institutes of Health Research (B.N.V.V.) and from the Swiss National Science Foundation (J.P.M.)
References
- Adeagbo AS, Triggle CR. Interactions of nitric oxide synthase inhibitors and dexamethasone with alpha-adrenoceptor-mediated responses in rat aorta. Br J Pharmacol. 1993;109:495–501. doi: 10.1111/j.1476-5381.1993.tb13597.x. [DOI] [PMC free article] [PubMed] [Google Scholar]
- Beierwaltes WH, Potter DL, Shesely EG. Renal baroreceptor-stimulated renin in the eNOS knockout mouse. Am J Physiol. 2002;51:F59–64. doi: 10.1152/ajprenal.0144.2001. [DOI] [PubMed] [Google Scholar]
- Brandes RP, Schmitz-Winnenthal F-H, Félétou M, Gödecke A, Huang PA, Vanhoutte PM, Fleming I, Busse R. An endothelium-derived hyperpolarizing factor distinct from NO and prostacyclin is a major endothelium-dependent vasodilator in resistance vessels of wild-type and endothelial NO synthase knockout mice. Proc Natl Acad Sci U S A. 2000;97:9747–9752. doi: 10.1073/pnas.97.17.9747. [DOI] [PMC free article] [PubMed] [Google Scholar]
- Butz GM, Davisson RL. Long-term telemetric measurement of cardiovascular parameters in awake mice: a physiological genomics tool. Physiol Genomics. 2001;5:89–97. doi: 10.1152/physiolgenomics.2001.5.2.89. [DOI] [PubMed] [Google Scholar]
- Carlsson SH, Wyss MJ. Long-term telemetric recording of arterial pressure and heart rate in mice fed basal and high NaCl diets. Hypertension. 2000;35:1–5. doi: 10.1161/01.hyp.35.2.e1. [DOI] [PubMed] [Google Scholar]
- Duplain H, Burcelin R, Sartori C, Cook S, Egli M, Lepori M, Vollenweider P, Pedrazzini T, Nicod P, Thorens B, Scherrer U. Insulin resistance, hyperlipidemia, and hypertension in mice lacking endothelial nitric oxide synthase. Circulation. 2001;104:342–345. doi: 10.1161/01.cir.104.3.342. [DOI] [PubMed] [Google Scholar]
- Espinosa F, Mc Mahon A, Chan E, Wang S, Ho CS, Heintz N, Joho RH. Alcohol hypersensitivity, increased locomotion, and spontaneous myoclonus in mice lacking the potassium channels Kv3. 1 and Kv3.3. J Neurosci. 2001;21:6657–6665. doi: 10.1523/JNEUROSCI.21-17-06657.2001. [DOI] [PMC free article] [PubMed] [Google Scholar]
- Fitch RM, Vergona R, Sullivan ME, Wang Y-X. Nitric oxide synthase inhibition increases aortic stiffness measured by pulse wave velocity in rats. Cardiovasc Res. 2001;51:351–358. doi: 10.1016/s0008-6363(01)00299-1. [DOI] [PubMed] [Google Scholar]
- Gerber DJ, Sotnikova TD, Gainetdinov RR, Huang SY, Caron MG, Tonegawa S. Hyperactivity, elevated dopaminergic transmission and response to amphetamine in M1 muscarinic acetylcholine receptor-deficient mice. Proc Natl Acad Sci U S A. 2001;98:15312–15317. doi: 10.1073/pnas.261583798. [DOI] [PMC free article] [PubMed] [Google Scholar]
- Gödecke A, Decking UKM, Ding Z, Hirchenhain J, Bidmon H-J, Gödecke S, Schrader J. Coronary hemodynamics in endothelial NO synthase knockout mice. Circ Res. 1998;82:186–194. doi: 10.1161/01.res.82.2.186. [DOI] [PubMed] [Google Scholar]
- Gregg AR, Schauer A, Shi O, Liu Z, Lee CG, O'Brien WE. Limb reduction defects in endothelial nitric oxide synthase-deficient mice. Am J Physiol Heart Circ Physiol. 1998;275:H2319–2324. doi: 10.1152/ajpheart.1998.275.6.H2319. [DOI] [PubMed] [Google Scholar]
- Hu CT, Chang KC, Wu CY, Chen HI. Acute effects of nitric oxide blockade with l-NAME on arterial haemodynamics in the rat. Br J Pharmacol. 1997;122:1237–1243. doi: 10.1038/sj.bjp.0701496. [DOI] [PMC free article] [PubMed] [Google Scholar]
- Huang PL, Huang Z, Mashimo H, Block KD, Moskowitz MA, Bevan JA, Fishman MC. Hypertension in mice lacking the gene for endothelial nitric oxide synthase. Nature. 1995;377:239–242. doi: 10.1038/377239a0. [DOI] [PubMed] [Google Scholar]
- Janssen BJA, Leenders PJA, Smits JFM. Short-term and long-term blood pressure and heart rate variability in the mouse. Am J Physiol. 2000;278:R215–225. doi: 10.1152/ajpregu.2000.278.1.R215. [DOI] [PubMed] [Google Scholar]
- Janssen BJA, Tyssen CM, Struijker-Boudier HAJ, Hutchins PM. The 24 h homeodynamic states of arterial blood pressure and pulse interval in conscious rats. J Appl Physiol. 1992;73:754–761. doi: 10.1152/jappl.1992.73.2.754. [DOI] [PubMed] [Google Scholar]
- Joannides R, Richard V, Haefeli WE, Benoist A, Linder L, Lüscher TF, Thuillez C. Role of nitric oxide in the regulation of the mechanical properties of peripheral conduit arteries in humans. Hypertension. 1997;30:1465–1470. doi: 10.1161/01.hyp.30.6.1465. [DOI] [PubMed] [Google Scholar]
- Just A, Wittmann U, Nafz B, Wagner CD, Ehmke H, Kirchheim HR, Persson PB. The blood pressure buffering capacity of nitric oxide by comparison to the baroreceptor reflex. Am J Physiol Heart Circ Physiol. 1994;267:H521–527. doi: 10.1152/ajpheart.1994.267.2.H521. [DOI] [PubMed] [Google Scholar]
- Kinlay S, Creager MA, Fukumoto M, Hikita H, Fang JC, Selwyn AP, Ganz P. Endothelium-derived nitric oxide regulates arterial elasticity in human arteries in vivo. Hypertension. 2001;38:1049–1053. doi: 10.1161/hy1101.095329. [DOI] [PubMed] [Google Scholar]
- Kojda G, Laursen JB, Ramasamy S, Kent JD, Kurz S, Burchfield J, Shesely EG, Harrison DG. Protein expression, vascular reactivity and soluble guanylate cyclase activity in mice lacking the endothelial cell nitric oxide synthase: contributions of NOS isoforms to blood pressure and heart rate control. Cardiovasc Res. 1999;42:206–213. doi: 10.1016/s0008-6363(98)00315-0. [DOI] [PubMed] [Google Scholar]
- Kurihara N, Alfie ME, Sigmon DH, Rhaleb NE, Shesely EG, Carretero OA. Role of nNOS in blood pressure regulation in eNOS mutant mice. Hypertension. 1998;32:856–861. doi: 10.1161/01.hyp.32.5.856. [DOI] [PubMed] [Google Scholar]
- Lacolley P, Gautier S, Poirier O, Pannier B, Cambien F, Benetos A. Nitric oxide synthase gene polymorphisms, blood pressure and aortic stiffness in normotensive and hypertensive subjects. J Hypertens. 1998;16:31–35. doi: 10.1097/00004872-199816010-00006. [DOI] [PubMed] [Google Scholar]
- Mills PA, Huetteman DA, Brockway BP, Zwiers LM, Gelsema AJM, Schwartz RS, Kramer K. A new method for measurement of blood pressure, heart rate, and activity in the mouse by radiotelemetry. J Appl Physiol. 2000;88:1537–1544. doi: 10.1152/jappl.2000.88.5.1537. [DOI] [PubMed] [Google Scholar]
- Nafz B, Wagner CD, Persson PB. Endogenous nitric oxide buffers blood pressure variability between 0.2 and 0.6 Hz in the conscious rat. Am J Physiol. 1997;272:H632–637. doi: 10.1152/ajpheart.1997.272.2.H632. [DOI] [PubMed] [Google Scholar]
- Philip I, Plantefeve G, Vuillaumier-Barrot S, Vicaut E, Lemarie C, Henrion D, Poirier O, Levy BI, Desmonts JM, Durand G, Benessiano J. G894T polymorphism in the endothelial nitric oxide synthase gene is associated with an enhanced vascular responsiveness to phenylephrine. Circulation. 1999;99:3096–3098. doi: 10.1161/01.cir.99.24.3096. [DOI] [PubMed] [Google Scholar]
- Shesely EG, Gilbert C, Granderson G, Carretero D, Carretero OA, Beierwaltes WH. Nitric oxide synthase gene knockout mice do not become hypertensive during pregnancy. Am J Obstet Gynecol. 2001;185:1198–1203. doi: 10.1067/mob.2001.118142. [DOI] [PubMed] [Google Scholar]
- Shesely EG, Maeda N, Lim H-S, Desai KM, Krege JH, Lauback VE, Sherman PA, Sessa WC, Smithies O. Elevated blood pressures in mice lacking endothelial nitric oxide synthase. Proc Natl Acad Sci U S A. 1996;93:13176–13181. doi: 10.1073/pnas.93.23.13176. [DOI] [PMC free article] [PubMed] [Google Scholar]
- Stauss HM, Gödecke A, Mrowka R, Schrader J, Persson PB. Enhanced blood pressure variability in eNOS knockout mice. Hypertension. 1999;33:1359–1363. doi: 10.1161/01.hyp.33.6.1359. [DOI] [PubMed] [Google Scholar]
- Toyota H, Dugovic C, Koehl M, Laposky AD, Weber C, Ngo K, Wu Y, Lee DH, Yanai K, Sakurai E, Watanabe T, Liu C, Chen J, Barbier AJ, Turek FW, Fung-Leung W-P, Lovenberg TW. Behavioral characterization of mice lacking histamine H3 receptors. Mol Pharmacol. 2002;62:389–397. doi: 10.1124/mol.62.2.389. [DOI] [PubMed] [Google Scholar]
- Van Vliet BN, Chafe LL, Antic V, Schnyder-Candrian S, Montani J-P. Direct and indirect methods used to study arterial blood pressure. J Pharmacol Toxicol Methods. 2000;44:361–373. doi: 10.1016/s1056-8719(00)00126-x. [DOI] [PubMed] [Google Scholar]
- Wang Q, Hummler E, Nussberger J, Clement S, Gabbiani G, Brunner HR, Burnier M. Blood pressure, cardiac, and renal responses to salt and deoxycorticosterone acetate in mice: Role of renin genes. J Am Soc Nephrol. 2002;13:1509–1516. doi: 10.1097/01.asn.0000017902.77985.84. [DOI] [PubMed] [Google Scholar]
- Wattanapitayakul SK, Mihm MJ, Young AP, Bauer JA. Therapeutic implications of human endothelial nitric oxide synthase gene polymorphisms. Trends Pharmacol Sci. 2001;22:361–368. doi: 10.1016/s0165-6147(00)01692-8. [DOI] [PubMed] [Google Scholar]
- Weinberg PD, Habens F, Kengatharan M, Barnes SE, Matz J, Anggard EE, Carrier MJ. Characteristics of the pulse waveform during altered nitric oxide synthesis in the rabbit. Br J Pharmacol. 2001;133:361–370. doi: 10.1038/sj.bjp.0704084. [DOI] [PMC free article] [PubMed] [Google Scholar]
- Wilkinson IB, Qasem AMc, Eniery CM, Webb DJ, Avolio AP, Cockroft JR. Nitric oxide regulates local arterial distensibility in vivo. Circulation. 2002;105:213–217. doi: 10.1161/hc0202.101970. [DOI] [PubMed] [Google Scholar]
- Williams TD, Chambers JB, Henderson RP, Rashotte ME, Overton JM. Cardiovascular responses to caloric restriction and thermoneutrality in C57Bl/6J mice. Am J Physiol. 2002;282:R1459–1467. doi: 10.1152/ajpregu.00612.2001. [DOI] [PubMed] [Google Scholar]
- Witte K, Schnecko A, Zuther P, Lemmer B. Contribution of the nitric oxide-guanylyl cyclase system to circadian regulation of blood pressure in normotensive Wistar-Kyoto rats. Cardiovasc Res. 1995;30:682–688. [PubMed] [Google Scholar]
- Yaginuma T, Avolio A, O'Rourke M, Nichols W, Morgan JP, Roy P, Baron D, Branson J, Feneley M. Effects of glyceryl trinitrate on peripheral arteries alters left ventricular hydraulic load in man. Cardiovasc Res. 1986;20:153–160. doi: 10.1093/cvr/20.2.153. [DOI] [PubMed] [Google Scholar]
- Yang X-P, Liu Y-H, Shesely EG, Bulagannawar M, Liu F, Carretero OA. Endothelial nitric oxide gene knockout mice. Cardiac phenotypes and the effect of angiotensin-converting enzyme inhibitor on myocardial ischemia/reperfusion injury. Hypertension. 1999;34:24–30. doi: 10.1161/01.hyp.34.1.24. [DOI] [PubMed] [Google Scholar]
- Zonta F, Barbieri A, Reguzzoni M, Calligaro A. Quantitative changes in pharmacodynamic parameters of noradrenaline in different rat aorta preparations: influence of endogenous EDRF. J Autonom Pharmacol. 1998;18:129–138. doi: 10.1046/j.1365-2680.1998.1830129.x. [DOI] [PubMed] [Google Scholar]