Abstract
Protein surface hydration is fundamental to its structure and activity. We report here the direct mapping of global hydration dynamics around a protein in its native and molten globular states, using a tryptophan scan by site-specific mutations. With 16 tryptophan mutants and in 29 different positions and states, we observed two robust, distinct water dynamics in the hydration layer on a few (≈1–8 ps) and tens to hundreds of picoseconds (≈20–200 ps), representing the initial local relaxation and subsequent collective network restructuring, respectively. Both time scales are strongly correlated with protein's structural and chemical properties. These results reveal the intimate relationship between hydration dynamics and protein fluctuations and such biologically relevant water–protein interactions fluctuate on picosecond time scales.
Keywords: femtosecond dynamics, site-directed mutation, tryptophan scan, water–protein fluctuation
Water motion in the hydration layer is central to protein fluctuation, an essential determinant to its structural stability, dynamics, and function (1–9). Protein surface hydration is a longstanding unresolved problem, but recent extensive studies have merged into a cohesive picture: hydration water molecules are not static but dynamic in nature (1, 2, 10–18). NMR studies (13, 14) have revealed water residence times at protein surfaces within the subnanosecond regime, and molecular dynamics (MD) simulations (15–18) have indicated that water stays in the layer on the time scales from femtoseconds to picoseconds. These processes represent the dynamic exchange of hydration layer water with outside bulk water via thermal fluctuations. Femtosecond-resolved spectroscopic studies of protein solvation (19–26) recently have shown the dynamics of surface hydration on picosecond time scales with a biphasic distribution. We attributed the first ultrafast solvation to water local relaxation and the second longer-time dynamics to coupled water–protein fluctuations (25, 27). To generalize the global heterogeneous hydration dynamics around protein surfaces, correlate the dynamics with protein local structures and chemical identities, and decipher the molecular mechanism of water–protein fluctuations, we report here our direct mapping of water motions around a globular protein, apomyoglobin (apoMb), in its two states, native and molten globular, using intrinsic tryptophan residue (W) as a local molecular probe to scan the surface by protein engineering.
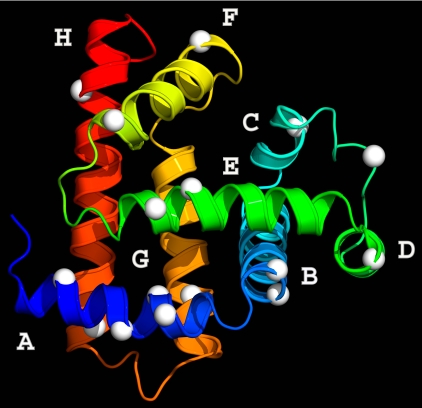
Myoglobin from sperm whale has eight α-helices (A–H) with a total of 153 aa (Fig. 1) (28), and all experiments were done with apoMb by removal of the prosthetic heme group. We carefully designed more than 30 mutants and placed tryptophan one at a time along each helix at the protein surface. After we screened all mutant proteins with their structural content, stability, and excited-state lifetime of tryptophan, only 16 mutants are appropriate for mapping global hydration, as shown in Fig. 1. We used a laser wavelength of 290 nm with a pulse width of 90 fs to excite tryptophan and then measured the time-dependent emission spectrum by fluorescence up-conversion, a nonlinear gating method with femtosecond time resolution.
Fig. 1.
Global mapping of surface hydration dynamics of apoMb. Shown is the x-ray crystal structure of sperm whale myoglobin (Protein Data Bank ID code 1MBD) in the holo form with eight helices A–H colored from blue to red. The 16 white balls indicate positions of mutation with tryptophan one at a time. In the apo form, the F-helix melts to a random coil (33).
Results and Discussion
Femtosecond-Resolved Fluorescence Transients and Solvation Correlation Functions.
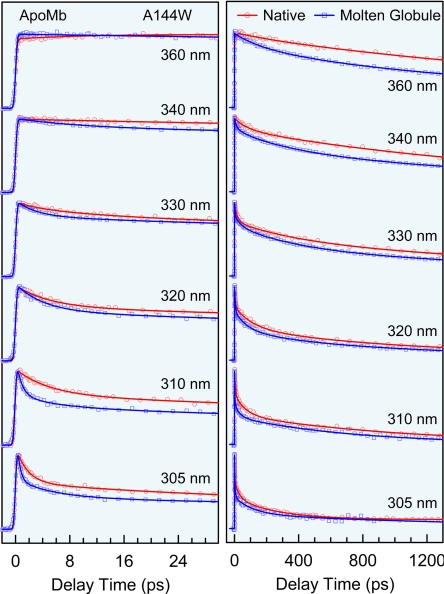
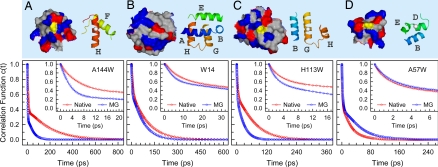
Fig. 2 shows the femtosecond-resolved fluorescence transients of A144W mutant in the native (pH = 6.0) and molten globular (pH = 4.0) states (29) for several typical gated wavelengths. Besides long lifetime emission, the signals at the shorter wavelengths show ultrafast decays on picosecond time scales and gradually slow down toward the longer emissions, a manifestation of the local solvation dynamics. For all 16 mutant proteins and in two states, the fluorescence dynamics show a similar pattern of temporal behaviors with a double-exponential decay for solvation, but the time scales are very different. Using the method we recently developed (30) [see supporting information (SI) Figs. 7 and 8], we constructed the temporal evolution of fluorescence spectra from each set of fluorescence transients and thus obtained all dynamic Stokes shifts and corresponding 29 solvation correlation functions. Fig. 3 shows the solvation response of four typical mutants, A144W, W14, H113W, and A57W, in the two states from the different helices of H, A, G, and D, respectively. For all mutants, the correlation functions show a robust, biphasic distribution and the dynamic Stokes shifts (ΔE1 and ΔE2) and decay times (τ1 and τ2) of two relaxations are shown in Figs. 4 and 5. The first relaxation occurs ultrafast on the time scale of a few picoseconds (≈1–8 ps), and the second dynamics takes a longer time in tens to hundreds of picoseconds (≈20–200 ps).
Fig. 2.
Femtosecond-resolved fluorescence transients of mutant A144W for several gated emission wavelengths in the native (red) and molten globule (blue) states in short (Left) and long (Right) time ranges. The circles and squares are the experimental data, and the solid lines are the best multiple-exponential fit. The transients display a typical pattern of solvation dynamics: fast decay at the shorter wavelengths and initial rise at the longer wavelengths. Note that all of the signals become faster in the molten globule state.
Fig. 3.
Local protein properties and solvation correlation functions of four representative mutants. (Upper) Native-state surface maps (Left) and secondary structures (Right) within ≈12 Å around tryptophan. On the surface maps, blue, red, and gray colors represent positively charged, negatively charged, and nonpolar amino acids, respectively, and tryptophans are in yellow. In the secondary structures, the color of each helix corresponds to that in Fig. 1, and tryptophan is shown as a white ball. (Lower) Solvation correlation functions of the four mutants in the native (red) and molten globule (MG; blue) states. The circles are the experimental data, and the solid lines are the best double-exponential fit. (A) A144W on the dense charge surface of H-helix. (B) W14 on A-helix but buried inside the protein. (C) H113W on G-helix with a more rigid local structure in the native state. (D) A57W on D-helix in a less structured region at the native state.
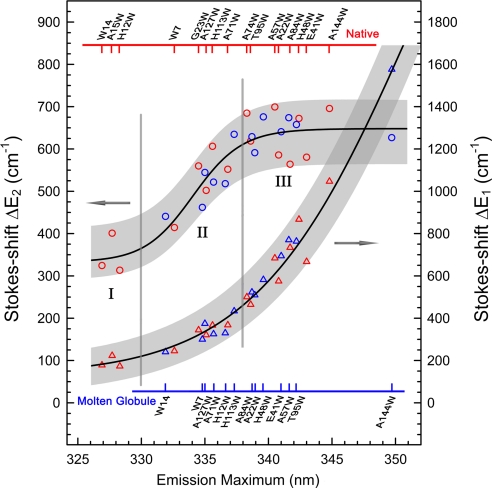
Fig. 4.
The two dynamic Stokes shifts ΔE1 (triangles; right y axis) and ΔE2 (circles; left y axis) of all mutants in the native (red) and molten globule (blue) states plotted against their steady-state fluorescence emission peaks. The black lines show the increasing trends, and the shades cover the fluctuation ranges of the two energies. Mutants' names are given on the top for the native and at the bottom for the molten globule with ticks corresponding to the data points. The three regions (I–III) represent tryptophan positions relative to the protein surface (see text).
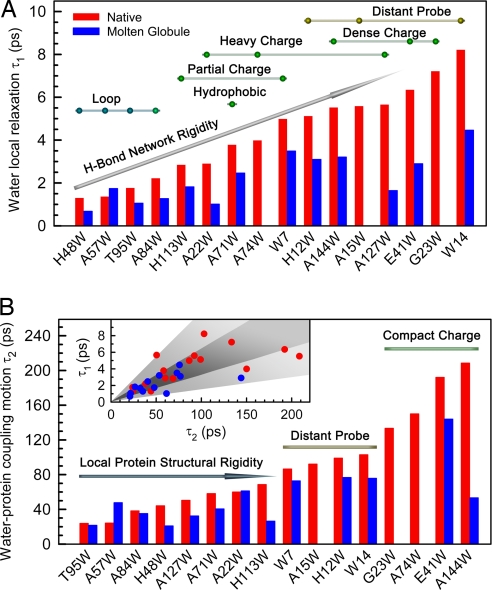
Fig. 5.
The hydration dynamics, τ1 (A) and τ2 (B), of all mutants plotted according to the order of their time scales in the native state. (A) The beads above the bars represent the native-state mutants and are classified according to their probe positions (yellow), local charge distributions (green), and local secondary structures (blue). The water motion correlates with local charge distributions, protein structural properties, and probe locations. (B) The native-state mutants are simply grouped by two bars, dense charge surfaces and distant probe, and an arrow with the increased structural rigidity, colored with the same code for the beads in A. B Inset also shows the correlation of two hydration dynamics.
The obtained solvation correlation functions are the response of local environments around tryptophan to its sudden change of dipole moment upon excitation. Under this perturbation, the response, in principle, can result from both the surrounding water molecules and the local protein backbone and side chains. However, our recent solvation studies on the enzymes Staphylococcus nuclease (25) and human thioredoxin (26) by systematic mutations of charged and polar residues around the tryptophan probe indicated that the response is dominantly from surface-water motions and the contributions from the proteins are minor. With the massive data presented here, we are able to examine the global surface hydration dynamics and their relationships to protein properties and its fluctuations.
Dynamic Stokes Shifts and Two Distinct Water Motions.
In Fig. 4, the two Stokes shifts show distinct relationships with the emission maxima of tryptophan, and they further ascertain the dominance of solvation response from surface-water hydration. The first component ΔE1 shows a monotonic increase from 180 to 1,600 cm−1 when the probe gradually moves to the surface, indicating that ΔE1 directly reflects the total probed water molecules through their local relaxation. The second component ΔE2 initially shows a gradual increase starting from 340 cm−1 and reaches a plateau of ≈650 cm−1 at the emission maximum of 338 nm, then becoming nearly independent of the probe surface locations as well as its local protein properties. This result is striking and must reflect a complete detection of the “intrinsic” solvation (≈650 cm−1) from large collective water motion in the hydration layer, a process of hydration water restructuring assisted by local protein fluctuations. As demonstrated in our recent MD simulations (27) and shown in Staphylococcus nuclease (25), the small protein fluctuations themselves on the time scale of labile hydration do not make significant contributions to total solvation. The three regions (I, II, and III), which we divided according to the increasing trend of ΔE2, are exactly correlated to the well known tryptophan locations with emission peaks in the protein (31), i.e., from the buried below 330 nm, to the partially buried from 330 to 338 nm, and to the fully exposed at longer than 338 nm. For all these locations, because of different local protein properties, the maximum deviation along the general trend is ±125 cm−1 for ΔE1 and ±75 cm−1 for ΔE2.
Time Scales, Correlations, and Water–Protein Fluctuations.
The Stokes shift is the result of an integration of hydration processes but has no direct information on the dynamics. For example, both mutants of A84W and E41W have the similar Stokes shifts, but, as shown in Fig. 5 A and B, the dynamics are drastically different: 2.2 and 38 ps for the former and 6.4 and 192 ps for the latter. For τ1, the ultrafast dynamics represent fundamental motions of local water molecules, mainly, libration and hindered rotation. Compared with bulk water (32), the time scale of 1–8 ps is one order of magnitude longer, revealing different water structures and H-bond rigidity around the protein surface, which highly relates to local protein properties and directly reflects water–protein electrostatic interactions. According to the x-ray structure (28), we classified 16 mutants in the native state into several surface patterns such as the loop region and various charge patches (Fig. 5A). Each class covers a certain time regime. For example, the fastest motion in 1–2 ps (H48W, A57W, and T95W) is from the water molecules around the flexible loops, and these water molecules are less structured. The slow relaxation in 6–7 ps (G23W and E41W) is caused by the dense charged residues on the surface, and the water molecules are tightly clustered. The water motion at the hydrophobic area near a concave geometry (A71W) takes ≈4 ps. Also, along the A-helix, the probes (H12W, A15W, and W14), buried inside the proteins, report even slower dynamics, indicating the main probing of bound water molecules near the protein. For each class, the dynamics are correlated with the emission maxima (i.e., the longer emission the shorter τ1), which is caused by probing more and more mobile water molecules when tryptophan moves to the protein surface. These results show a strong correlation of the initial water dynamics with the local protein structures, chemical identities of residues, and probe locations. For the similar probe exposure, the time scales over 1–8 ps directly reflect local H-bond network rigidity on the protein surface.
The second hydration dynamics (τ2) in the layer represents subsequent water network rearrangements after the initial fast relaxation. On tens to hundreds of picoseconds, the protein fluctuates and the hydration water undergoes dynamic exchange with bulk water. Thus, such network restructuring couples with local protein fluctuations and convolutes with the exchange dynamics. We divided 16 mutants into three groups, and Fig. 5B shows the correlation of the second water dynamics with local protein properties. Around four compact charge locations (G23W, A74W, E41W, and A144W), the relaxation takes the longest times in 133–209 ps because the water molecules are highly attracted by the local dense charges, as shown in Fig. 3A for A144W surrounded by five charged residues. Along the A-helix, the four mutants (W7, A15W, H12W, and W14) surprisingly report a similar time scale of 87–103 ps, reflecting the “inherent” dynamics of the coupled water–protein relaxation around the A-helix region. Furthermore, for all other mutants we observed a correlation between the dynamics and local protein structural rigidity from T95W to H113W (Fig. 5B). For example, the mutants in the loop regions such as T95W and A57W have the shortest relaxation time of 20 ps. With the increased rigidity of secondary and tertiary structures from A127W to H113W, the water–protein coupling motion gets longer and longer from 50 ps to 70 ps. All of the second hydration dynamics has a wide correlation with the initial relaxation (Fig. 5B Inset), indicating that the network restructuring depends not only on H-bond network flexibility but also on local protein properties.
Hydration Dynamics in Molten Globular State.
In the molten globular state, NMR studies (29, 33, 34) have shown that the hydrophobic core is almost formed by three helices of A, G, and H. Except for A57W mutant, the two hydration dynamics for all other mutants become faster, indicating that both the H-bond water networks and the protein become more flexible and less structured. As shown in Fig. 3 for several typical cases, the dynamics show the structural changes of hydration water and local protein from the native to molten globular states. For A144W, the dense charge distribution and well structured H-helix result in the slowest coupled water motion (209 ps), but in the molten globular state, the H-helix region near the C-terminal melts into a less structured random coil (33). The tryptophan is fully exposed to water (349.7 nm emission peak), and the relaxation becomes much faster. With dense charges around, it takes 53 ps. For W14 mutant on A-helix, the probe is buried inside the protein, and we observed the similar dynamics in the two states, indicating that the hydrophobic core around the probe has been formed at pH4, consistent with the NMR results (29, 33). For H113W mutant, the partial B-helix structure melts down (34), and the local structure becomes flexible, resulting in much faster coupled water–protein relaxation. For A57W mutant, the hydration dynamics in the native state are much faster in 1.4 and 24 ps because of the flexible structure at the end of the D-helix. However, in the molten globular state, the D-helix extends longer (34), resulting in a more rigid local structure around the probe and thus longer relaxation dynamics in 1.7 and 48 ps. Therefore, the probing of hydration dynamics can give structural information of proteins in the molten globule state.
Conclusion
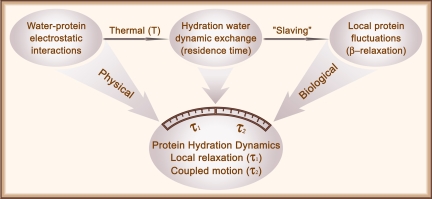
The robust observation of surface hydration dynamics on two time scales and a series of correlations provide a molecular picture of water motions and their coupling with protein fluctuations in the layer, as shown in Fig. 6. The dynamic exchange of hydration layer water with outside bulk water occurs on the picosecond time scales (residence time), and such water thermal fluctuations “slave” local protein motions, especially for side chains, a process similar to the β-relaxation in glasses (35, 36). The hydration dynamics reported here represent the fluctuations of ordered water molecules inside the layer. The first ultrafast dynamics in a few picoseconds is directly from fundamental physical motions of water network at the local positions. Such cooperative H-bond motions are determined mainly by water–protein electrostatic interactions. On a longer time, the collective water network rearrangements in the layer strongly couple with protein fluctuations, all facilitated by bulk-water dynamic exchange. These dynamic processes are biologically relevant and significant and now shown to occur on tens to hundreds of picoseconds. Thus, the dynamics of protein surface hydration uniquely bridge ultrafast bulk-water motions and slaved protein fluctuations and perform a biological functional role in maintaining protein's intact structure and flexibility, lubricating its various recognitions, and mediating a variety of catalytic reactions in enzymatic function.
Fig. 6.
Schematic representation of the mechanism of protein surface hydration. The fundamental electrostatic interaction between water and protein is the key for hydration layer formation. Under thermal fluctuation, the hydration layer water is in dynamic exchange with bulk water (residence time). Such water fluctuations in and out control local protein motions (35, 36). The hydration dynamics reported here represent two types of collective water fluctuations inside the layer: initial fundamental physical motion of libration and rotation and subsequent network restructuring coupled with slaved protein motions, a dynamic process of biologically relevant water–protein interactions.
Methods
Femtosecond Methods.
All of the femtosecond-resolved measurements were carried out by using a fluorescence up-conversion method. The integrated experimental setup has been described elsewhere (30). Briefly, the femtosecond pulse after the two-stage amplifier (Spitfire; Spectra-Physics) has a temporal width of 110 fs centered at 800 nm with an energy of more than 2 mJ per pulse and a repetition rate of 1 kHz. Half of the laser energy was used to pump an optical parametric amplifier (OPA-800C; Spectra-Physics) to generate signal (1,289 nm) and idler (2,109 nm) beams. The latter was mixed with the residual fundamental (800 nm) in a 0.2-mm-thick β-barium borate (BBO) crystal (type I) to generate a femtosecond pulse at 580 nm. This femtosecond pulse, compressed through a pair of prisms with double paths to reach a temporal resolution of 60 fs, was frequency-doubled to generate our pump wavelength at 290 nm by another 0.2-mm-thick BBO crystal. The pump pulse energy typically was attenuated to 100–140 nJ before being focused into the motor-controlled rotating sample cell. The fluorescence emission was collected by a pair of parabolic mirrors and mixed with a gating pulse from another half of fundamental beam (attenuated) in a 0.2-mm BBO crystal through a noncollinear configuration. The up-converted signal ranging from 218 to 292 nm was detected by a photomultiplier coupled with a double-grating monochromator. The instrument response time under the current noncollinear geometry is between 400 fs and 500 fs as determined from the up-conversion signal of Raman scattering of water ≈320 nm. For all studies, the pump-beam polarization was set at a magic angle (54.7°) with respect to the acceptance axis (vertical) of the up-conversion crystal, and the polarization of the gating beam was set parallel to this axis through a half-wave plate.
Mutant Protein Preparation, Characterization, and Selection.
Sperm whale myoglobin is a 17.7-kDa globular protein consisting of eight helical segments, namely A–H, as shown in Fig. 1. Among 153-aa residues, there are two intrinsic tryptophan residues, W7 and W14, in the A-helix. To achieve site-specific detection, we need only one Trp residue in each mutant. As the first step, we mutated tryptophan by tyrosine one at a time, and two mutant proteins W7Y (W14) and W14Y (W7) were obtained. The plasmid pMb122, containing sperm whale myoglobin gene, was generously provided by Stephen Sligar's group at the University of Illinois at Urbana–Champaign. To place a single tryptophan in other helices on the surface, we first mutated out both tryptophans (W7 and W14) in the A-helix. The double mutation of W7YW14F was prepared, as also reported recently by another group (37). This mutant is well overexpressed and stable. We also were aware of incorrect folding structures of other double mutations if using other residue combinations such as W7FW14F, W7YW14Y, and W7FW14Y (37). We did test the mutant W7YW14Y, and the expression yield was extremely low.
Triple mutation was designed carefully to place tryptophan in each helix by using the double mutation W7YW14F as a template. We carefully considered the following factors in the design of mutants. (i) The replaced residue has no hydrogen bonding with neighboring residues to avoid a change of structure and stability (38). (ii) The replacing tryptophan is not in proximity of potential quenching residues such as histine and cysteine (39). (iii) The local topography is flat, concave, or convex to examine geometric effects (40). (iv) The local chemical identity is hydrophilic (polar or charged) or hydrophobic to examine electrostatic interactions (41). (v) The distinct water residence times are selected for different mutated locations from recent MD simulations for all 297 hydration sites (42). (vi) Finally, the structural stability of other mutants from various previous studies (43–45).
All of the mutants were expressed in Escherichia coli and purified mainly following the procedures described in ref. 46. The prosthetic heme group was removed (47), and all apoMb mutants were screened for their tryptophan lifetimes. We observed significant quenching of excited-state tryptophan in mutants of K34W. K87W, A125W, and G129W. The final selected 16 mutant proteins, shown in Fig. 1, all have tryptophan lifetimes significantly longer than solvation times for mapping hydration dynamics of the protein surface.
The structures of apoMb mutants were examined by measurements of their CD spectra to verify the appropriate folding. The CD spectra of the mutants in Fig. 3 as well as the wild type are shown in SI Fig. 9. For each mutant, more than 70 mg of protein was prepared. The protein was dissolved in the buffer of 10 mM sodium acetate at pH 6.1 for native state and at pH 4.0 for molten globule state. The protein concentration used in femtosecond-resolved studies was 200–300 μM. All apoMb samples were made fresh for femtosecond studies, and they also are stable for 2–3 days when stored at 4°C. All of the femtosecond-resolved fluorescence transients were collected at 22°C. To ensure that no change of the protein quality during data acquisition has occurred, we measured the protein fluorescence emission before and after experiments. We also kept the sample in a rotating cell to minimize possible photobleaching.
Construction of Solvation Correlation Functions.
Briefly, all femtosecond-resolved fluorescence transients of tryptophan can be represented as a sum of two terms of discrete exponential functions:
where the first term associated with αi and τi describes solvation processes and the second term associated with βj and τj represents intrinsic lifetime emissions (population decay). The coefficient αi is positive (decay dynamics) at the blue side of the emission peak and is negative (initial rise) at the red side. The coefficient βj always is positive and represents relative contributions of lifetime emissions. Thus, the overall time-resolved emission spectra can be constructed as follows:
 |
where Iλss is the relative steady-state emission intensity at wavelength λ. The time-resolved spectrum, after being converted to intensity versus frequency in cm−1, was fitted to a log-normal function to deduce the emission maximum νs(t). Thus, a function of emission maxima with time can be obtained. In a similar manner, the time-resolved lifetime-associated emission spectra can be constructed by
 |
The emission maximum νl(t) also is deduced from a log-normal fit of the spectrum. By subtracting the lifetime-associated emission contribution νl(t) from the overall emission maximum νs(t) and solvent response function can be constructed as follows:
We totally studied 16 mutants, with at least one mutant in each helix. All of the solvation correlation functions show a robust double exponential decay
All fitting results and relevant parameters are given in SI Table 1.
Supplementary Material
Acknowledgments
We thank Profs. Ahmed H. Zewail (California Institute of Technology), Sherwin Singer (Ohio State University), Ciriyam Jayaprakash (Ohio State University), and B. Montgomery Pettitt (University of Houston, Houston, TX) for the stimulating discussions and constructive comments. We also thank Prof. Stephen Sligar (University of Illinois at Urbana–Champaign) for generously providing us the myoglobin plasmid (pMb122), Prof. Dehua Pei (Ohio State University) for providing use of his biochemical facility for preparing partial protein samples, Dr. Wenyun Lu and Jongjoo Kim for the initial help with the experiments, and Tanping Li and Ali Hassanali for helpful discussions. This work was supported in part by the National Science Foundation, the Packard Foundation Fellowship, and the Petroleum Research Fund.
Abbreviation
- apoMb
apomyoglobin.
Footnotes
The authors declare no conflict of interest.
This article is a PNAS Direct Submission.
This article contains supporting information online at www.pnas.org/cgi/content/full/0707647104/DC1.
References
- 1.Pal SK, Zewail AH. Chem Rev. 2004;104:2099–2123. doi: 10.1021/cr020689l. [DOI] [PubMed] [Google Scholar]
- 2.Wüthrich K. Angew Chem Int Ed. 2003;42:3340–3363. doi: 10.1002/anie.200300595. [DOI] [PubMed] [Google Scholar]
- 3.Levy Y, Onuchic JN. Annu Rev Biophys Biomol Struct. 2006;35:389–415. doi: 10.1146/annurev.biophys.35.040405.102134. [DOI] [PubMed] [Google Scholar]
- 4.Mattos C. Trends Biochem Sci. 2002;27:203–208. doi: 10.1016/s0968-0004(02)02067-4. [DOI] [PubMed] [Google Scholar]
- 5.Garczarek F, Gerwert K. Nature. 2006;439:109–112. doi: 10.1038/nature04231. [DOI] [PubMed] [Google Scholar]
- 6.Lin J, Balabin IA, Beratan DN. Science. 2005;310:1311–1313. doi: 10.1126/science.1118316. [DOI] [PMC free article] [PubMed] [Google Scholar]
- 7.Zhou R, Huang X, Margulis CJ, Berne BJ. Science. 2004;305:1605–1609. doi: 10.1126/science.1101176. [DOI] [PubMed] [Google Scholar]
- 8.Burling FT, Weis WI, Flaherty KM, Brünger AT. Science. 1996;271:72–77. doi: 10.1126/science.271.5245.72. [DOI] [PubMed] [Google Scholar]
- 9.Israelachvili J, Wennerström H. Nature. 1996;379:219–225. doi: 10.1038/379219a0. [DOI] [PubMed] [Google Scholar]
- 10.Raschke TM. Curr Opin Struct Biol. 2006;16:152–159. doi: 10.1016/j.sbi.2006.03.002. [DOI] [PubMed] [Google Scholar]
- 11.Daniel RM, Finney JL, Stoneham M. Phil Trans R Soc London B. 2004;359:1143. [Google Scholar]
- 12.Bryant RG. Annu Rev Biophys Biomol Struct. 1996;25:29–53. doi: 10.1146/annurev.bb.25.060196.000333. [DOI] [PubMed] [Google Scholar]
- 13.Otting G, Liepinsh E, Wüthrich K. Science. 1991;254:974–980. doi: 10.1126/science.1948083. [DOI] [PubMed] [Google Scholar]
- 14.Wüthrich K, Billeter M, Güntert P, Luginbühl P, Riek R, Wider G. Faraday Discuss. 1996;103:245–253. [Google Scholar]
- 15.Bagchi B. Chem Rev. 2005;105:3197–3219. doi: 10.1021/cr020661+. [DOI] [PubMed] [Google Scholar]
- 16.Bizzarri AR, Cannistraro S. J Phys Chem B. 2002;106:6617–6633. [Google Scholar]
- 17.Makarov V, Pettitt BM, Feig M. Acc Chem Res. 2002;35:376–384. doi: 10.1021/ar0100273. [DOI] [PubMed] [Google Scholar]
- 18.Tarek M, Tobias DJ. Phys Rev Lett. 2002;88:138101. doi: 10.1103/PhysRevLett.88.138101. [DOI] [PubMed] [Google Scholar]
- 19.Zhong D, Pal SK, Zhang D, Chan SI, Zewail AH. Proc Natl Acad Sci USA. 2002;99:13–18. doi: 10.1073/pnas.012582399. [DOI] [PMC free article] [PubMed] [Google Scholar]
- 20.Pal SK, Peon J, Zewail AH. Proc Natl Acad Sci USA. 2002;99:1763–1768. doi: 10.1073/pnas.042697899. [DOI] [PMC free article] [PubMed] [Google Scholar]
- 21.Peon J, Pal SK, Zewail AH. Proc Natl Acad Sci USA. 2002;99:10964–10969. doi: 10.1073/pnas.162366099. [DOI] [PMC free article] [PubMed] [Google Scholar]
- 22.Cohen BE, McAnaney TB, Park ES, Jan YN, Boxer SG, Jan LY. Science. 2002;296:1700–1703. doi: 10.1126/science.1069346. [DOI] [PubMed] [Google Scholar]
- 23.Qiu W, Zhang L, Kao Y-T, Lu W, Li T, Kim J, Sollenberger GM, Wang L, Zhong D. J Phys Chem B. 2005;109:16901–16910. doi: 10.1021/jp0511754. [DOI] [PubMed] [Google Scholar]
- 24.Qiu W, Zhang L, Okobiah O, Yang Y, Wang L, Zhong D, Zewail AH. J Phys Chem B. 2006;110:10540–10549. doi: 10.1021/jp055989w. [DOI] [PubMed] [Google Scholar]
- 25.Qiu W, Kao Y-T, Zhang L, Yang Y, Wang L, Stites WE, Zhong D, Zewail AH. Proc Natl Acad Sci USA. 2006;103:13979–13984. doi: 10.1073/pnas.0606235103. [DOI] [PMC free article] [PubMed] [Google Scholar]
- 26.Qiu W, Wang L, Lu W, Boechler A, Sanders DAR, Zhong D. Proc Natl Acad Sci USA. 2007;104:5366–5371. doi: 10.1073/pnas.0608498104. [DOI] [PMC free article] [PubMed] [Google Scholar]
- 27.Li T, Hassanali AA, Kao Y-T, Zhong D, Singer SJ. J Am Chem Soc. 2007;129:3376–3382. doi: 10.1021/ja0685957. [DOI] [PubMed] [Google Scholar]
- 28.Phillips SEV, Schoenborn BP. Nature. 1981;292:81–82. doi: 10.1038/292081a0. [DOI] [PubMed] [Google Scholar]
- 29.Hughson FM, Wright PE, Baldwin RL. Science. 1990;249:1544–1548. doi: 10.1126/science.2218495. [DOI] [PubMed] [Google Scholar]
- 30.Lu W, Kim J, Qiu W, Zhong D. Chem Phys Lett. 2004;388:120–126. [Google Scholar]
- 31.Lakowicz JR. Principles of Fluorescence Spectroscopy. New York: Kluwer Academic/Plenum; 1999. [Google Scholar]
- 32.Jimenez R, Fleming GR, Kumar PV, Maroncelli M. Nature. 1994;369:471–473. [Google Scholar]
- 33.Eliezer D, Yao J, Dyson HJ, Wright PE. Nat Struct Biol. 1998;5:148–155. doi: 10.1038/nsb0298-148. [DOI] [PubMed] [Google Scholar]
- 34.Eliezer D, Chung J, Dyson HJ, Wright PE. Biochemistry. 2000;39:2894–2901. doi: 10.1021/bi992545f. [DOI] [PubMed] [Google Scholar]
- 35.Fenimore PW, Frauenfelder H, McMahon BH, Young RD. Proc Natl Acad Sci USA. 2004;101:14408–14413. doi: 10.1073/pnas.0405573101. [DOI] [PMC free article] [PubMed] [Google Scholar]
- 36.Frauenfelder H, Fenimore PW, Chen G, McMahon BH. Proc Natl Acad Sci USA. 2006;103:15469–15472. doi: 10.1073/pnas.0607168103. [DOI] [PMC free article] [PubMed] [Google Scholar]
- 37.Sirangelo I, Tavassi S, Martelli PL, Casadio R, Irace G. Eur J Biochem. 2000;267:3937–3945. doi: 10.1046/j.1432-1327.2000.01401.x. [DOI] [PubMed] [Google Scholar]
- 38.Henning M, Geierstanger BH. J Am Chem Soc. 1999;121:5123–5126. [Google Scholar]
- 39.Chen Y, Barkley MD. Biochemistry. 1998;37:9976–9982. doi: 10.1021/bi980274n. [DOI] [PubMed] [Google Scholar]
- 40.Cheng YK, Rossky PJ. Nature. 1998;392:696–699. doi: 10.1038/33653. [DOI] [PubMed] [Google Scholar]
- 41.Gu W, Schoenborn BP. Proteins. 1995;22:20–26. doi: 10.1002/prot.340220104. [DOI] [PubMed] [Google Scholar]
- 42.Makarov VA, Andrews BK, Smith PE, Pettitt BM. Biophys J. 2000;79:2966–2974. doi: 10.1016/S0006-3495(00)76533-7. [DOI] [PMC free article] [PubMed] [Google Scholar]
- 43.Rohlfs RJ, Mathews AJ, Carver TE, Olson JS, Springer BA, Egeberg KD, Sligar SG. J Biol Chem. 1990;265:3168–3176. [PubMed] [Google Scholar]
- 44.Egeberg KD, Springer BA, Sligar SG, Carver TE, Rohlfs RJ, Olson JS. J Biol Chem. 1990;265:11788–11795. [PubMed] [Google Scholar]
- 45.Nguyen BD, Zhao X, Vyas K, La Mar GN, Lile RA, Brucker EA, Phillips GN, Jr, Olson J, Wittenberg JB. J Biol Chem. 1998;273:9517–9526. doi: 10.1074/jbc.273.16.9517. [DOI] [PubMed] [Google Scholar]
- 46.Springer BA, Sligar SG. Proc Natl Acad Sci USA. 1987;84:8961–8965. doi: 10.1073/pnas.84.24.8961. [DOI] [PMC free article] [PubMed] [Google Scholar]
- 47.Teale FWJ. Biochim Biophys Acta. 1959;35:543. doi: 10.1016/0006-3002(59)90407-x. [DOI] [PubMed] [Google Scholar]
Associated Data
This section collects any data citations, data availability statements, or supplementary materials included in this article.


