

Abstract
Recent studies suggest accurate prediction of tissue of origin for human cancers can be achieved by applying sophisticated statistical learning procedures to gene expression data obtained from DNA microarrays. We have pursued the hypothesis that a more straightforward and equally accurate strategy for classifying human tumors is to use a simple algorithm that considers gene expression levels within a tree-based framework that encodes limited information about pathology and tissue ontogeny. By considering gene expression data within this framework, we found only a small number of genes were required to achieve a relatively high accuracy level in tumor classification. Using as few as 45 genes we were able to classify 157 of 190 human malignant tumors correctly, which is comparable to previous results obtained with sophisticated classifiers using thousands of genes. Our simple classifier accurately predicted the origin of metastatic tumors even when the classifier was trained using only primary tumors, and the classifier produced accurate predictions when trained and tested on expression data from different labs, and from different microarray platforms. Our findings suggest that accurate and robust cancer diagnosis from gene expression profiles can be achieved by mimicking the classification strategies routinely used by surgical pathologists.
A number of surveys of gene expression in diverse panels of human malignancies have recently been performed using DNA microarrays. 1-5 A question that has been pursued by several investigators is whether the tissue of origin of a neoplasm can be predicted based only on the measured gene expression levels. Although it may be debated whether molecular approaches are needed to improve the accuracy of diagnosis for the majority of primary neoplasms, there are likely to be several clinical settings in which gene expression analysis could have significant impact. For instance, transcriptional profiling may prove to be a valuable aid in the diagnosis of presumptive metastatic tumors when a primary tumor site cannot readily be identified through routine diagnostic and imaging studies, or when primary tumor material is not available. In addition to assessing the potential diagnostic utility of gene expression analyses, better understanding of the gene expression patterns in a diverse panel of cancer specimens may have the potential to offer new and unexpected insights into cancer pathogenesis.
In the work published to date, a variety of statistical learning methods have been investigated to assess the feasibility of using gene expression measurements for molecular classification of cancer. 1-6 The methods range from the elementary, such as nearest neighbor algorithms (KNN), to classical methods such as linear discriminant analysis, to modern and sophisticated methods such as neural networks and support vector machines. A common feature of the methods, at least insofar as they are applied in the cited works, is that they base their predictions entirely on the microarray measurements, without incorporating knowledge about the relationships between tumor types derived from decades of histopathological analysis, ie, they do not exploit a basic biological understanding of morphology or tumor ontogeny. Moreover, the methods listed above, especially when applied to multiple-class problems, are black box in nature, meaning that it is difficult to understand the internal information processing that is used to form the prediction.
Here we propose a different strategy for the molecular classification of human malignant neoplasms. A key feature of our approach is to incorporate a simple tree-based framework based on tumor ontogeny into the classifier. This framework is used in a sequential coarse-to-fine classification strategy, in which coarse decisions (such as whether a neoplasm is solid or hematolymphoid) are made first, and more specific decisions follow. Decomposing the classification question into a sequence of narrow decisions permits different sets of genes to be used for each decision, allowing a gene to inform the classifier in a way that is consistent with its mechanistic role. For each individual decision in the sequence, we use a simple nearest neighbor predictor. All genes referenced by the classifier are individually interpretable as potential markers for common pathological classes (eg, epithelial tumors). The internal mechanism of our classifier is therefore transparent and straightforward. The incorporation of the pathological tree into our classifier also brings our computational method into line with clinical practice, as the ontogenetic relationships encoded in the tree form the basis for many diagnostic strategies routinely used by pathologists to diagnose neoplasms of unknown type or origin.
We report that our simple classifier that considers gene expression levels within a framework reflecting basic tumor ontogeny achieved better error rates than are obtained with sophisticated methods of statistical learning that do not exploit this information. Furthermore, the classifier was trained on data from one laboratory and gave accurate predictions for samples processed in a different laboratory, even when a different microarray platform was used for analysis of the specimens. Finally, because of its simple structure, the classifier allows a post hoc analysis of misclassified tumors to identify the basis for failure. Analysis of the misclassified neoplasms yielded interesting observations on gene expression in atypical tumors. For example, at least one ovarian tumor was discovered to have unusual gene expression characteristics that were not appreciated at initial diagnosis.
Materials and Methods
Microarray Data Sets
We used three microarray data sets (Table 1) ▶ that previously have been used to study cancer diagnosis algorithms. 1-3 The data originally analyzed in one of these studies 1 were obtained from www-genome.wi.mit.edu/MPR/GCM.html. Henceforth, we refer to these as the Whitehead data. The Whitehead data consist of three sets covering 14 tumor types: 1) a main set containing 190 primary tumors (including several poorly differentiated tumors), 2) an independent set containing 20 poorly differentiated tumors, and 3) a set of 8 metastatic tumors. The set of 190 malignant tumors was comprised of samples from 14 sites of origin (or tumor type in the case of lymphoma and leukemia), as follows: breast (n = 11), prostate (n = 10), lung (n = 11), colon (n = 11), lymphoma (n = 22), melanoma (n = 10), bladder (n = 11), uterus (n = 10), leukemia (n = 30), kidney (n = 11), pancreas (n = 11), ovary (n = 11), mesothelioma (n = 11), and central nervous system (CNS) (n = 20). Note that the specimens in the Whitehead data were originally assigned to 17 tumor classes, but in previous work the two subtypes for each of lymphoma, leukemia, and CNS were combined, leading to the 14 tumor classes that we analyzed here. The set of transcripts considered in the Whitehead study 1 were obtained by combining the transcripts from the Affymetrix (Santa Clara, CA) HuGeneFL and Hu35KsubA microarrays. Experimental protocols and low-level processing were previously described. 1
Table 1.
Tumors Used for DNA Microarray Analysis
| MIT*† | MIT-PD*† | MIT-MET*† | UM* | UVA‡ | |
|---|---|---|---|---|---|
| Breast | 11 | 5 | 1 | 0 | 26 |
| Prostate | 10 | 0 | 4 | 0 | 26 |
| Lung | 11 | 8 | 1 | 91 | 14 |
| Colon | 11 | 3 | 1 | 60 | 23 |
| Lymphoma | 22 | 0 | 0 | 0 | 0 |
| Melanoma | 10 | 0 | 0 | 0 | 0 |
| Bladder | 11 | 0 | 0 | 0 | 8 |
| Uterus | 10 | 1 | 0 | 6 | 0 |
| Leukemia | 30 | 0 | 0 | 0 | 0 |
| Kidney | 11 | 0 | 0 | 0 | 11 |
| Pancreas | 11 | 0 | 0 | 10 | 60 |
| Ovary | 11 | 3 | 1 | 113 | 27 |
| Mesothelioma | 11 | 0 | 0 | 0 | 0 |
| CNS | 20 | 0 | 0 | 73 | 0 |
| Total | 190 | 20 | 8 | 353 | 141 |
*Denotes data from Affymetrix HuGeneFL microarrays.
†Denotes data from Affymetrix Hu35KSubA microarrays.
‡Denotes data from Affymetrix HG-U95Av2 microarrays.
The data originally analyzed by Giordano and colleagues 2 were collected at the University of Michigan (UM) using Affymetrix HuGeneFL microarrays. Here we considered a superset of the samples previously analyzed, comprised of the following types of tumors: uterine (n = 6), ovarian (n = 113), 7 lung (n = 91), 8 colon (n = 60), 2 pancreas (n = 10), and CNS (n = 73). 9 Henceforth we will refer to this as the UM data. Transcript-level data summaries were prepared as described. 2 These data are available at http://dot.ped.med.umich.edu:2000/pub/Classify/index.html.
The data originally analyzed by Su and colleagues 3 were obtained from www.gnf.org/cancer/epican. We used data on the 141 tumors representing the 14 sites of origin in the Whitehead data, giving the following breakdown of tumors: breast (n = 26), prostate (n = 26), lung (n = 14), colon (n = 23), bladder (n = 8), kidney (n = 11), pancreas (n = 6), and ovary (n = 27). These data, which we refer to as the UVA (University of Virginia) data, were obtained using the Affymetrix HG-U95Av2 microarray. Transcript-level data summaries were prepared as described. 3
It is worth noting that all three gene expression profiling groups used similar tissue processing protocols in which the tissues were examined histologically and selected for DNA microarray analysis only if the samples were rich in malignant cells and relatively free of normal elements.
For all expression data sets, we eliminated the Affymetrix control genes, logarithmically transformed all of the data using log[max(X, 0) + 50], and removed all genes having SD less than 0.7. The three Affymetrix microarrays that produced the data analyzed here include probe sets for different sets of transcripts. For each comparison that we made, we used the largest set of transcripts that were measured on all arrays involved in the comparison. Thus, when comparing the Whitehead data to itself, all HuGeneFL and Hu35KsubA probe sets were used. When comparing the Whitehead and UM data sets, all HuGeneFL probe sets were used. When comparing the Whitehead and UVA data sets, probe sets on the HuGeneFL and HG-U95Av2 microarrays corresponding to the same gene were used. Note that for the third comparison, although the selected probe sets correspond to the same Unigene cluster, the probe sequences on the microarray may differ.
Representing Morphological and Developmental Relationships
We represent a hierarchy of developmental/morphological relationships among the various malignant tumor classes using a tree diagram (Figure 1) ▶ . Each node of the tree represents a family of related tumors, with the lower nodes representing more homogeneous classes of tumors than the nodes higher in the tree. We use the terms “parent node” and “child node” to refer to a pair of adjacent nodes in which the parent node is one level above the child node. The term “interior node” will refer to a node that has at least one child as opposed to a “terminal node” that has no child. The nodes were selected to represent major morphological divisions that are both relevant to tissue of origin and that we expect to be predictable from gene expression. The tree was constructed before any reference to the microarray data based on an accepted classification of human tumors and was not in any way fit to the expression data.
Figure 1.

A tree representation of developmental/morphological relationships among 14 tumor classes. Samples of unknown origin are classified by working from the root node down, placing the sample in one of the child nodes at each split based on the expression of specific marker genes.
Marker Gene Selection
The key step in training our classifier is the selection of a set of genes that are informative for distinguishing among the child nodes at each split in the tree. Consistent with current practice in pathology, we focused on marker genes that are highly expressed in one tumor class relative to one or more different tumor classes. Specifically, we were interested in markers that are highly expressed in one node of the tree compared to all other nodes that have the same parent. For example, we needed gene markers that are highly expressed in epithelial tumors relative to mesothelioma, CNS, and melanoma tumors (Figure 1) ▶ . However, these markers do not need to be highly expressed in epithelial tumors relative to hematolymphoid malignancies. Genes with specifically high expression in one child of a given parent node are identified using the difference between group means in logarithmically transformed data. The difference is computed between the specified child node and the pooled mean for all other children of the same parent. This is essentially the fold change ratio between mean expression levels on the untransformed scale. Thus in the above example, we consider a gene to be a marker for epithelial tumors if the average log-scale expression in all epithelial tumors is high relative to the average expression in all mesotheliomas, CNS, and melanoma tumors (taken as a group). We used a fixed number of genes for each child node (K), and will consider values of K ranging from 1 to 1000. The marker genes for all child nodes with the same parent were pooled together to form a marker set associated with one split in the tree. For example, the markers for mesothelioma, epithelial cancer, CNS, and melanoma, are pooled together to create a set of genes that are informative for splitting at the solid node of the tree. The tree (Figure 1) ▶ has 19 child nodes (in the 14 class problem), so 19 sets of K genes are considered by the classifier. However, because there is substantial overlap in the marker genes for different child nodes, the total number of distinct genes used by the classifier is substantially smaller than 19K.
Applying the Classifier to a Sample
Once the classifier is trained by selecting the marker genes, the tissue of origin for a test sample is predicted by running the sample down the tree. That is, working from the root node down, a sequence of decisions is made, placing the test sample in one of the child nodes at each level of the tree. For example, a correctly predicted colon cancer sample would move from all tumors to solid to epithelial to non-Mullerian to colon. If an error is made in any of these decisions, the prediction will be incorrect. The decision at each node is made using a simple nearest neighbor decision based on the markers identified as described above. Correlation coefficients over the marker genes between the test sample and every training sample are computed, and the classes for the five training samples with greatest correlation are considered. The class to which the greatest number of these five samples belongs is the predicted class for the test sample. If there is a tie, the class corresponding to the greatest correlation is used as the prediction.
The number of marker genes whose expression levels are referred to in classifying a tumor depends on the path that the tumor takes through the tree. In general, a shorter path will refer to fewer marker genes, so, for instance, a call for CNS or leukemia will reference fewer genes than a call for lung or colon. To some degree, this reflects intrinsic differences in the level of difficulty of classifying various malignancies. For example, CNS tumors are readily identified by referring to just a few genes, but because the various epithelial tumors are relatively similar to each other, a larger set of genes must be referenced to make a confident call. The ability of our algorithm to adaptively vary the number of genes that are referenced depending on the difficulty of the decision is not shared by other learning algorithms such as support vector machines, in which a fixed set of markers are referenced for all samples. When we report the performance of our classifier as the error rate for a given number of genes, we report both the total number of distinct genes referenced for all classes and the average number of genes referenced per individual specimen.
Error Rate Estimation
Error rates for the Whitehead data are estimated using cross validation and training/test set validation. In cross validation, each specimen is held out in sequence, and the remaining specimens are used to train the classifier (ie, they are used to select the marker genes and as the comparison set for the nearest neighbor analysis). Then the class of the held out sample is predicted and compared to its actual class. The percentage of incorrectly classified samples is reported as the error rate. In the training/test set validation the 190 primary malignancies in the Whitehead data set were combined with the 8 metastases to produce a set of 198 malignancies, which was then subdivided (in the same way as in Ramaswamy et al 1 ) into 144 training samples and 54 testing samples. The training set contained a minimum of eight instances of every tumor class. All eight metastases were placed in the test set. The classifier was trained on the training set, and applied to each sample in the test set. The percentage of incorrectly classified samples in the test set is reported as the error rate. To determine the error rates when generalizing from one laboratory to another, we trained the classifier on the 190 primary malignancies from the Whitehead data and then applied the classifier to the UM data and the UVA data. By training we mean that the Whitehead samples are used to identify marker genes, and also serve as the domain of comparison samples for the nearest neighbor analysis. The percentage of incorrect classifications in the UM and UVA data are reported as the “cross-laboratory” and “cross-laboratory/cross-platform” error rates.
Results
We hypothesized that accurate and robust molecular tumor classification, ie, prediction of site of origin, could be achieved with a small number of genes by using a sequential coarse-to-fine approach that classifies tumors into increasingly specific categories before ultimately calling a particular tumor class. For robustness and simplicity, we selected a hierarchy of categories representing a very simple view of morphological relationships that are well established in oncological pathology. Such an approach may offer a critical advantage when the sample size for each tissue of origin is small, because the hierarchical structure of the classifier (the pathological/morphological framework) is predetermined from expert knowledge, and does not need to be trained to the data. Moreover, this approach may better reflect the role of marker genes as differentiation factors, because a key marker gene might be expected to affect the prediction only at the point where it has differentiation-specific relevance to the underlying morphological difference. For instance, we found that extracellular matrix genes influenced the split between solid and hematolymphoid lesions whereas known marker genes for specific epithelial tissues mostly enter at the epithelial split.
Internal Classification Performance
The performance of our classifier when training and testing on the Whitehead data are summarized in the left panel of Figure 2A ▶ . Using cross validation on the Whitehead set of 190 primary malignant tumors, and using the optimal number of genes (244 genes on average for one specimen or 456 genes in total), we achieved 157 of 190 (83%) correct predictions. Using as few as 45 genes on average per specimen (87 distinct genes in total), we classified 150 of 190 (79%) of the tumors correctly. The optimal result reported in Ramaswamy et al 1 was 78% correct predictions, and required more than 10,000 genes. Because the genes referenced by our method in classifying a particular specimen comprised approximately half of the set of distinct genes used for classifying all tumors, substantial benefit resulted from allowing the set of marker genes to vary with the difficulty of classification in a particular branch of the pathological tree (Figure 1) ▶ .
Figure 2.
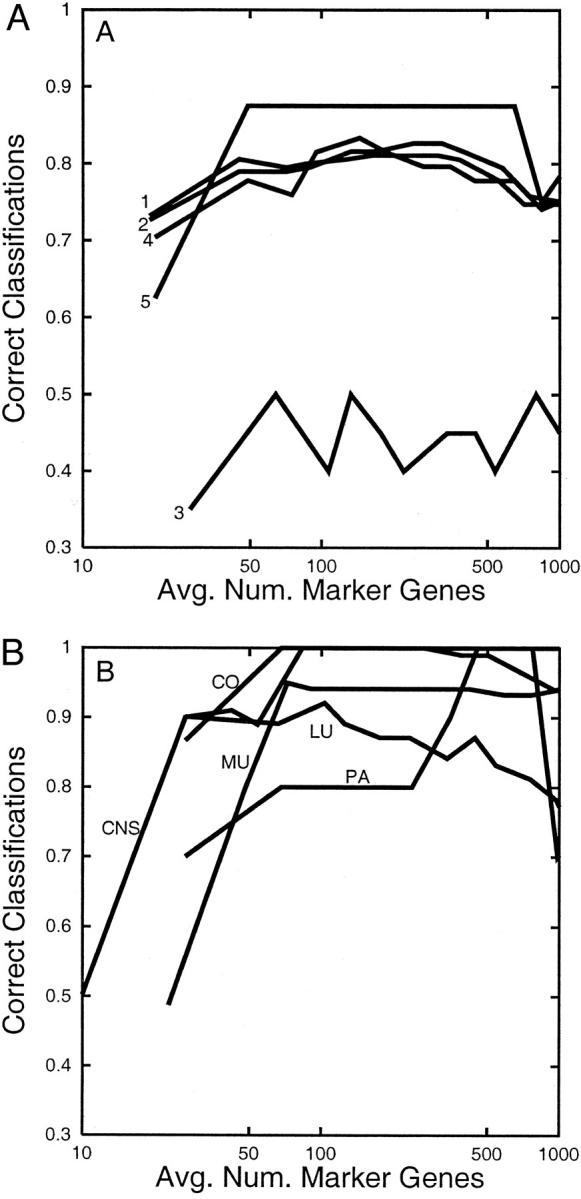
A: Within-laboratory performance of the expert classifier on the Whitehead data. Rates of correct site prediction in the Whitehead data are shown as a function of the average number of genes used to classify a specimen. Rates are shown for 190 samples using cross validation with all probe sets (line 1), 190 samples using cross validation with nonexpressed sequence tag probe sets (line 2), 20 poorly differentiated neoplasms in which training uses only well-differentiated neoplasms and all probe sets (line 3), 46 samples using a 144/46 train/test split and all probe sets (line 4), and 8 metastases using 144 primary training samples and all probe sets (line 5). B: Cross-laboratory performance of our expert classifier when trained on the Whitehead data and tested on the UM data. Each line shows the proportion of correct predictions for a given site [colon (C0), lung (LU), central nervous system (CNS), ovary and uterus (MU), pancreas (PA)], plotted against the average number of genes used to classify a neoplasm.
A distinct unbiased estimate of the prediction rate was obtained by using a training set/testing set comparison instead of cross validation. In this case, the optimal performance of our classifier was 45 of 54 correct predictions, or 83% (145 genes on average per sample or 250 distinct genes overall), which is a similar prediction rate using somewhat fewer genes compared to what was found using cross validation. Because all metastatic tumors were in the testing set, this analysis provides the performance of our method on metastases when only primary tumors are used for training. Using as few as 49 distinct genes, 7 of 8 metastatic tumors (and 42 of 54 tumors overall) were correctly classified.
In addition to thousands of genes accompanied with some degree of annotation, the microarrays used in the Whitehead study 1 included 5844 expressed sequence tags with little or no annotation. We hypothesized that because many important genes characteristic of tissue-specific differentiation have already been annotated, classification performance would not improve substantially by considering the expression levels of expressed sequence tags. Moreover, a classifier built out of well-annotated genes is more interpretable by biologists and the gene expression markers are more likely to be translated into conventional immunohistochemical markers for use by pathologists. Our algorithm produces similar error rates regardless of whether expressed sequence tags are considered (Figure 2) ▶ .
Poorly Differentiated Neoplasms
Several of the 190 tumors in the Whitehead data set were graded as poorly differentiated. In addition, an independent set of 20 poorly differentiated tumors was investigated. 1 In this article, it was reported that classification of poorly differentiated tumors by molecular analysis was no better than random assignment (6 of 20 correct classifications), leading the authors to conclude that poorly differentiated tumors display fundamentally distinct gene expression patterns. Our classifier performed somewhat better on the 20 poorly differentiated tumors than the Whitehead classifier, predicting 10 of 20 specimens correctly, although this performance on poorly differentiated tumors was still markedly poorer than in the larger set of all tumors. However, for 18 of the 20 poorly differentiated tumors, our classifier was able to predict the identity of the tumor correctly to the second level from the bottom of the tree. In other words, poorly differentiated tumors could be accurately classified at a relatively coarse level (eg, Mullerian versus non-Mullerian), but it was difficult to make the final call among a set of closely related tumor types.
Robust Classifier Performance on Distinct Data Sets
A more stringent evaluation of the robustness of a molecular classifier of tumors is to train the classifier on one set of samples and then to test the classifier on an independent set of samples, particularly if the latter set was generated by an independent set of investigators working at a distinct laboratory site and perhaps even using a different microarray platform. One reason for pursuing efforts to assess the robustness of classifier performance on distinct data sets is that even with great care, systematic differences (batch effects) are observed in microarray data obtained in different laboratories. To determine whether batch effects hinder accurate diagnosis with our classifier, we trained our classifier using the Whitehead data set and then applied it to a gene expression data set obtained on an independent set of samples at the UM. The Whitehead data set was selected for training because it covered the broadest range of tumor classes [ie, the 14 classes represented at the bottom of the tree (Figure 1) ▶ ]. The UM tumors belong to a proper subset of these 14 classes. However, the classifier was in fact blinded to this information, so a UM sample could conceivably have been placed into any of the 14 classes in the Whitehead data set. Incidentally, because our classifier uses correlations to compare test data to training data, there is no need to perform a linear rescaling to align data from different platforms. However in future work it may be found that a nonlinear transformation is helpful in removing certain systematic biases between different platforms.
The cross-laboratory performance of our classifier is shown in the right panel of Figure 2 ▶ and in Table 2 ▶ . For a wide range in the number genes used (∼100 to 800), the cross-laboratory error rates were no worse than the within-laboratory error rates reported above (Table 2) ▶ . Using the optimal number of genes for each site, correct predictions were made for 60 of 60 colon tumors, 83 of 91 lung tumors, 10 of 10 pancreas tumors, and 73 of 73 CNS tumors. Considering ovary and uterus as a single class, 113 of 119 tumors were correctly predicted. However, the classifier had difficulty distinguishing ovarian from uterine adenocarcinomas. All of the UM uterine tumors and more than half of the UM ovarian tumors were predicted to be uterine in origin. Evidently, certain genes that reproducibly allowed the ovarian and uterine cancers in the Whitehead data to be distinguished from one another did not generalize to the UM data set. This may be a consequence of differences in histological subtype distribution between the Whitehead and UM groups of ovarian and uterine tumors (ie, inclusion of many endometrioid ovarian carcinomas, as well as serous, clear cell, and mucinous carcinomas in the UM ovarian tumor set).
Table 2.
Cross-Laboratory Performance Using the UM Data
| Tumor type | All tumors, no. correct | All tumors, % correct | PD tumors, no. correct | PD tumors, % correct |
|---|---|---|---|---|
| Colon | 60/60 | 100 | 3/3 | 100 |
| Lung | 83/91 | 91 | 22/25 | 88 |
| Ovary* | 107/113 | 95 | 60/61 | 98 |
| Uterus | 6/6 | 100 | 2/2 | 100 |
| Pancreas | 10/10 | 100 | 0/0 | NA |
| CNS | 73/73 | 100 | 21/21 | 100 |
*Denotes the performance of ovary tumors when allowing uterus to be considered a correct classification.
We also considered the performance of our classifier on poorly differentiated specimens from the UM data set (Table 2) ▶ . For ovary, CNS, and lung cancers, prediction rates for poorly differentiated specimens closely matched the prediction rate for all specimens. For colon and uterus cancers, only a small number of poorly differentiated specimens were available, but there were no errors among them.
A more difficult test of the utility and robustness of the classifier might be to train the classifier on the Whitehead data and then test it on a set of tumor samples that have been characterized not only at a different research site, but also using a different microarray platform. With this goal in mind, we examined data collected at the UVA on 141 tumors representing 10 of the 14 sites of origin in the Whitehead data set. 3 The UVA data were generated using the U95A array, which is a more recent version of oligonucleotide array compared to the HuGeneFL/Hu35KsubA arrays. The U95A array contains probe sets for many of the same genes that are present on earlier versions of the Affymetrix arrays, but in many cases the target oligonucleotide sequences have been changed. Despite the differing platforms, we were able to achieve prediction rates with the UVA tumors nearly as high as those obtained by training and testing on the Whitehead data (Table 3) ▶ . Using the optimal number of genes (an average of 61 per specimen), 103 of 141 (73%) of the malignancies were correctly classified. Combining ovary and uterus tumors into a common class, 115 of 141 (82%) of the malignancies were correctly classified.
Table 3.
Cross-Laboratory Performance Using the UVA Data
| BR | PR | LU | CO | LY | ME | BL | UT | LE | KI | PA | OV | M | CNS | |
|---|---|---|---|---|---|---|---|---|---|---|---|---|---|---|
| BR | 9 | 1 | 1 | 0 | 0 | 0 | 0 | 2 | 0 | 1 | 0 | 12 | 0 | 0 |
| PR | 0 | 26 | 0 | 0 | 0 | 0 | 0 | 0 | 0 | 0 | 0 | 0 | 0 | 0 |
| LU | 0 | 0 | 9 | 2 | 0 | 0 | 0 | 1 | 0 | 0 | 1 | 0 | 1 | 0 |
| CO | 0 | 0 | 0 | 22 | 0 | 0 | 0 | 0 | 0 | 1 | 0 | 0 | 0 | 0 |
| BL | 1 | 0 | 0 | 0 | 0 | 0 | 7 | 0 | 0 | 0 | 0 | 0 | 0 | 0 |
| KI | 0 | 0 | 2 | 0 | 0 | 0 | 0 | 0 | 0 | 9 | 0 | 0 | 0 | 0 |
| PA | 0 | 0 | 0 | 1 | 0 | 0 | 0 | 0 | 0 | 1 | 4 | 0 | 0 | 0 |
| OV | 0 | 0 | 0 | 0 | 0 | 0 | 0 | 10 | 0 | 0 | 0 | 17 | 0 | 0 |
BR, breast; PR, prostate; LU, lung; CO, lung; LY, lymphoma; ME, melanoma; BL, bladder; UT, uterus; LE, leukemia; KI, kidney; PA, pancreas; OV, ovary; PM, mesothelioma; CNS, brain. Actual tumor type is designated in the first column and the predicted tumor type designated across the first row.
The error rate that we obtained by training on the Whitehead data and testing on the UVA data are approximately comparable to the best internal classification rates found for the Whitehead data. This suggests that DNA microarray measurements of gene expression are sufficiently reproducible to be used for cancer classification across laboratories and platforms, and that our method is sufficiently robust to be used for this purpose. However, the error rate of our classifier for the UVA samples was substantially higher than that reported in the initial study of the UVA samples, 3 in which both testing and training used the UVA data. This may reflect systematic differences between the Whitehead and UVA data, information loss because of our lack of access to U95A genes that are not present on the earlier platform, or generally lower measurement precision on the earlier gene expression analysis platform. We believe that the greater error rate is not likely to be because of our choice of the nearest neighbor method rather than a support vector machine for making the decision at each node. In fact, when we applied a conventional nearest neighbor method to the UVA data (not the tree-based approach that we emphasize here), we obtained very high accuracy rates. For example, using a total of 40 marker genes, 135 of 141 tumors are correctly classified.
Marker Genes
The marker genes at each split in the tree include numerous genes likely to represent differentiation related factors responsible for generating the phenotypic differences among the neoplasms of the child nodes (Table 4) ▶ . For instance, biological differences between solid and hematolymphoid malignancies may be critically influenced by expression of genes encoding extracellular matrix proteins and intermediate filaments in solid tumors (ie, collagen and keratins 8, 18, and 19). Examples of other marker genes of note at various splits of the tree include: keratins 8 and 18, mucin 1, and epithelial-specific transcription factor ESE-1b (epithelial tumors); calmodulin and kinesin family member 5 (CNS); tyrosinase and melan-A (melanoma), estrogen receptor (ER) (breast and Mullerian); prostate-specific antigen and prostatic secretory protein 57 (prostate); various pulmonary surfactant-associated proteins (lung); trefoil factor 1 (pancreas); carcinoembryonic antigen precursor (colon); CD20 receptor (lymphoma). Several of these marker genes (eg, melan-A 10 and CD20 11 ) encode proteins that are clinically accepted diagnostic markers for the respective tumor types, suggesting the tree-based classification approach may be a useful discovery platform for new clinically useful markers. However, we note that because all marker identification was performed using the Whitehead data, which included only ∼10 specimens per class, these markers should not be viewed as definitive or optimal. The complete list of the marker genes selected by the classifier is available as supplementary material.
Table 4.
Representative Marker Genes
| Tumor class | Select marker genes |
|---|---|
| Solid | Keratins 8, 18, and 19; collagen, type 1, alpha 2 |
| Hematolymphoid | CD37 antigen; T-cell receptor, beta cluster; lymphocyte cytosolic protein 1 |
| Mesothelioma | Keratins 5, 8, 18, 19; calretinin |
| Epithelial | Keratins 8 and 18; epithelial-specific transcription factor ESE 1b; mucin 1 |
| CNS | Growth/differentiation factor 1; calmodulin; kinesin family member 5 |
| Melanoma | S100 alpha and beta proteins; tyrosinase; differentiation antigen melan-A |
| Lymphoma | CD20 receptor; CD79 beta antigen |
| Leukemia | Terminal transferase; transcription factor ETR101 |
| Mullerian | Estrogen receptor; cellular retinol-binding protein |
| Non-Mullerian | Keratin 13; pulmonary surfactant-associated protein SP-A; carcinoembryonic antigen precursor |
| Ovary | Receptor of retinoic acid |
| Uterus | Hair keratin hHb6; alpha1 (XI) collagen |
| Breast | Estrogen receptor; androgen receptor; mucin 6; prolactin-induced protein |
| Prostate | Prostate specific antigen; prostatic secretory protein 57; prostatic acid phosphatase |
| Lung | Pulmonary surfactant-associated proteins A, B, C1 |
| Colon | Carcinoembryonic antigen precursor; trefoil factor 3; keratin 8 |
| Bladder | Keratins 13 and 17; Hep27 protein |
| Kidney | Insulin-like growth factor 2 |
| Pancreas | Mucin 5, subtype B; trefoil factor 1 |
Because we use the data to select marker genes and do not use external knowledge about existing markers, a number of marker genes now conventionally used by pathologists were not identified by the classifier. Conversely, a few of the genes selected as markers by the classifier may not ultimately prove useful for classification. We expect that 50 to 100 tumors of each type will likely be necessary to define a highly reliable set of marker genes. A related issue is that some of the markers selected by the classifier are not intimately related to the biological properties of the malignant cells in a given tumor specimen. Rather, some of the markers are reflective of certain nonneoplastic cell populations known to be present in certain types of primary tumors. Such markers are highly unlikely to be useful in classifying metastatic tumors. Examples of this phenomenon are the insulin and glucagon genes, which may be found to be highly expressed in primary pancreatic tumor specimens because of the presence of contaminating normal pancreatic islet cells alongside the pancreatic adenocarcinoma cells. The insulin and glucagon genes are not expected to be expressed in metastases from any of the tumor types in this study, so they will not introduce any bias into classification. However, such genes might cause more relevant pancreatic carcinoma markers to be missed in the initial analysis. The issue is not related to statistical analysis, and can only be addressed by using more highly purified training specimens or by introducing additional biological information into the marker gene selection.
Post Hoc Analysis of Misclassified Tumors
Because of the simple structure of our classifier, it was straightforward to pinpoint the gene expression features of a misclassified tumor that caused the classifier to fail. Close inspection of these failures might lead to improvements in marker gene selection or suggest changes in experimental protocols. Although the gene expression characteristics of atypical tumors might reflect in part morphological misclassification of certain tumors, a considerably more interesting possibility is that the more enigmatic patterns of gene expression seen in atypical tumors may reflect important biological features not fully appreciated through morphological evaluation.
The misclassified ovarian (n = 6) and lung (n = 8) tumors were reviewed to uncover any unusual morphological features that might explain the classification errors (Table 5) ▶ . Of the six ovarian tumors, five were well or moderately differentiated mucinous tumors with intestinal type differentiation, thereby explaining their classification as colonic tumors. Interestingly, our approach uncovered an apparently aberrant gene expression pattern in an ovarian tumor, which classified in our method as a CNS tumor. Subsequently, the tumor was further evaluated using routine immunohistochemical diagnostic markers. This tumor, obtained from the Cooperative Human Tissue Network, lacked expression of high- and low-molecular weight cytokeratins and expressed glial acidic fibrillary protein (GFAP, a marker of glial differentiation 12 ) and ER. This immunohistochemical profile implies that this tumor was not a typical ovarian adenocarcinoma, as originally classified by the pathologists at the originating hospital and the Cooperative Human Tissue Network (CHTN). Unfortunately, we were unable to pursue further morphological classification of the tumor, because only a very small portion of frozen tissue from the original large ovarian tumor specimen was available to us. Nevertheless, the case is an interesting and potentially quite instructive one, because our approach was able to identify and validate aberrant gene expression in this tumor, thereby explaining the basis for its molecular classification as a CNS tumor.
Table 5.
Post Hoc Analysis of Misclassified Ovarian and Lung Tumors
| Tumor type | Molecular classification | Histology | Differentiation |
|---|---|---|---|
| Ovary | Solid, epithelial, non-Mullerian, colon | ACA, mucinous, intestinal type | Moderate |
| Ovary | Solid, epithelial, non-Mullerian, colon | ACA, mucinous, mixed intestinal and endocervical type | Well |
| Ovary | Solid, epithelial, non-Mullerian, colon | ACA, mucinous, intestinal type | Well |
| Ovary | Solid, epithelial, non-Mullerian, colon | ACA, mucinous, intestinal type | Well |
| Ovary | Solid, epithelial, non-Mullerian, colon | ACA, mucinous, intestinal type | Moderate |
| Ovary | Solid, CNS | Spindle and epithelioid neoplasm | Poor |
| Lung | Solid, epithelial, non-mullerian, pancreas | ACA, bronchioloalveolar, mucinous type | Well |
| Lung | Solid, epithelial, non-mullerian, pancreas | ACA, bronchioloalveolar type | Well |
| Lung | Solid, epithelial, mullerian, uterus | ACA, papillary | Moderate |
| Lung | Solid, epithelial, mullerian, uterus | ACA | Moderate |
| Lung | Solid, epithelial, non-mullerian, breast | ACA | Poor |
| Lung | Hematolymphoid, lymphoma | ACA with intense lymphoplasmocytic response | Moderate |
| Lung | Solid, epithelial, breast | Large cell neuroendocrine carcinoma | Poor |
| Lung | Solid, epithelial, uterus | Large cell undifferentiated carcinoma | Poor |
ACA, adenocarcinoma.
Eight of the primary lung tumors were misclassified, two as pancreas, three as uterine, two as breast, and one as lymphoma. Pathological review of these cases revealed a few interesting observations (Table 5) ▶ . Misclassified tumors spanned the complete differentiation spectrum and included well, moderate, and poorly differentiated tumors. The lung tumor classified as lymphoma contained an intense lymphoplasmacytic infiltrate with tumor-infiltrating lymphocytes, thereby offering an explanation for its misclassification. Two of the tumors that classified as pancreatic were well-differentiated bronchioloalveolar carcinomas. The remaining tumors that classified as uterine or breast were moderately to poorly differentiated and included adenocarcinoma, large-cell neuroendocrine carcinoma, and large-cell undifferentiated carcinoma and did not show any extraordinary morphological variation. As it is likely the training set for lung did not contain many of the latter tumor types, these classification errors are not entirely unexpected.
Twelve UVA breast samples were misclassified as ovary. Although we do not have access to the UVA primary specimens, we can investigate the basis for this misclassification using gene expression. We found that several Mullerian marker genes that were highly expressed in ovary and uterus compared to other epithelial tumor types in the Whitehead data did not show this pattern of expression in the UVA data. In particular, several of these marker genes were highly expressed in some or all of the 12 UVA breast errors. These include lysyl hydroxylase (PLOD), highly expressed in all 12 UVA breast errors; cellular retinol-binding protein, highly expressed in 11 of 12 UVA breast errors; and ribosomal protein L32 (RPL32), highly expressed in 9 of 12 UVA breast errors. Similarly, certain marker genes for non-Mullerian epithelial tumors failed to show high expression in UVA breast tumors, including glutamine synthase (GLUL), which was weakly expressed in 9 of 12 UVA breast errors.
Discussion
Robust Training with Small Sample Sizes
Previous studies in which tissue of origin for human tumors was predicted from microarray data have yielded error rates ranging from 10 to 20% 1-3 with 10 or more classes to 5% or less 2 for a study with three classes. The best performance was achieved in the study that had the fewest tumor classes and by far the greatest number of samples per class, 2 perhaps because training a complex classifier algorithm using a data set containing a small number of tumors of each type is likely to produce unstable results. However, as found here, small sample sizes and a large number of classes need not preclude a high level of performance. This suggests that imposing a predetermined structure, ie, the pathological framework, onto the classifier mechanism as we do herein has the potential to stabilize the training process, leading to a substantial reduction in training variability and improved performance with small data sets. Although our classification performance is satisfactory, because of the small number of specimens per class we are not confident that we have found the optimal set of marker genes. In fact it is a great challenge for any statistical procedure to reliably identify the most informative marker genes unless a set of samples covering the full range of biological variability is available for each class.
As our initial implementation, we used a decision tree based exclusively on conventional ontological relationships among tissue classes. As more data become available, it is almost certain that it will be possible to improve on the performance of our method by modifying the tree to accommodate new divisions and subtypes that become apparent from the expression data. For example, there is already evidence that ovarian tumors exhibit distinct expression patterns according to histological type, and that one of the ovarian histotypes (mucinous) may be as similar to colon specimens as it is to other ovarian specimens. This suggests that in certain cases it may be helpful to include distinct nodes in the tree for different histotypes, even when the ultimate goal is to classify at the organ level. Taking this idea further, it would be possible to use a statistical tree-fitting procedure such as Classification and Regression Trees (CART) to construct a tree based exclusively on the experimental expression data. Our experience with such methods indicates, however, that a large number of samples must be used to produce stable results if no previous constraints are imposed on the tree. Thus we can view the proposed methodology as an effective way to reduce the search space when only a modest number of training samples are available.
Error Depth and Poor Differentiation
An advantage of the coarse-to-fine formulation of our classifier is that it allows a notion of error depth to be introduced, whereby errors that occur higher in the tree (Figure 1) ▶ are considered to be more serious than errors at the terminal nodes. In some cases, tumors arising from closely related terminal nodes might have very similar or identical clinical management, potentially mitigating the consequences of a misdiagnosis, whereas a mistake higher in the tree could lead to a significantly lower chance of successful therapy and outcome for the patient.
Error depth is also relevant for understanding the degree of difference between metastatic tumors, poorly differentiated primary tumors, and well-differentiated primary tumors. In the UM samples, poorly differentiated tumors were correctly classified at a comparable rate to moderately and well-differentiated specimens. Poorly differentiated primary tumors in the Whitehead data were qualitatively harder to classify, although, using our approach, poorly differentiated tumors were usually correctly predicted to the second level from the bottom of the tree. This is consistent with the notion that poorly differentiated malignancies are less likely to express genes highly specific to their corresponding normal tissue of origin (eg, anaplastic thyroid carcinoma does not express thyroid-related genes such as thyroglobulin 13 ). However, rather than demonstrating fundamentally distinct patterns of gene expression, we found that poorly differentiated tumors often continued to express genes characteristic of their origin. Therefore, our analysis does not support a hypothesis suggested in Ramaswamy et al 1 that poorly differentiated tumors are fundamentally different and may have distinct natural histories from their well and moderately differentiated counterparts. An alternative view suggested by our results is that the relatively modest differences in gene expression patterns in morphologically related tumors spanning the spectrum from well to undifferentiated may reflect differences in genotype, not major differences in natural history or cell of origin.
Selecting the Optimal Number of Genes
When evaluating an algorithm and a data set, we produced curves that show the error rate as a function of the number of marker genes (Figure 2) ▶ . It is typical of most statistical learning algorithms that initially the error rate improves as the number of marker genes increases from small to moderate, but as the number of marker genes becomes large the algorithm overfits the data and the generalization performance actually becomes worse. Hence, for example, in the UM lung tumors the performance of our method suffers when more than 1000 genes are used. The support vector machine has the appealing feature of being relatively resistant to overfitting (see Figure 5 in Ramaswamy et al 1 ). However, for reasons that we describe here this characteristic may provide little practical benefit. In practice a specific number K of marker genes must be selected for use by our method. This number in turn determines the actual number of distinct genes used by the method, which varies with the path that a sample follows through the tree. A simple method for selecting K would be to run a pilot study and select a value for K that is slightly larger than the estimated optimum (to be conservative). Because our method shows nearly uniform performance over a full order of magnitude (∼from 100 to 1000 genes) there is little risk of producing results that are significantly worse than when using the optimal number of genes.
Adaptive Reference of Marker Genes
A unique feature of our method is its ability to use different sets of marker genes and different numbers of marker genes for classifying different specimens. This adaptivity is not possessed by other methods that are commonly used to perform classification with gene expression data. Generally, with other classification algorithms all markers must be assayed on a specimen before the classification rule can be applied. We found that only approximately half of the total set of marker genes was referenced by our method in classifying a typical specimen. This ratio would be expected to further decrease as the number of cancer classes under consideration grows. For example, markers for particularly rare cancers should only be assayed if the expression of other more broadly useful markers suggests that the rare classification is indeed a possibility.
Multivariate versus Univariate Marker Selection
Our findings bear on whether complex gene selection methods are essential for high performance. In the Whitehead study, 1 backward selection was found to outperform gene shaving 14 and other methods of gene selection. All of these gene selection methods are designed to identify sets of genes that perform well as a group, either through the presence of informative interactions or by minimizing redundancy. In contrast, we select each gene individually based on its marginal association with the tumor categories. Although there are good reasons in principle for believing that genes selected as a group may outperform genes selected individually (ie, to identify statistical interactions that reflect molecular interactions), the current generation of statistical variable selection techniques may not be stable or powerful enough to reliably exploit such phenomena unless the sample size is very large.
One possible explanation for the observation that our method performs well without using multivariate gene selection methods may lie in the nature of the sequential coarse-to-fine decision process that we use. For example, consider the ER gene that is often highly expressed in breast, ovary, and uterus tumors. For a nonsequential classifier (such as the support vector machine) that attempts to directly place a sample into 1 of the 14 classes, ER expression must be considered jointly with the presence of ovary/uterus markers or the absence of other breast markers to place a tumor in a specific class. On the other hand, once a tumor has been predicted to lie in the epithelial/non-Mullerian node, high expression of ER is sufficient to call the tumor as breast, whereas if a tumor is predicted to lie in the epithelial/Mullerian node, ER expression is not informative and completely different markers must be used. In either case, ER expression alone is informative whenever it appears as a marker for a specific node.
Future Prospects
Our findings suggest that the expression levels of relatively few genes can be used to accurately predict the origin of human malignant tumors. However, additional work is required to fully validate the utility of gene expression-based cancer diagnostics. One important issue will be to study how the difficulty of the problem increases as the set of tumor classes is expanded to more realistically reflect the myriad types of human tumors. Although Figure 1 ▶ covers a reasonable diversity of malignant tumors, expression data for other important cancers, such as endocrine tumors, sarcomas, pediatric small round blue cell tumors, the other gastrointestinal tract carcinomas (ie, esophagus and stomach) and head and neck tumors, are not available to us at present. Another crucial issue is the size of the training set. We used the Whitehead data set for training the classifier because it covered the greatest number of disease classes. However, with only ∼10 instances of each type, the Whitehead data set does not provide a comprehensive picture of the variation within different sites of origin. For example, the UM data provides more than 100 ovary tumors covering the four main histological types of ovarian cancer as well as variation in stage and grade. We expect that optimal performance in terms of accuracy and robustness will only be attained when comparable sets of tumors are profiled for all sites of origin.
Further work will also be required to determine the best set of marker genes for cancer class prediction in a clinical setting, in which the paramount goals are measurement robustness and generalization from primary to metastatic specimens. The analysis framework presented here demonstrates that accurate prediction can be achieved by processing the information in a relatively small number of gene expression levels in a simple way. Nevertheless, our results are limited by our exclusive use of the Whitehead data for marker identification. Because the Whitehead set only contains ∼10 specimens per class, the specific genes identified by our method in this study must not be taken as definitive.
Our generalization results suggest that DNA microarray measurements of gene expression are sufficiently stable between laboratories and platforms to provide a reasonably high degree of predictive accuracy across batches. The approach we took here involved training the classifier on the Whitehead data, and then using the trained classifier to predict the classes for individual samples from other data sets. We did not use any normalization or batch correction to align the data sets. A different approach would be to consider either the UM or UVA samples as set, and then attempt to identify systematic differences relative to the Whitehead set that may be removed before analysis. Such batch correction may offer an improvement over the one sample at a time approach considered here, although our results present a surprisingly high baseline.
Because this study remains far from clinical implementation, we note that we have opted for simplicity as opposed to optimality in designing our algorithm. Our primary goal was to demonstrate that a small amount of pathological knowledge can be used to improve significantly on the “one versus all” and “all pairs” classification strategies used in previous work. The sequential, biologically informed approach represented in Figure 1 ▶ provides a framework in which a number of optimizations could be explored. For instance, the gene selection strategy could be extended to incorporate variation in expression as well as changes in the magnitude of expression, and genes with specifically low expression in addition to those with specifically high expression could be included. We also have not explored the flexibility that this method offers in allowing different numbers of marker genes to be used at different splits. Presumably, equal or better performance could be achieved with fewer genes if more markers were used at the most difficult divisions. Also, although we selected the nearest neighbor algorithm for its simplicity, the classification at each node could be performed using any statistical learning procedure, including support vector machines. Another promising area for improvement would be to calibrate the different microarray platforms so that differences because of probe design are minimized. In summary, our key point is not to favor one statistical learning algorithm over another, but rather that in a many-class problem in which the class differences are heterogeneous, and substantial information about the classes is available, it is valuable to consider a sequential decision strategy that makes use of known biological relationships among the classes.
This study has broad implications for the molecular classification of human tumors. By mimicking the strategies used by pathologists, we demonstrate that pathological knowledge based on the accumulated work from the last 100 years on tumor morphology and global gene expression data can be effectively combined, resulting in accurate molecular classification with fewer genes and without the need for black box-type sophisticated methods of statistical learning.
Acknowledgments
We thank our numerous technicians, including Barbara Lamb, Michelle Lizyness, Angela Smith, and Donita Sanders, who helped generate and analyze the University of Michigan gene expression data.
Footnotes
Address reprint requests to Kerby A. Shedden, Ph.D., Department of Statistics, University of Michigan, Ann Arbor MI 48109-1027. E-mail: kshedden@umich.edu.
Supported by the National Cancer Institute (NIH CA84951 and CA81488) and in part by the Tissue Core of the University of Michigan Comprehensive Cancer Center (NIH CA 46952).
References
- 1.Ramaswamy S, Tamayo P, Rifkin R, Mukherjee S, Yeang CH, Angelo M, Ladd C, Reich M, Latulippe E, Mesirov JP, Poggio T, Gerald W, Loda M, Lander ES, Golub TR: Multiclass cancer diagnosis using tumor gene expression signatures. Proc Natl Acad Sci USA 2001, 98:15149-15154 [DOI] [PMC free article] [PubMed] [Google Scholar]
- 2.Giordano TJ, Shedden KA, Schwartz DR, Kuick R, Taylor JM, Lee N, Misek DE, Greenson JK, Kardia SL, Beer DG, Rennert G, Cho KR, Gruber SB, Fearon ER, Hanash S: Organ-specific molecular classification of primary lung, colon, and ovarian adenocarcinomas using gene expression profiles. Am J Pathol 2001, 159:1231-1238 [DOI] [PMC free article] [PubMed] [Google Scholar]
- 3.Su AI, Welsh JB, Sapinoso LM, Kern SG, Dimitrov P, Lapp H, Schultz PG, Powell SM, Moskaluk CA, Frierson HF, Jr, Hampton GM: Molecular classification of human carcinomas by use of gene expression signatures. Cancer Res 2001, 61:7388-7393 [PubMed] [Google Scholar]
- 4.Yeang CH, Ramaswamy S, Tamayo P, Mukherjee S, Rifkin RM, Angelo M, Reich M, Lander E, Mesirov J, Golub T: Molecular classification of multiple tumor types. Bioinformatics 2001, 17(Suppl 1):S316-S322 [DOI] [PubMed] [Google Scholar]
- 5.Ramaswamy S, Ross KN, Lander ES, Golub TR: A molecular signature of metastasis in primary solid tumors. Nat Genet 2002, [DOI] [PubMed]
- 6.Dudoit S, Fridlyand J, Speed TP: Comparison of discrimination methods for the classification of tumors using gene expression data. J Am Stat Assoc 2002, 97:77-87 [Google Scholar]
- 7.Schwartz DR, Kardia SL, Shedden KA, Kuick R, Michailidis G, Taylor JM, Misek DE, Wu R, Zhai Y, Darrah DM, Reed H, Ellenson LH, Giordano TJ, Fearon ER, Hanash SM, Cho KR: Gene expression in ovarian cancer reflects both morphology and biological behavior, distinguishing clear cell from other poor-prognosis ovarian carcinomas. Cancer Res 2002, 62:4722-4729 [PubMed] [Google Scholar]
- 8.Beer DG, Kardia SL, Huang CC, Giordano TJ, Levin AM, Misek DE, Lin L, Chen G, Gharib TG, Thomas DG, Lizyness ML, Kuick R, Hayasaka S, Taylor JM, Iannettoni MD, Orringer MB, Hanash S: Gene-expression profiles predict survival of patients with lung adenocarcinoma. Nat Med 2002, 8:816-824 [DOI] [PubMed] [Google Scholar]
- 9.Rickman DS, Bobek MP, Misek DE, Kuick R, Blaivas M, Kurnit DM, Taylor J, Hanash SM: Distinctive molecular profiles of high-grade and low-grade gliomas based on oligonucleotide microarray analysis. Cancer Res 2001, 61:6885-6891 [PubMed] [Google Scholar]
- 10.Busam KJ, Jungbluth AA: Melan-A, a new melanocytic differentiation marker. Adv Anat Pathol 1999, 6:12-18 [DOI] [PubMed] [Google Scholar]
- 11.Cartun RW, Coles FB, Pastuszak WT: Utilization of monoclonal antibody L26 in the identification and confirmation of B-cell lymphomas. A sensitive and specific marker applicable to formalin- and B5-fixed, paraffin-embedded tissues. Am J Pathol 1987, 129:415-421 [PMC free article] [PubMed] [Google Scholar]
- 12.McLendon RE, Burger PC, Pegram CN, Eng LF, Bigner DD: The immunohistochemical application of three anti-GFAP monoclonal antibodies to formalin-fixed, paraffin-embedded, normal and neoplastic brain tissues. J Neuropathol Exp Neurol 1986, 45:692-703 [DOI] [PubMed] [Google Scholar]
- 13.Giuffrida D, Gharib H: Anaplastic thyroid carcinoma: current diagnosis and treatment. Ann Oncol 2000, 11:1083-1089 [DOI] [PubMed] [Google Scholar]
- 14.Tibshirani R, Hastie T, Narasimhan B, Chu G: Diagnosis of multiple cancer types by shrunken centroids of gene expression. Proc Natl Acad Sci USA 2002, 99:6567-6572 [DOI] [PMC free article] [PubMed] [Google Scholar]