

Abstract
Experimental evidence has shown, both in vitro and in animal models, that neoplastic growth and subsequent metastasis formation depend on the tumor’s ability to induce an angiogenic switch. This requires a change in the balance of angiogenic stimulators and inhibitors. To assess the potential role of angiogenesis factors in human thyroid tumor growth and spread, we analyzed their expression by semiquantitative RT-PCR and immunohistochemistry in normal thyroid tissues, benign lesions, and different thyroid carcinomas. Compared to normal tissues, in thyroid neoplasias we observed a consistent increase in vascular endothelial growth factor (VEGF), VEGF-C, and angiopoietin-2 and in their tyrosine kinase receptors KDR, Flt-4, and Tek. In particular, we report the overexpression of angiopoietin-2 and VEGF in thyroid tumor progression from a prevascular to a vascular phase. In fact, we found a strong association between tumor size and high levels of VEGF and angiopoietin-2. Furthermore, our results show an increased expression of VEGF-C in lymph node invasive thyroid tumors and, on the other hand, a decrease of thrombospondin-1, an angioinhibitory factor, in thyroid malignancies capable of hematic spread. These results suggest that, in human thyroid tumors, angiogenesis factors seem involved in neoplastic growth and aggressiveness. Moreover, our findings are in keeping with a recent hypothesis that in the presence of VEGF, angiopoietin-2 may collaborate at the front of invading vascular sprouts, serving as an initial angiogenic signal that accompanies tumor growth.
The establishment of a vascular supply is an absolute requirement for the growth of normal and neoplastic tissues. Angiogenesis is the branching out of new blood vessels from pre-existing vasculature. 1-3 This process depends on the tightly controlled action of endothelial cell proliferation, migration, and survival. The search for potential regulators of angiogenesis has yielded different molecules, most of which are polypeptide growth factors. 4
Vascular endothelial growth factor (VEGF) is an endothelial cell-specific mitogen whose importance in the endogenous regulation of angiogenesis has been clearly demonstrated. 5 The high-affinity tyrosine kinase VEGF receptors are Flt-1 and KDR/Flk-1 (referred to as KDR), which are expressed almost exclusively on endothelial cells. 6-8 After VEGF binding, Flt-1 regulates the correct vascular assembly but does not induce mitogenic or migratory signals. Conversely, KDR stimulates endothelial cell proliferation and migration. 9
Three other endothelial cell-specific receptor tyrosine kinases have been described so far: Flt-4, Tie-1, and Tek/Tie-2 (referred to as Tek). Flt-4 is a receptor closely related in structure to KDR and Flt-1 but does not bind VEGF. In human adult tissues, Flt-4 expression is restricted to lymphatic endothelia and some venules. 10 VEGF-C, the ligand for Flt-4, is expressed in many tissues and in certain tumor cell lines. 11 It has been suggested that VEGF-C may act as a lymphangiogenic factor, but Cao et colleagues 12 have recently demonstrated that VEGF-C is also a potent angiogenic factor in vivo, signaling through both KDR and Flt-4 receptors. The authors suggest that the angiogenic activity might be modulated by other angiogenic factors like VEGF or VEGF-D by the formation of heterodimers. 12 However, transgenic mice overexpressing VEGF-C in the skin showed marked hyperplasia of the lymphatic endothelium. 13
Tie-1 and Tek are both uniformly expressed by the endothelial cells of the blood vessels during embryonic development. 7,14,15 At present, Tie-1 is an orphan receptor, whereas Tek has two ligands: angiopoietin-1 and -2 (Ang1, Ang2). Unlike VEGF, Ang1 does not promote endothelial cell proliferation or in vitro angiogenesis. Nevertheless Ang1 and the tyrosine kinase receptor Tek are required for normal vascular development in the mouse, being essential for myocardium differentiation and for the recruitment of smooth muscle cells and pericytes. 16-18 Ang2 is a naturally occurring antagonist for Ang1, blocking its ability to induce Tek tyrosine kinase activity. Based on its expression pattern, it has been proposed that besides interfering with Ang1-mediated blood vessel maturation/stability, Ang2 may collaborate with VEGF at the front of invading vascular sprouts, thus serving as an initial angiogenic signal. 19
It is currently believed that angiogenesis is controlled by a balance between angiogenic stimulators and inhibitors, rather than by the activity of a single regulator. 20 In addition to angiogenic inducers, a number of potential antiangiogenic factors have been identified, including thrombospondin-1 (TSP-1), angiostatin, and endostatin. 21-23 TSP-1 is an extracellular matrix glycoprotein that influences cell adhesion, mobility, and growth. Several antiangiogenic activities of TSP-1 have been demonstrated, including the modulation of tumor growth and metastases. 24-27
Thyroid neoplasias comprise different histotypes with various phenotypic characteristics and variable clinical behaviors. 28 Thyroid adenomas are benign neoplasms rarely capable of malignant progression. Microcarcinomas and papillary thyroid carcinomas (PTCs) represent thyroid neoplasias that frequently invade cervical lymph nodes. However, whereas the former are very small malignancies, the latter often show wider dimensions, sometimes infiltrating the thyroid capsule. Follicular thyroid carcinomas (FTCs) are aggressive tumors that often give rise to distant hematogenous metastases. Undifferentiated thyroid carcinomas (UTCs) present a dramatic invasive potential and are almost invariably fatal. All of the above-mentioned neoplasias originate from the malignant degeneration of the thyroid follicular epithelium. Conversely, medullary thyroid carcinomas (MTCs) develop from neural crest-derived C cells. These neoplasias usually present a poor outcome, spreading through both the lymphatic and hematic endothelium.
In this study we analyzed the expression of angiogenesis stimulators and inhibitors in human thyroid tumors, including the newly discovered angiopoietins together with their cognate receptors. Furthermore, we have examined the possible associations between thyroid tumor clinical pathological features and the expression levels of angiogenic molecules.
Materials and Methods
Tissue Specimens
We collected 68 consecutive thyroid tumor samples representing the complete spectrum of thyroid neoplasias: 17 adenomas, five papillary microcarcinomas, 26 PTCs, 12 FTCs, six MTCs, and seven UTCs. We also gathered 16 nodal metastatic tissues derived from 12 different PTCs and four distinct MTCs. Moreover, we collected eight normal thyroid tissues resected from patients diagnosed with laryngeal carcinoma. All of the specimens analyzed were reviewed by the same pathologist (S. P.) to confirm the original diagnosis and to classify the tumors according to pathological stage (pTNM) as proposed by the Union Internationale Contre le Cancer. 29
T-tumor sizes: T1, Ø = 1 cm; T2, Ø >1 = 4 cm; T3, Ø > 4 cm; T4, any size extending beyond the thyroid capsule.
N-regional lymph nodes: Nx, regional lymph node cannot be assessed; N0, no regional lymph node metastasis; N1, presence of regional lymph node metastases.
M-distant metastasis: Mx, distant metastasis cannot be assessed; M0, no distant metastasis;
M1, presence of distant metastases.
RNA Isolation and Northern Blotting
Each frozen biopsy was mechanically disrupted in a Mikro-Dismembrator II (B. Braun) containing liquid nitrogen. Total RNA was extracted using Ultraspec II (Biotecx Laboratories) according to the manufacturer’s protocol. After extraction, the poly(A)+ mRNA was selected by two passages on oligo (dT)-cellulose columns (USB). Northern blot was carried out using 5 μg of poly(A)+ RNA as previously described. 30 The following cDNA fragments were used as probes: 1) the 0.395-kb fragment of bovine cDNA VEGF (kindly provided by Dr. S. J. Mandriota); 2) the 0.409-kb VEGF-C cDNA fragment (kindly provided by Dr. K. Alitalo); 3) the 0.353-kb PCR-amplified Ang2 cDNA fragment; 4) β-actin cDNA. The 32P signals were quantified with a phosphorimager (Bio-Rad).
Semiquantitative RT-PCR Analysis
RT-PCR was performed as follows: 5 μg of total RNA was reverse transcribed at 42°C for 50 minutes in the presence of 500 ng random examers and Superscript II reverse transcriptase (Gibco-BRL) in a final volume of 20 μl. Two microliters of the cDNA reaction was then subjected to different 28-35 PCR cycles (30 seconds at 95°C, 30 seconds at 62°C, and 1 minute at 72°C), using the AmpliTaq Kit (Perkin Elmer) and 0.4 μmol/L of specific primers. When genomic DNA was used as a template in PCR reactions, fragments longer than the expected bands were observed, thus indicating that intron-spanning primers were selected for amplification. The housekeeping aldolase A mRNA was used as an internal standard and coamplified in the same reaction tube with the other specific markers. Aldolase oligonucleotides (5′-CGCAGAAGGGGTCCTGGTGA-3′ 5′-CAGCTCCTTCTTCTGCTGCGGGGTC-3′) were added to each PCR sample between cycles 3 and 7, depending on the amplified gene. PCR products were electrophoresed onto a 3% agarose gel containing ethidium bromide (0.5 μg/ml) and visualized under UV light. The relative intensities of the bands were quantitated by densitometric analysis and normalized to the coamplified aldolase cDNA fragment. Each PCR product was cloned in pCRII (Invitrogen) and sequenced to confirm the identity of the amplified cDNA fragment. Preliminary experiments were performed to determine the exponential phase of amplification and the exact cycle at which Aldolase primers were to be added to the reaction, using RNA extracted from human normal thyroid tissue as positive control. At least four RT-PCR experiments were performed starting from the same RNA preparation. Gel-digitized images were quantitated with the NIH Image 1.6.1 program (National Institutes of Health, Division of Computer Research and Technology, Bethesda).
Primers Used for RT-PCR
VEGF (5′-TTCCAGGAGTACCCTGATGAG-3′ 3′-CTGTTCGGCTCCGCCACTCGG-5′); KDR (5′-TGTGGTGATTCCATGTCTCGG-3′ 3′-TGCCACCCCCTCGCACAGTC-5′); Flt-1 (5′-TCTTGACCCACATTGGCCAC-3′ 3′-CTATCGCAGTGGTCGTCGCT-5′); VEGF-C (5′-AATGTGGGGCCAACCGAGAA-3′ 3′-GCAACACAGGGAAGTATAACC-5′); Flt-4 (5′-GATCGTGGAGTTCTGCAAGTACG-3′ 3′-TTCGCTGCACCACTTCTAGACA-5′); Ang1 (5′-TCCGGTGAATATTGGCTGGG-3′ 3′-CGGGTCAATGAGGAATGCAAG-5′); Ang2 (5′-GATGGCAGCGTTGATTTTCA-3′ 3′-CGACCACCAAACTACGTACA-5′); Tek (5′-GGCCGCTACCTACTAATGAAG- 3′ 3′-GAAGTAATCATCCATCGCCGG-5′); Tie-1 (5′-ACCCACTACCAGTGGATGT-3′ 3′-GAGTTGCGGTCGTGCGCAG-5′); TSP-1 (5′-CGTCCTGTTCCTGATGCAGT-3′ 3′-AACACGTCCTTCTGTCCCGG-5′); CD31 (5′-GGACCAAGCAGAAGGCTAGC-3′ 3′-GAAGACTTGAGGTTGTTGCTC-5′).
Immunohistochemistry and Vessel Counting
Tissue samples were obtained from the archives of our institute. Immunohistochemistry was performed on a limited number of samples (four normal tissues, 10 adenomas, three papillary microcarcinomas, 12 PTCs, five FTCs, four UTCs, and four MTCs). Tissue preparation and antigen retrieval procedures were performed as previously described. 31 Immunostaining was carried out by streptavidin peroxidase (Dako) and 3-amino-9-ethyl carbazole (AEC) as previously reported. 32 For negative controls, the primary antibody was replaced with normal mouse, goat, or rabbit sera. TSP-1 (P10; Immunotech) immunostaining was carried out on acetone-fixed frozen sections. VEGF (BioGenex), CD31 (Dako), VEGF-C (SC1881; Santa Cruz), and Ang2 (C-19 SC7015; Santa Cruz) immunostainings were performed on formalin-fixed paraffin-embedded sections.
Immunohistochemistry for CD31 was assessed as described above. Anti-CD31 mAb highlights vascular endothelial cells of blood vessels of formalin-fixed tumor samples, so it is possible to identify easily the most intense areas of neovascularization in the samples. We considered as a single microvessel any brown, immunostained endothelial cells separated from the adjacent microvessels, tumor cells, and other connective tissue elements. Nonspecific staining was evaluated by use of a control section for each case, replacing the primary antibody with normal serum. Microvessels were carefully counted in the most intense areas of neovascularization on a ×200 field.
Statistical Analyses
Main pathological tumor characteristics in the available patient sample were described by means of contingency tables. The possible association between pathological tumor characteristics was tested by Fisher’s exact test for cross-classified data.
For each molecule considered (VEGF, VEGF-C, Ang1, Ang2, KDR, Flt-4, Tek, TSP-1) the distribution according to the type of tumor (benign or malignant), pTNM parameters, and histology of tissue samples was mainly described in terms of a median value.
To investigate the possible association between different angiogenic factors, Spearman correlation coefficients were computed. We compared with nonparametric methods, such as the Wilcoxon signed rank test (for paired data), the Wilcoxon rank sum test (two independent groups), or the Kruskal-Wallis test (more than two groups), as appropriate, the mean levels of expression of these factors in different types of tumor tissue. Considering only the cases with follicular adenoma or carcinoma, logistic discriminant analyses were carried out to investigate whether the singly taken angiogenic factor allows reliable discrimination between benign and malignant lesions. The results obtained are reported in terms of Somer’s D coefficient and the likelihood ratio P for the regression coefficient of the fitted logistic models. The conventional 5% significance level was adopted. The analyses were carried out with SAS software.
Results
The expression levels of various angiogenic factors (VEGF, VEGF-C, Ang1, and Ang2), their respective receptors (KDR, Flt1, Flt4, and Tek), and an angiogenesis inhibitor (TSP-1) were examined by semiquantitative RT-PCR in eight normal thyroid tissues, 68 primary thyroid tumors, and 16 nodal metastases. The obtained values were quantitated by densitometric analyses, and those observed in the normal thyroids were considered as a baseline to evaluate the expression levels in neoplastic tissues (see Materials and Methods). The distribution of histology and pathological characteristics of the specimens analyzed is shown in Table 1 ▶ . Table 2 ▶ reports the number of T4-, N-, or M-positive cases in the different histological types.
Table 1.
Tumor Histology and pTNM Characteristics of Patients with Thyroid Lesions
| N | % | ||
|---|---|---|---|
| T-stage | T1 | 6 | 9 |
| T2 | 26 | 38 | |
| T3 | 14 | 20 | |
| T4 | 22 | 33 | |
| N-stage | N0 | 31 | 46 |
| N1 | 36 | 53 | |
| Nx | 1 | 2 | |
| M-stage | M0 | 39 | 58 |
| M1 | 27 | 40 | |
| Mx | 1 | 2 | |
| Histology | Adenoma | 17 | 25 |
| Microcarcinoma | 5 | 7 | |
| PTC | 21 | 31 | |
| FTC | 12 | 18 | |
| UTC | 7 | 10 | |
| MTC | 6 | 9 |
Table 2.
Percentage of T4-, N-, or M-positive Cases in the Different Histological Types
| Histology | T4 N (%) | N1 N (%) | M1 N (%) |
|---|---|---|---|
| Microcarcinoma | 0 (0) | 4 (80) | 0 (0) |
| PTC | 13 (62) | 20 (95) | 6 (29) |
| FTC | 2 (17) | 2 (17) | 9 (75) |
| UTC | 5 (71) | 5 (71) | 7 (100) |
| MTC | 2 (33) | 5 (83) | 5 (83) |
Because most angiogenic regulators are mainly expressed by endothelial cells, to exclude major discrepancies in vascular density, both normal and neoplastic thyroid samples were analyzed for the expression of endothelial cell-specific marker CD31. The analysis was carried out for all samples by semiquantitative RT-PCR and, for a limited number (see Materials and Methods), by immunohistochemistry (IHC). Compared to the normal thyroid tissues, neoplastic specimens presented no significant variation in vascular density, with the exception of papillary microcarcinomas and UTCs. The former showed only a few microvessels per field, whereas in the latter, we observed a slight reduction of microvasculature. In Table 3 ▶ are summarized the microvessel count data obtained by CD31 staining.
Table 3.
Microvessel Count in Normal and Neoplastic Human Thyroid Specimens
| Histology | Normal (n = 4) | Adenoma (n = 10) | Micro.* (n = 3) | PTC (n = 12) | FTC (n = 5) | UTC (n = 4) | MTC (n = 4) |
|---|---|---|---|---|---|---|---|
| Microvessel count (mean± SD) | 28 ± 12 | 32.4 ± 14 | 8 ± 4 | 33 ± 15 | 39.7 ± 17 | 22 ± 8 | 41 ± 22 |
Microvessels were counted in the most intense areas of neovascularization on a ×200 field.
*Papillary thyroid microcarcinoma.
Increases of VEGF and KDR in Malignant Thyroid Carcinomas
To identify VEGF isoforms 5 expressed in thyroid tumors, we chose specific primers able to detect the various mRNA transcripts generated by alternative splicing. In most benign adenomas and in papillary microcarcinomas we did not observe any increase in VEGF expression with respect to normal thyroid (Figure 1A ▶ , Figure 5A ▶ , and Table 4A ▶ ). In contrast, all other malignant carcinomas showed a marked VEGF up-regulation. In particular, PTCs and most of aggressive FTCs presented a stronger increase, ranging from three- to 10-fold (an example of the results is shown in Figure 1A ▶ ). Finally, a two- to ninefold increase in VEGF expression was detected in 70% of UTCs. A similar VEGF increase was also observed in 50% of MTCs (Figure 1A ▶ and Table 4A ▶ ). Provocatively, most of the lymph nodal metastases analyzed presented a further VEGF increase with respect to primary tumors (data not shown). Interestingly, the up-regulated VEGF isoforms (VEGF121, VEGF145, and VEGF165) were essentially the same, thus suggesting that thyroid tumors preferentially express efficiently secreted isoforms of VEGF. 33 Northern blot analysis of different thyroid tumors showed up-regulated VEGF mRNA levels ranging from threefold (FTC 250) to ninefold (UTC 325), whereas in the adenoma we failed to find any increase (Figure 5B) ▶ . Immunohistochemical analysis completely paralleled the data obtained with semiquantitative RT-PCR. In Figure 1B ▶ is shown VEGF staining in both normal and PTC samples. In PTC specimens epithelial follicular cells were strongly stained, whereas normal tissues showed a weak staining in addition to the expected reactivity in vascular endothelial cells (feature not shown).
Figure 1.

Expression of VEGF and its receptors in thyroid tumors. A: Total RNA was extracted from normal thyroid tissues and different thyroid tumor specimens. Semiquantitative RT-PCR analysis was performed using 5 μg of total RNA and intron-spanning primers specific for VEGF, Flt-1, and KDR. Specific oligonucleotides were used to amplify different VEGF isoforms. Four bands were visualized that corresponded to 189aa (460 bp), 165aa (410 bp), 145aa (370 bp), and 121aa (270 bp). The relative intensities of the bands were densitometrically quantified and normalized to the coamplified aldolase signal (Aldo). The numbers at the top of the figure indicate different patients. B: Immunoperoxidase staining of VEGF in normal and neoplastic thyroid tissues. Magnification, ×200. N, normal thyroid; Ade, follicular adenoma; PTC, papillary thyroid carcinoma; FTC, follicular thyroid carcinoma; UTC, undifferentiated thyroid carcinoma; MTC, medullary thyroid carcinoma.
Figure 5.

A: Levels of expression of VEGF, VEGF-C, Ang2, and TSP-1 in thyroid papillary microcarcinomas. Semiquantitative RT-PCR analysis was performed as described in Figure 1 ▶ , with specific primers. The relative intensities of the bands were densitometrically quantified and normalized to the coamplified aldolase signal (Aldo). B: Northern blot analysis of mRNAs (5 μg) isolated from normal thyroid tissue and different thyroid tumors. The membrane was analyzed with successive hybridization to VEGF, VEGF-C, Ang2, and β-actin probes. Relative levels of the different transcripts were determined by the phosphorimager instrument and normalized with the β-actin hybridization signal. The numbers at the top of the figure indicate different patients. N, normal thyroid; Ade, follicular adenoma; PTC, papillary thyroid carcinoma; FTC, follicular thyroid carcinoma; UTC, undifferentiated thyroid carcinoma; MTC, medullary thyroid carcinoma.
Table 4.
Expression of Angiogenic or Angioinhibitory Molecules in Neoplastic Thyroid Tissues
| A | B | |||||||||
|---|---|---|---|---|---|---|---|---|---|---|
| TSP-1 expression levels | ||||||||||
| No | VEGF | KDR | VEGF-C | Flt-4 | Ang2 | Tek | Normal | Decreased* | Strongly Decreased† | |
| Adenomas | 17 | 18% | 59% | 6% | 18% | 88% | 6% | 88% | 12% | — |
| Microcarcinomas | 5 | — | — | 60% | — | — | — | 100% | — | — |
| PTC | 21 | 86% | 76% | 76% | 24% | 90% | 24% | 76% | 19% | 5% |
| PTC metastases | 12 | 92% | 92% | 92% | 50% | 92% | 50% | — | 67% | 33% |
| FTC | 12 | 75% | 50% | 42% | 17% | 75% | — | 25% | 25% | 50% |
| UTC | 7 | 71% | 57% | 86% | 28% | 100% | — | — | — | 100% |
| MTC | 6 | 50% | 67% | 83% | 83% | 83% | 67% | 33% | 51% | 16% |
| MTC metastases | 4 | 75% | 75% | 100% | 75% | 100% | 75% | — | 25% | 75% |
(A) Tumors with increased expression (at least twofold) of different angiogenic molecules compared to normal thyroid tissues.
(B) Tumors with a reduction of TSP-1 expression with respect to normal thyroid tissues.
*Reduction from two- to fourfold.
†At least a fivefold reduction.
With the exception of papillary microcarcinomas, increased KDR mRNA levels could be detected throughout the considered lesions (Table 4A) ▶ . In particular, epithelial-derived thyroid tumors displayed consistent KDR increases ranging from 24-fold in PTCs to three- to sixfold in benign adenomas, malignant FTCs, and UTCs (Figure 1A) ▶ . These data were also confirmed by Western blot of a representative panel of tumors (data not shown). The C-cell-derived MTCs showed a slight KDR up-regulation. Because KDR expression levels are different in thyroid tumors, differences in KDR expression levels in normal tissues are due to differences in film exposure time. For densitometric analysis we needed a nonsaturated exposition of the photograph. Furthermore, we did not observe any modulation of Flt-1 mRNA expression among the analyzed specimens (Figure 1A) ▶ .
Strong Increases of Angiopoietin-2 Levels in Thyroid Neoplasias
Compared to normal thyroid tissues we observed a marked increase in Ang2 mRNA levels in the vast majority of thyroid tumor specimens analyzed (Table 4A) ▶ . Interestingly, whereas papillary microcarcinomas showed no Ang2 up-regulation (Figure 5A) ▶ , almost all of the other PTCs and their nodal metastases displayed a strong (over 10-fold) Ang2 increase (Figure 2) ▶ . Indeed, with few exceptions, all thyroid adenomas, FTCs, UTCs, and MTCs presented Ang2 mRNA levels that rose eight- to 20-fold. These results obtained by semiquantitative RT-PCR were consistent with Northern blot analysis (Figure 5B) ▶ .
Figure 2.

Up-regulation of angiopoietin 2 in thyroid tumors. Total RNA was extracted from normal thyroid tissues and different thyroid tumors. Semiquantitative RT-PCR analysis was performed using 5 μg of total RNA and intron-spanning primers for angiopoietin 1 (Ang1), angiopoietin 2 (Ang2), and Tek. The relative intensities of the bands were densitometrically quantified and normalized to the coamplified aldolase signal (Aldo). The numbers at the top of the figure indicate different patients. N, normal thyroid; Ade, follicular adenoma; PTC, papillary thyroid carcinoma; FTC, follicular thyroid carcinoma; UTC, undifferentiated thyroid carcinoma; MTC, medullary thyroid carcinoma.
We also found a moderate up-regulation of angiopoietin tyrosine kinase receptor Tek in a few PTCs and in most primary and lymph node metastases of MTCs (Figure 2 ▶ and Table 4A ▶ ).
In our thyroid tumors, we also analyzed the expression of both Ang1 and the orphan receptor Tie-1. Ang1 mRNA expression was slightly down-regulated or up-regulated in a few carcinomas (Figure 2) ▶ . No significant differences in the expression of the Tie-1 receptor could be detected (data not shown).
Up-Regulation of VEGF-C and Flt-4 in Lymph Node Invasive Thyroid Tumors
Compared to normal thyroid tissues, we observed a generalized up-regulation of VEGF-C mRNA levels in thyroid neoplasias that frequently present lymph node involvement (Table 4A) ▶ . In fact, only one adenoma and a few FTCs displayed a significant increase in VEGF-C mRNA expression (Figure 3A ▶ and Table 4A ▶ ). Conversely, a two- to fourfold VEGF-C up-regulation was detected in almost 80% of PTCs, which frequently invade cervical nodes, and in five of seven highly invasive UTCs (Figure 4A) ▶ . The papillary microcarcinoma variant that did not show any variation of expression of the angiogenic molecules analyzed presented up-regulation of VEGF-C (Figure 5A) ▶ . Almost all of the tumors arising from neural crest-derived C cells (MTCs) showed a marked increase in VEGF-C expression, up to 20-fold (Figure 3A) ▶ . Northern and Western blot analyses of a representative panel of tumors confirmed these results (Figure 5B ▶ and data not shown). Interestingly, VEGF-C up-regulation was evident specifically in pN1 cases. The augmented expression of VEGF-C in thyroid tumors was also confirmed by immunohistochemical analysis. As shown in Figure 3B ▶ , with respect to normal thyroid tissue, we observed a significant increase in VEGF-C reactivity in epithelial follicular cells of PTCs. A positive reaction was also detected in the endothelial vessel lining cells of both normal and neoplastic tissues (data not shown). This result confirmed that the increment in mRNA expression levels observed coincided with protein increase.
Figure 3.

Expression of VEGF-C and Flt-4 in thyroid tumors. A: Total RNA was extracted from normal thyroid tissue and different thyroid tumor specimens. Semiquantitative RT-PCR analysis was performed using 5 μg of total RNA and intron-spanning primers specific for VEGF-C and Flt-4. The relative intensities of the bands were densitometrically quantified and normalized to the coamplified aldolase signal (Aldo). The numbers at the top of the figure indicate different patients. B: Immunoperoxidase staining of VEGF-C in normal and neoplastic thyroid tissues. Magnification, ×200. N, normal thyroid; Ade, follicular adenoma; PTC, papillary thyroid carcinoma; FTC, follicular thyroid carcinoma; UTC, undifferentiated thyroid carcinoma; MTC, medullary thyroid carcinoma.
Figure 4.
Down-regulation of TSP-1 in thyroid tumors. A: Total RNA was extracted from normal thyroid tissue and different thyroid tumor specimens. Semiquantitative RT-PCR analysis was performed using 5 μg of total RNA and intron-spanning primers specific for TSP-1. The relative intensities of the bands were densitometrically quantified and normalized to the coamplified aldolase signal (Aldo). The numbers at the top of the figure indicate different patients. B: Immunoperoxidase staining of TSP-1 in normal and neoplastic thyroid tissues. Magnification, ×200. N, normal thyroid; Ade, follicular adenoma; PTC, papillary thyroid carcinoma; FTC, follicular thyroid carcinoma; UTC, undifferentiated thyroid carcinoma; MTC, medullary thyroid carcinoma.
Compared to normal thyroid tissues, few PTCs and 50% of their lymph node metastases showed a moderate increase in the VEGF-C tyrosine kinase receptor Flt-4 (Figure 3A ▶ and Table 4A ▶ ). This receptor was also slightly up-regulated in few benign adenomas, FTCs, and UTCs. As for VEGF-C, Flt-4 overexpression was strongly evident in the vast majority of MTCs.
Down-Regulation of Thrombospondin-1 Expression in Aggressive Thyroid Carcinomas
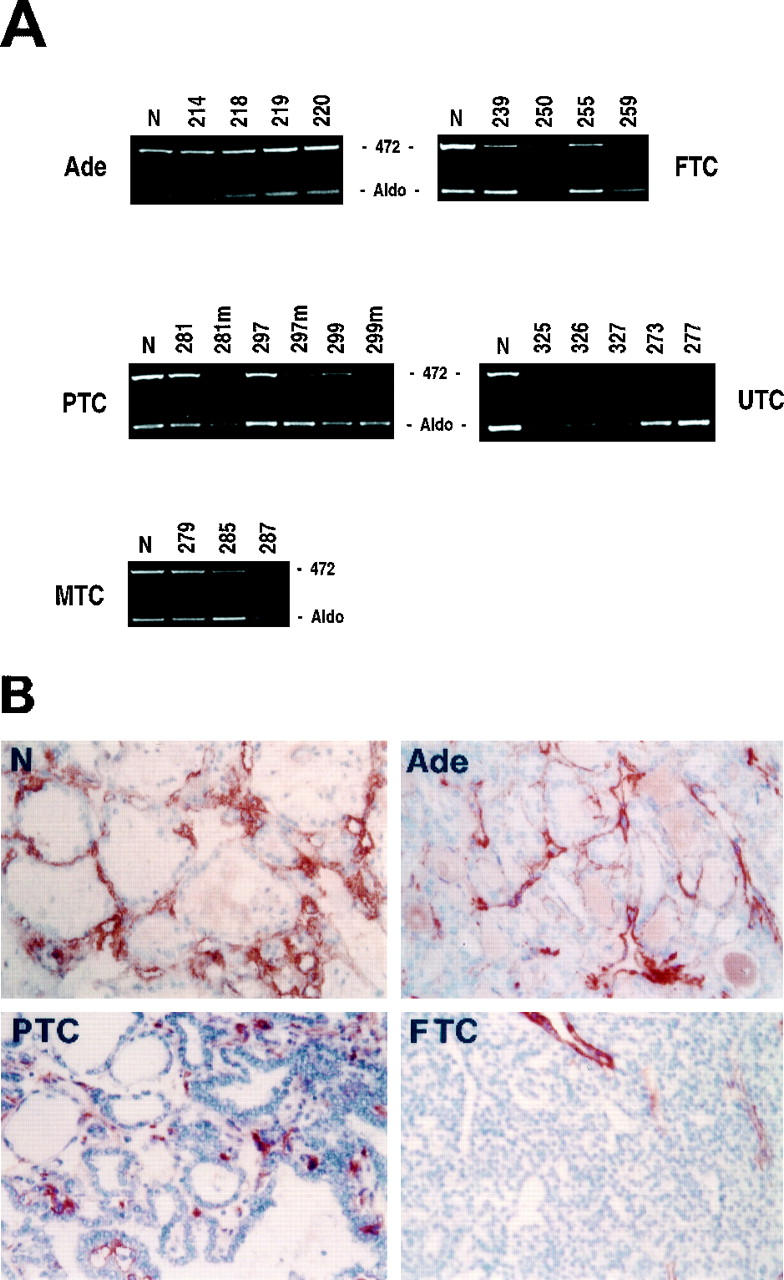
In our cases, TSP-1 expression analysis showed no reduction in mRNA levels in benign adenomas and papillary microcarcinomas (Table 4B ▶ , Figures 4 and 5A ▶ ▶ ). Conversely, 20% of the other PTCs presented a twofold TSP-1 down-regulation that become much more significant in all PTC nodal metastases analyzed (Table 4B ▶ and Figure 4A ▶ ). In contrast, 75% of FTCs presented a remarkable TSP-1 mRNA down-regulation. As for UTCs, in seven of seven neoplasias, TSP-1 expression could not be detected by semiquantitative RT-PCR analysis (Figure 4A) ▶ . Because five of seven undifferentiated tumors presented a mutated form of TP53, 34 these data are in keeping with the previous observation that TP53 regulates TSP-1 transcription. 35 Sixty-seven percent of MTCs showed a TSP-1 reduction, whereas all of their metastatic tissues presented a further TSP-1 down-regulation (Table 4B) ▶ . The same results were also evident by immunohistochemical staining with anti-TSP-1 antibody. In fact, normal thyroid tissues showed a strong immunoperoxidase staining for TSP-1 confined to the interfollicular stroma (Figure 4B) ▶ and, to some extent, to the vascular endothelium (feature not shown). A similar degree of reactivity was found in benign follicular adenomas, although the tissue architecture was altered. In PTCs we observed a slight decrement of TSP-1 staining with respect to normal tissues. In contrast, the malignant follicular carcinomas showed a barely detectable reaction to the anti-TSP-1 antibody (Figure 4B) ▶ . These data were also confirmed by Western blot analysis (data not shown).
Statistical Analysis
We performed statistical analyses to verify the possible associations between the expression levels of angiogenic molecules and clinical pathological features of thyroid tumors, like tumor size (T), presence of lymph node metastases (N1), and presence of distant metastases (M1).
The analysis of clinical pathological characteristics (pTNM) and the expression levels of angiogenic factors in thyroid neoplasias compared to normal tissues showed that two factors were strongly associated with the progression of thyroid tumors from stage T1 to stage T4. In particular, Table 5 ▶ shows a significant association between T-stage progression with high levels of VEGF (P < 0.001) and Ang2 (P < 0.001). Also in the case of KDR, statistical tests yielded significant results showing a clear trend according to T-stage progression (P = 0.037). Thus the up-regulation of the ligand-receptor couple (VEGF/KDR) and Ang2 showed statistical significance when associated with tumor size, suggesting that these factors (as hypothesized by other authors) are associated with neovascularization and tumor growth.
Table 5.
Association between Different Angiogenic Factors and Pathological pTNM Stage in Thyroid Tumors
| VEGF | KDR | VEGF-C | Flt-4 | Ang1 | Ang2 | Tek | TSP-1 | ||
|---|---|---|---|---|---|---|---|---|---|
| T-stage | T1 | 1.00 | 1.60 | 2.00 | 1.00 | 1.00 | 1.60 | 0.90 | 0.92 |
| T2 | 2.00 | 1.50 | 2.60 | 1.30 | 1.00 | 4.00 | 1.00 | 0.48 | |
| T3 | 2.40 | 2.25 | 2.00 | 1.00 | 0.21 | 3.50 | 0.80 | 0.50 | |
| T4 | 4.00 | 3.45 | 2.10 | 1.00 | 0.18 | 8.50 | 1.00 | 0.70 | |
| P value | <0.001 | 0.037 | n.s. | n.s. | 0.033 | <0.001 | n.s. | n.s. | |
| N-stage | N0 | 2.40 | 2.25 | 1.10 | 1.00 | 0.28 | 3.50 | 1.00 | 0.35 |
| N1 | 2.00 | 2.00 | 2.50 | 1.00 | 0.43 | 6.00 | 1.00 | 0.80 | |
| P value | n.s. | n.s. | <0.001 | n.s. | n.s. | n.s. | n.s. | n.s. | |
| M-stage | M0 | 2.30 | 2.50 | 2.20 | 1.00 | 0.65 | 4.00 | 1.00 | 1.00 |
| M1 | 2.00 | 2.00 | 2.00 | 1.00 | 0.13 | 4.00 | 1.00 | 0.20 | |
| P value | n.s. | 0.049 | n.s. | n.s. | 0.018 | n.s. | n.s. | <0.001 |
The numbers indicate the median value of expression levels of the different angiogenic factors in human thyroid tumors with respect to normal tissues. n.s., not significant.
Regarding the ability of tumors to invade regional lymph nodes (pN1), we found that VEGF-C overexpression was associated with lymph node invasion, comparing the levels of VEGF-C mRNA in pN0 and pN1 tumors. Statistical analyses showed that VEGF-C mRNA was up-regulated prominently in node-positive tumors (P < 0.001, Table 5 ▶ ).
We also examined the factor(s) associated with the tumor’s ability to spread by hematic vessels to give distant metastases (pM1). The only significant association between pN1 tumors and angiogenic factors was observed for TSP-1, which was significantly decreased only in tumors able to generate distant metastases (P < 0.001, Table 5 ▶ ).
Regarding discrimination between follicular adenoma and carcinoma, the analysis base logistic discriminant yielded significant results for VEGF (P = 0.011) and TSP-1 (P < 0.001). The discrimination obtained based on TSP-1 expression was relatively high (Somer’s D coefficient = 0.75). In particular, by adopting for this factor a 0.8 cutoff value of expression, all malignant lesions showed TSP-1 down-regulation below the threshold against only five of the 17 adenomas. The corresponding figures of sensitivity and specificity (95% exact confidence intervals) were 100% (74–100) and 71% (44–90), respectively.
Discussion
To grow beyond a critical size, solid tumors must recruit endothelial cells from the surrounding stroma to form their own endogenous microcirculation. With respect to angiogenesis, two phases can be recognized in tumor progression: prevascular and vascular, respectively. The transition from the prevascular to the vascular phase represents the first step toward the activation of the angiogenic phenotype. This angiogenic switch necessitates up-regulation of angiogenic stimulators and, in certain tumors, down-regulation of angiogenesis inhibitors. 20,36-40 Solid tumors can express one or more of these angiogenic factors, which can work synergistically in promoting tumor growth.
As a model of tumor progression, we used a series of thyroid tumors with a variable degree of invasiveness. According to the current understanding of molecular events in thyroid carcinogenesis and progression, 41 we investigated the expression of angiogenic stimulators and inhibitors in different thyroid tumors. Our study showed the up-regulation of Ang2 in thyroid tumors and its association, together with high levels of VEGF, with tumor ability to grow (progression from the pT1 to the pT4 stage). We also found the overexpression of VEGF-C in most thyroid tumors. Interestingly, VEGF-C up-regulation was evident specifically in pN1 cases. In fact, we found a correlation between VEGF-C increase and lymph node invasion (pN1). The expression analysis of the angioinhibitory molecule TSP-1 showed its down-regulation in most aggressive thyroid tumors. These data were also confirmed by statistical analysis, which showed a strict association between TSP-1 down-regulation and tumor ability to elicit distant metastases (pM1).
As previously reported, 42 we observed an increase of VEGF in the vast majority of our thyroid tumor specimens. Moreover, we observed Ang2 mRNA expression in normal thyroid tissues and its up-regulation in thyroid neoplasias, as recently observed in other human tumors. 43 Interestingly, when we analyzed VEGF and Ang2 mRNA levels in a hypovascular stage of thyroid neoplasia (microcarcinoma), we could not detect any appreciable increase. Because previous evidence has shown that microcarcinomas should be included in PTCs, 41 the latter could represent the vascular evolution of the former variant. Furthermore, statistical analyses showed a strong association between pT stage progression of thyroid tumors and high levels of VEGF and Ang2. It has been suggested that VEGF, Ang2, and their cognate receptors may be critical components of the vascular regulatory machinery essential for tumor growth. 19,44 Therefore, we also suggest that in thyroid tumors Ang2 in the presence of VEGF could activate the quiescent vasculature to elicit the angiogenic phenotype that accompanies tumor growth.
Among our series of thyroid tumors, we observed variability in the prevalence of lymph node involvement, as expected (Table 2) ▶ . MTCs and PTCs infiltrated regional nodes in over 80% of cases. FTCs, on the other hand, had a reduced ability to invade through lymphatic vessels, whereas adenomas never spread to lymph nodes. Papillary microcarcinomas tend to infiltrate regional lymph nodes, although they are poorly vascularized tumors. Interestingly, we observed a marked increase in VEGF-C expression in tumors that give lymph node metastases (pN1) as compared to both normal thyroid tissues and node-negative neoplasias (pN0), respectively. In fact we found a strong association between high levels of VEGF-C and lymph node involvement. It has recently been demonstrated that VEGF-C, on binding to both KDR and Flt-4 receptors, can act as a potent angiogenic factor in vivo. 12 However, overexpression of VEGF-C in the skin or pancreas tissues of transgenic mice induced only lymphangiogenesis rather than blood vessel angiogenesis. 45 It is possible that further studies are necessary to assess the role of VEGF-C as an angiogenic or a lymphangiogenic factor. Nevertheless, among our node-positive thyroid tumors, we could not detect any variation in the number of lymphatic or hematic vessels, so we can speculate that VEGF-C, when up-regulated, may affect the structural and/or functional status of the surrounding lymphatic endothelium, thereby facilitating tumor spread to regional lymph nodes. This hypothesis is in agreement with the recent results of Valtola and colleagues, who observed VEGF-C overexpression in breast carcinoma cells. The authors suggested that secreted VEGF-C acts predominantly as an angiogenic factor, although it may also be involved in modifying the permeabilities of both blood and lymphatic vessels and metastasis formation. 46
Considering the ability of thyroid tumors to give rise to distant hematogenous metastases, we found a significant TSP-1 reduction associated with patients presenting with distant metastases (pM1). Thus TSP-1 expression patterns seem to correlate with thyroid tumor invasiveness. In fact, the TSP-1 down-regulation pattern describes well the increasing aggressiveness of the different thyroid lesions. Suggestively, these data perfectly match the progressive worsening, from a clinical point of view, of the different thyroid tumor histotypes. In our cases, based on TSP-1 expression levels, it was also possible to discriminate between benign adenomas and malignant FTCs. Because there is to date no accurate reliable method by which adenomas can be differentiated from FTCs, many patients with thyroid nodules undergo unnecessary surgery. We showed that in our cases it was possible to discriminate between adenomas and FTCs. However, this result must be considered with caution, because of the limited number of specimens analyzed, and further studies on a great number of patients are needed.
Among our series of 84 specimens not all tumors showed up-regulation of the angiogenic molecules analyzed. It is possible that other factors that influence angiogenesis were expressed. We also investigated the expression of the well-characterized angiogenic factors, such as basic fibroblast growth factor (bFGF) and the recently discovered bFGF binding protein, but we did not observe any variation in their expression levels (data not shown). In any case, there are a number of other factors that stimulate angiogenesis and many other mechanisms involving loss of inhibitors that regulate the angiogenic phenotype.
Alterations in the expression levels of angiogenic inducers in our thyroid tumors, combined with the progressive loss of TSP-1, may determine an angiogenic phenotype that correlates with the invasive metastatic potential of these neoplasias. Antiangiogenic therapy is undergoing an extensive analysis, and animal experiments have shown that a combination of antiangiogenic drugs is more effective than a single agent. Thus knowledge of the factors involved in the angiogenic switch and the control of their potential interactions may provide novel therapeutic targets for the management of thyroid neoplasias.
Acknowledgments
We are grateful to Dr. K. Alitalo for providing us with the VEGF-C probe. We also thank Prof. R. Vigneri and Prof. Marco Presta for a critical revision of our work.
Footnotes
Address reprint requests to Dr. Italia Bongarzone, Division of Experimental Oncology A, Istituto Nazionale Tumori, 20133 Milan, Italy. E-mail: bongarzone@istitutotumoci.mi.it.
Supported by the Associazione Italiana per la Ricerca sul Cancro (AIRC), CNR, Project BIOMED2 no. BMH4-C797–2157, and the Istituto Superiore di Sanità.
References
- 1.Risau W, Flamme I: Vasculogenesis. Annu Rev Cell Dev Biol 1995, 11:73-91 [DOI] [PubMed] [Google Scholar]
- 2.Folkman J, D’Amore PA: Blood vessel formation: what is its molecular basis? Cell 1996, 87:1153-1155 [DOI] [PubMed] [Google Scholar]
- 3.Risau W: Mechamisms of angiogenesis. Nature 1997, 386:671-674 [DOI] [PubMed] [Google Scholar]
- 4.Klagsbrun M, D’Amore PA: Regulation of angiogenesis. Annu Rev Physiol 1991, 53:217-239 [DOI] [PubMed] [Google Scholar]
- 5.Ferrara N, Davis-Smyth T: The biology of vascular endothelial growth factor. Endocr Rev 1997, 18:4-25 [DOI] [PubMed] [Google Scholar]
- 6.de Vries C, Escobedo JA, Ueno H, Houck K, Ferrara N, Williams LT: The fms-like tyrosine kinase, a receptor for vascular endothelial growth factor. Science 1992, 255:989-991 [DOI] [PubMed] [Google Scholar]
- 7.Terman BI, Dougher-Vermazen M, Carrion ME, Dimitrov D, Armellino DC, Gospodarowicz D, Bohlen P: Identification of the KDR tyrosine kinase as a receptor for vascular endothelial cell growth factor. Biochem Biophys Res Commun 1992, 187:1579-1586 [DOI] [PubMed] [Google Scholar]
- 8.Quinn TP, Peters KG, de Vries C, Ferrara N, Williams LT: Fetal liver kinase 1 is a receptor for vascular endothelial growth factor and is selectively expressed in vascular endothelium. Proc Natl Acad Sci USA 1993, 90:7533-7537 [DOI] [PMC free article] [PubMed] [Google Scholar]
- 9.Waltenberger J, Claesson-Welsh L, Siegbahn A, Shibuya M, Heldin CH: Different signal transduction properties of KDR and Flt1, two receptors for vascular endothelial growth factor. J Biol Chem 1994, 269:26988-26995 [PubMed] [Google Scholar]
- 10.Kaipainen A, Korhonen J, Mustonen T, van Hinsbergh VW, Fang GH, Dumont D, Breitman M, Alitalo K: Expression of the fms-like tyrosine kinase 4 gene becomes restricted to lymphatic endothelium during development. Proc Natl Acad Sci USA 1995, 92:3566-3570 [DOI] [PMC free article] [PubMed] [Google Scholar]
- 11.Joukov V, Pajusola K, Kaipainen A, Chilov D, Lahtinen I, Kukk E, Saksela O, Kalkkinen N, Alitalo K: A novel vascular endothelial growth factor, VEGF-C, is a ligand for the Flt4 (VEGFR-3) and KDR (VEGFR-2) receptor tyrosine kinases. EMBO J 1996, 15:1751. [PMC free article] [PubMed] [Google Scholar]
- 12.Cao Y, Linden P, Farnebo J, Cao R, Eriksson A, Kumar V, Qi J-H, Claesson-Welsh L, Alitalo K: Vascular endothelial growth factor C induces angiogenesis in vivo. Proc Natl Acad Sci USA 1998, 95:14389-14394 [DOI] [PMC free article] [PubMed] [Google Scholar]
- 13.Jeltsch M, Kaipainen A, Joukov V, Meng X, Lakso M, Rauvala H, Swartz M, Fukumura D, Jain RK, Alitalo K: Hyperplasia of lymphatic vessels in VEGF-C transgenic mice. Science 1997, 276:1423-1425 [DOI] [PubMed] [Google Scholar]
- 14.Iwama A, Hamaguchi I, Hashiyama M, Murayama Y, Yasunaga K, Suda T: Molecular cloning and characterization of mouse TIE and TEK receptor tyrosine kinase genes and their expression in hematopoietic stem cells. Biochem Biophys Res Commun 1993, 195:301-309 [DOI] [PubMed] [Google Scholar]
- 15.Schnurch H, Risau W: Expression of tie-2, a member of a novel family of receptor tyrosine kinases, in the endothelial cell lineage. Development 1993, 119:957-968 [DOI] [PubMed] [Google Scholar]
- 16.Dumont DJ, Gradwohl G, Fong GH, Puri MC, Gertsenstein M, Auerbach A, Breitman ML: Dominant-negative and targeted null mutations in the endothelial receptor tyrosine kinase, tek reveal a critical role in vasculogenesis of the embryo. Genes Dev 1994, 8:1897-1909 [DOI] [PubMed] [Google Scholar]
- 17.Davis S, Aldrich TH, Jones PF, Acheson A, Compton DL, Jain V, Ryan TE, Bruno J, Radziejewski C, Maisonpierre PC, Yancopoulos GD: Isolation of angiopoietin-1, a ligand for TIE2 receptor, by secretion-trap expression cloning. Cell 1996, 87:1161-1169 [DOI] [PubMed] [Google Scholar]
- 18.Suri C, Jones PF, Patan S, Bartunkova S, Maisonpierre PC, Davis S, Sato TN, Yancopoulos GD: Requisite role of angiopoietin-1, a ligand for the TIE2 receptor, during embryonic angiogenesis. Cell 1996, 87:1171-1180 [DOI] [PubMed] [Google Scholar]
- 19.Maisonpierre PC, Suri C, Jones PF, Bartunkova S, Wiegand SJ, Radziejewski C, Compton D, McClain J, Aldrich TH, Papadopoulos N, Daly TJ, Davis S, Sato TN, Yancopoulos GD: Angiopoietin-2, a natural antagonist for Tie2 that disrupts in vivo angiogenesis. Science 1997, 277:55-60 [DOI] [PubMed] [Google Scholar]
- 20.Hanahan D, Folkman J: Patterns and emerging mechanisms of the angiogenic switch during tumorigenesis. Cell 1996, 86:353-364 [DOI] [PubMed] [Google Scholar]
- 21.Taraboletti G, Roberts D, Liotta LA, Giavazzi R: Platelet thrombospondin modulates endothelial cell adhesion, motility, and growth: a potential angiogenesis regulatory factor. J Cell Biol 1990, 111:765-772 [DOI] [PMC free article] [PubMed] [Google Scholar]
- 22.O’Reilly MS, Holmgren L, Shing Y, Chen C, Rosenthal RA, Moses M, Lane WS, Cao Y, Sage EH, Folkman J: Angiostatin: a novel angiogenesis inhibitor that mediates the suppression of metastases by a Lewis lung carcinoma. Cell 1994, 79:315-328 [DOI] [PubMed] [Google Scholar]
- 23.O’Reilly MS, Boehm T, Shing Y, Fukai N, Vasios G, Lane WS, Flynn E, Birkhead JR, Olsen BR, Folkman J: Endostatin: an endogenous inhibitor of angiogenesis and tumor growth. Cell 1997, 88:277-285 [DOI] [PubMed] [Google Scholar]
- 24.Bornstein P: Diversity of function is inherent matricellular proteins: an appraisal of thrombospondin 1. J Cell Biol 1995, 130:503-506 [DOI] [PMC free article] [PubMed] [Google Scholar]
- 25.Roberts DD: Regulation of tumor growth and metastasis by thrombospondin-1. FASEB J 1996, 10:1183-1191 [PubMed] [Google Scholar]
- 26.Tuszynski GP, Nicosia RF: The role of thrombospondin-1 in tumor progression and angiogenesis. Bioessays 1996, 18:71-76 [DOI] [PubMed] [Google Scholar]
- 27.Weinstat-Saslow DL, Zabrenetzky VS, VanHoutte K, Frazier WA, Roberts DD, Steeg PS: Transfection of thrombospondin 1 complementary DNA into a human breast carcinoma cell line reduces primary tumor growth, metastatic potential, and angiogenesis. Cancer Res 1994, 54:6504-6511 [PubMed] [Google Scholar]
- 28.Pierotti MA, Bongarzone I, Borrello MG, Greco A, Pilotti S, Sozzi G: Cytogenetics and molecular genetics of the carcinomas arising from the thyroid epithelial follicular cells. Genes Chromosomes Cancer 1996, 16:1-14 [DOI] [PubMed] [Google Scholar]
- 29.Hermanek P, Sobin LH: Hermanek P Sobin LH eds. TNM Classification of Malignant Tumours. 1987, :pp 33-35 Springer-Verlag, Berlin, Heidelberg, New York, [Google Scholar]
- 30.Bunone G, Borrello MG, Picetti R, Bongarzone I, Peverali FA, de Franciscis V, Della Valle G, Pierotti MA: Induction of RET proto-oncogene expression in neuroblastoma cells precedes neuronal differentiation and is not mediated by protein synthesis. Exp Cell Res 1995, 217:92-99 [DOI] [PubMed] [Google Scholar]
- 31.Cattoretti G, Pileri S, Parravicini C, Becker MHG, Poggi S, Bifulco C, Key G, D’Amato L, Sabattini E, Feudale E, Reynolds F, Gerdes J, Rilke F: Antigen unmasking on formalin-fixed, paraffin embedded tissue section. J Pathol 1993, 71:83-98 [DOI] [PubMed] [Google Scholar]
- 32.Pilotti S, Della Torre G, Lavarino C, Di Palma S, Sozzi G, Minoletti F, Rao S, Pasquini G, Azzarelli A, Rilke F, Pierotti MA: Distinct mdm2/p53 expression patterns in liposarcoma subgroups: implications for different pathogenetic mechanisms. J Pathol 1997, 181:14-24 [DOI] [PubMed] [Google Scholar]
- 33.Leung DW, Cachianes G, Kuang WJ, Goedded DV, Ferrara N: Vascular andothelial growth factor is a secreted angiogenic mitogen. Science 1989, 246:1306-1309 [DOI] [PubMed] [Google Scholar]
- 34.Donghi R, Longoni A, Pilotti S, Michieli P, Della Porta G, Pierotti MA: Gene p53 mutations are restricted to poorly differentiated and undifferentiated carcinomas of the thyroid gland. J Clin Invest 1993, 91:1753-1760 [DOI] [PMC free article] [PubMed] [Google Scholar]
- 35.Dameron KM, Volpert OV, Tainsky MA, Bouck N: Control of angiogenesis in fibroblasts by p53 regulation of thrombospondin-1. Science 1994, 265:1582-1584 [DOI] [PubMed] [Google Scholar]
- 36.Folkman J: Angiogenesis in cancer, vascular, rheumatoid and other disease. Nature Med 1995, 1:27-31 [DOI] [PubMed] [Google Scholar]
- 37.O’Reilly MS, Holmgren L, Shing Y, Chen C, Rosenthal RA, Moses M, Lane M, Cao Y, Sage EH, Folkman J: Angiostatin: a novel angiogenesis inhibitor that mediates the suppression of metastases by Lewis lung carcinoma. Cell 1994, 79:315-328 [DOI] [PubMed] [Google Scholar]
- 38.Folkman J: Clinical applications of research on angiogenesis. N Engl J Med 1995, 333:1757-1763 [DOI] [PubMed] [Google Scholar]
- 39.Rastinejad F, Polverini P, Bouck N: Regulation of the activity of a new inhibitor of angiogenesis by a cancer suppressor gene. Cell 1989, 56:345-355 [DOI] [PubMed] [Google Scholar]
- 40.Sharpe R, Yer H, Scott C, Bauer S, Maione T: Growth inhibition of murine melanoma and human colon carcinoma by by recombinant human platelet factor 4. J Natl Cancer Inst 1990, 82:848-853 [DOI] [PubMed] [Google Scholar]
- 41.Farid NR, Shi Y, Zou M: Molecular basis of thyroid cancer. Endocr Rev 1994, 15:202-232 [DOI] [PubMed] [Google Scholar]
- 42.Viglietto G, Maglione D, Rambaldi M, Cerutti J, Romano A, Trapasso F, Fedele M, Ippolito P, Chiappetta G, Botti G, Fusco A, Persieo MG: Upregulation of vascular endothelial growth factor (VEGF) and downregulation of placenta growth factor (PlGF) associated with malignancy in human thyroid tumors and cell lines. Oncogene 1995, 11:1569-1579 [PubMed] [Google Scholar]
- 43.Stratmann A, Risau W, Plate KH: Cell type-specific expression of angiopoietin-1 and angiopoietin-2 suggest a role in glioblastoma angiogenesis. Am J Pathol 1998, 153:1459-1466 [DOI] [PMC free article] [PubMed] [Google Scholar]
- 44.Holesh J, Maisonpierre PC, Compton D, Boland P, Alexander CR, Zagzag D, Yancopoulos GD, Wiegand SJ: Vessel cooption, regression, and growth in tumors mediated by angiopoietin and VEGF. Sceince 1999, 284:1994-1998 [DOI] [PubMed] [Google Scholar]
- 45.Korpelainen EI, Alitalo K: Signaling angiogenesis and lymphangiogenesis. Curr Opin Cell Biol 1998, 10:159-164 [DOI] [PubMed] [Google Scholar]
- 46.Valtola R, Salven P, Heikkila P, Taipale J, Joensuu H, Rehn M, Pihlajaniemi T, Weich H, deWaal R, Alitalo K: VEGFR-3 and its ligand VEGF-C are associated with angiogenesis in breast cancer. Am J Pathol 1999, 154:1381-1390 [DOI] [PMC free article] [PubMed] [Google Scholar]