

Abstract
High velocity cytoplasmic streaming is found in various plant cells from algae to angiosperms. We characterized mechanical and enzymatic properties of a higher plant myosin purified from tobacco bright yellow-2 cells, responsible for cytoplasmic streaming, having a 175 kDa heavy chain and calmodulin light chains. Sequence analysis shows it to be a class XI myosin and a dimer with six IQ motifs in the light chain-binding domains of each heavy chain. Electron microscopy confirmed these predictions. We measured its ATPase characteristics, in vitro motility and, using optical trap nanometry, forces and movement developed by individual myosin XI molecules. Single myosin XI molecules move processively along actin with 35 nm steps at 7 μm/s, the fastest known processive motion. Processivity was confirmed by actin landing rate assays. Mean maximal force was ∼0.5 pN, smaller than for myosin IIs. Dwell time analysis of beads carrying single myosin XI molecules fitted the ATPase kinetics, with ADP release being rate limiting. These results indicate that myosin XI is highly specialized for generation of fast processive movement with concomitantly low forces.
Keywords: in vitro motility/myosin XI/optical trap/processivity/single molecule
Introduction
Cytoplasmic streaming, found in various plant cells from algae to angiosperms with velocities up to 100 µm/s, is the fastest known acto-myosin movement (Kamiya, 1981; Shimmen and Yokota, 1994). Myosins play important functional roles within plant cells in driving actin-based motility such as intracellular vesicle and membrane transport (Reddy, 2001). Although many plant myosin genes have been cloned (Kashiyama et al., 2000; Morimatsu et al., 2000; Reddy, 2001), only a few plant myosins that retain their motile activities in vitro have been purified and characterized (Yamamoto et al., 1994; Yokota and Shimmen, 1994; Higashi-Fujime et al., 1995; Yokota et al., 1999). Therefore, there is only limited understanding of the mechanical properties of plant myosins (Higashi-Fujime and Sumiyoshi, 2001; Kimura et al., 2002), especially from angiosperms, owing to their lability and susceptibility to proteolytic degradation. We separated intact myosins from cultured tobacco bright yellow-2 cells into two isoforms, termed 170 and 175 kDa, which were associated with calmodulin and retained Ca2+ sensitivity in actin motility assays (Yokota et al., 1999). Protein characterization and immunohistochemistry of these myosins revealed that the epitopes of anti-myosin antibodies localized on vesicular organelles, suggesting that these myosins were involved in cytoplasmic streaming (Yokota et al., 2001). From their cellular functions, it is expected that these myosins would be highly processive, enabling them to move their cargo without their detachment from actin filaments. The 175 kDa myosin is suitable for single molecule assays since it does not form aggregates even at low ionic strength. Here, we show that this 175 kDa myosin is a member of myosin class XI, has similar morphology to myosin V in electron micrographs and that single myosin XI molecules move processively along actin filaments in 35 nm steps with a velocity of 7 µm/s at 20°C and 1 mM ATP: this is the fastest known processive movement. The mean maximal force was 0.5 pN, smaller than produced by muscle myosin IIs (Finer et al., 1994; Guilford et al., 1997) or by myosin V (Rief et al., 2000; Veigel et al., 2002). These results indicate that this myosin XI steps processively along the actin helical repeat like myosin V (Mehta, 2001) and VI (Rock et al., 2001; Nishikawa et al., 2002), but with 10-fold faster velocity like non-processive myosin IIs (Anson, 1992).
Results
Purification of 175 kDa myosin XI
The 175 kDa myosin was isolated from cultured tobacco bright yellow-2 cells of Nicotiana tabacum (BY-2 cell) basically according to the method of Yokota et al. (1999). The purity of this myosin was examined by 5% SDS–PAGE with silver staining (Figure 1A). No significant contamination by other myosins (particularly the 170 kDa myosin) and no aggregation was detected, as reported by Yokota et al. (1999). Since plant myosins in general are labile, we used 175 kDa myosin for functional studies within 2 days of preparation.

Fig. 1. Sequence and morphology of myosin XI. (A) SDS–PAGE of purified 175 kDa myosin, which runs at 150 kDa. (B) Comparison of the primary structures of 175 kDa myosin, MYA1 and myosin V. The head domain of 175 kDa myosin (red) is followed by six repeats of some 23 amino acid residues with a consensus sequence (I/L)QXXXRXXXAR known as IQ motifs (blue, IPR000048). Regions downstream of these six IQ motifs containing 84 and 82 amino acid residues have the potential to form α-helical coiled-coils (yellow), suggesting that this myosin may dimerize. Dilute domains (IPR002710) are indicated in green. (C) The rotary-shadowed myosin conformers were visualized by electron microscopy in the absence of nucleotide. Note that each myosin molecule has two globular heads with a size and shape larger than myosin II. The length of its stalk is ∼25 nm, ending in globular tail domains. Scale bar, 50 nm.
Sequence analysis and morphology of myosin XI
cDNA encoding the 175 kDa myosin from an N.tabacum cDNA library was cloned, including 1362 amino acids starting 12 amino acids upstream of the P-loop (GESGAGKT) to the C-terminus. Sequencing the cDNA revealed that this myosin shares 60% sequence identity with MYA1 (DDBJ/EMBL/GenBank accession No. Z28389) (Kinkema and Schiefelbein, 1994) and 75% with MYA2 (DDBJ/EMBL/GenBank accession No. Z34293) (Kinkema et al., 1994) of Arabidopsis thaliana, both of which are members of myosin class XI. The amino acid sequence of the C-terminal peptide fragments (14 amino acids) of 175 kDa myosin exactly matched that deduced from the cDNA. This indicates that the amino acid sequence deduced from the cDNA really is that of 175 kDa myosin. A non-rooted phylogenetic tree was created based on the neighbor-joining method using the program in Clustal_X (Thompson et al., 1997) showing a bootstrap value of 1000 at the node where MYA2 branched to this myosin. These results support classification of this 175 kDa myosin within myosin class XI. In common with all known sequences of plant myosin XIs (Kashiyama et al., 2000; Morimatsu et al., 2000; Reddy, 2001; Yokota et al., 2001), this 175 kDa myosin is predicted to have six IQ motifs per heavy chain in the light chain-binding domain that normally bind six calmodulin molecules, and to have an α-helical coiled-coil domain leading to dimer formation (Figure 1B). In the center of this domain, 10 amino acids break the α-helical coiled-coil structure, representing a putative hinge region.
Electron microscopy of rotary shadowed 175 kDa myosin confirmed predictions from the sequence: there are two head domains including an elongated neck ∼33 nm in total length, much larger than for myosin II (Figure 1C). This feature is different from Chara myosin XI which has two heads of similar size and shape to those of myosin II (Yamamoto et al., 1995). The two neck domains join at a thin stalk extending for ∼25 nm. Two globular domains are found at the tail of the molecule. This structural organization is analogous to that of myosin V (Espreafico et al., 1992; Walker et al., 2000), whose mechanical properties have been studied extensively (Rief et al., 2000; Mehta, 2001; Veigel et al., 2002). This 175 kDa myosin hereafter is called myosin XI.
Processivity of myosin XI
In order to characterize the mechanical properties of myosin XI, we first used the in vitro motility assay (Kron et al., 1991; Yokota et al., 1999) in which actin filaments glide over glass surfaces coated with myosin at low calcium concentration (pCa >8). The direction of myosin movement was examined using actin filaments marked at the pointed end (Wells et al., 1999): these filaments moved with the minus end leading, indicating that myosin XI moves towards the plus end on actin (data not shown). Sliding velocities of fluorescently labeled actin filaments depended on ATP concentration in a Michaelis–Menten-like manner: at 20°C, Km for ATP was 100 ± 17 µM and Vmax was 4.6 ± 0.2 µm/s (Figure 2A, red triangles). This maximum sliding velocity of actin filaments was comparable with the velocities of cytoplasmic streaming observed in vivo (Yokota et al., 1999) and three times that observed for skeletal myosin under similar conditions (Anson, 1992). In addition, continuous movement of actin filaments shorter than 1 µm with constant maximal velocity was observed even at low surface densities of myosin XI (<50 molecules/µm2), indicating that it is a processive motor undergoing multiple ATPase cycles before dissociating from actin filaments. In contrast, 600 molecules/µm2 of rabbit skeletal heavy meromyosin were required for the continuous movement of actin filaments longer than 1.1 µm (Toyoshima et al., 1990).

Fig. 2. Processivity of myosin XI. (A) ATP concentration dependence of actin-activated ATPase (black circles), gliding velocity of fluorescently labeled actin filaments on myosin XI-coated surfaces (red triangles) and the velocity of beads carrying a single active myosin XI molecule moving on F-actin (green squares). Error bars indicate SDs for ATPase and SEMs for velocities. The curves are fits by the Michaelis–Menten equation: black, maximum ATPase rate, Vmax = 76.3 ± 2.5/s/head, and Km = 81.1 ± 1.0 µM; the red curve has maximal gliding velocity, Vmax = 4.6 ± 0.2 µm/s, and Km = 100 ± 17 µM; green has maximum bead velocity, Vmax = 7.7 ± 0.5 µm/s, and Km = 90 ± 24 µM. (B) Dependence of actin filament attachment rate, number observed per mm2/s, on the density of myosin XI-coated glass surfaces. Data are well fitted by the first-power dependence of the landing rate on surface density (black line), as expected for a processive motor; the red broken line indicates a second-power model. (C) Dependence of the actin-activated ATPase rate upon F-actin concentration. The black curve is a Michaelis–Menten fit with maximum rate, Vmax = 77.2 ± 2.8/s/head, and Kapp = 9.8 ± 1.0 µM.
We also measured the rate at which actin filaments came out of bulk solution, bound and then moved over surfaces coated with myosin XI. The attachment rate plotted against myosin surface density (Figure 2B) is well fitted by the theoretical relationship for a single myosin molecule being sufficient for attachment and motility of actin filaments (Hancock and Howard, 1998). The fraction of actin filaments that moved further than their own length before leaving the surface gradually decreased from 100% to 0 as myosin density was lowered. Actin filaments observed at very low myosin surface densities rotated erratically about a vertical axis through a fixed point on the surface, where a single myosin molecule presumably is located, while still progressing as expected for processive motors (for details see the Supplementary data available at The EMBO Journal Online).
To assess this processivity further, we undertook steady-state kinetic analyses of the myosin XI. Actin-activated ATPase rates were measured in the same solution as that used for in vitro motility assays, and yielded values of Kapp for F-actin = 9.8 ± 1.0 µM and Vmax = 77.2 ± 2.8/s/head at 20°C (Figure 2C). In the presence of 48 µM F-actin, the ATPase showed Michaelis–Menten kinetics, with Km for ATP = 81.1 ± 1.0 µM and Vmax = 76.3 ± 2.5/s/head (Figure 2A, black circles). Thus the actin-activated Mg-ATPase of this myosin under steady-state conditions is characterized by a high Vmax but a relatively low Kapp for actin compared with skeletal myosin II (Oiwa et al., 2000).
Kinetic processivity, defined as the average number of ATPase cycles before dissociation of motors (myosin) from their track (actin), can be established using criteria derived from studies of kinesin processivity (Hackney, 1995). These criteria may be applied to this myosin XI as they were for myosin V (De La Cruz et al., 1999; Trybus et al., 1999). The second-order rate constant derived from kcat/Kapp is one such criterion (Hackney, 1995): a value of >107/M/s indicates many ATPase cycles per diffusional encounter between myosin and F-actin (Trybus et al., 1999); for myosin XI it is 7.9 × 10⁶/M/s at 20°C, suggesting a processive motor. Another such criterion is the ratio of Km for the actin-activated ATPase to that of motility (Leibler and Huse, 1993). Motors with high duty ratios have high Km ratios close to unity, e.g. kinesin has a ratio of unity. Motors with two heads and high Km ratios tend to be highly processive (Hancock and Howard, 1998; De La Cruz et al., 1999). For this myosin, Km (ATPase)/Km (motility) is 81 µM/100 µM = 0.81, again suggesting that myosin XI has a high duty ratio and is a processive motor. These calculations fit well with the expected cellular roles of myosin XI and demonstrate its processivity.
Effects of ADP on mean velocity of actin filaments moving on myosin XI-coated surfaces
Examination of the effect of addition of ADP to actively cycling myosin XI is important since it is generally believed that ADP release is the rate-limiting step in the chemomechanical cycle of processive motors, such as myosin V (De La Cruz et al., 1999; Rief et al., 2000). Analysis of the sliding velocity of actin filaments in the presence of ADP provides information about the ADP dissociation transition from this myosin XI (Figure 3). The ATP concentration was held at 20, 100 or 500 µM, and the ADP concentration was varied. The Dixon plot clearly indicates that ADP acts on the velocity as a competitive inhibitor (Figure 3, inset). The mechanism of ADP inhibition on the sliding velocity was modeled as: rebinding of ADP or binding of a new ADP to the active site of myosin competes with binding of a fresh ATP after product release. Least-squares fits to Equation 1 with fixed Km = 100 µM (determined above),

Fig. 3. Effect of ADP on mean velocity of actin filaments moving on a myosin XI-coated surface. Each data point is the average of 10–20 filaments, and error bars are ±SD. The ATP concentration was held at either 20 (red dots), 100 (blue) or 500 µM (green), while the ADP concentration was varied. Inset: Dixon plot, in which the data are re-plotted as the inverse velocity versus ADP concentration, showing that ADP competed with ATP. The intersection of the three lines corresponds to a Kd for ADP of 42 ± 4 µM.
V = Vmax [ATP]/{Km (1 + [ADP]/Kd) + [ATP]}(1)
gave a dissociation constant for ADP from the acto-myosin complex of 42 ± 4 µM, which is much smaller than for skeletal muscle myosin (Homsher et al., 1992) or smooth muscle myosin (Warshaw et al., 1991).
Stepwise movements of single myosin XI molecules
Precisely measuring the movement of individual myosin XI molecules should help to elucidate mechanisms for processive motion on actin for this myosin XI as implied from the kinetic studies above, so we performed a bead assay using an optical trap (Kojima et al., 1997; Sakakibara et al., 1999). Polystyrene beads were first coated with an excess of antibody molecules against the C-terminal sequence of myosin XI (Figure 4A). These beads were then coated with various densities of myosin XI molecules by mixing myosin solutions with beads at various molar ratios. After introducing beads into the observation cell with 1 µM–1 mM ATP, a freely diffusing bead was captured with the optical trap and brought into contact with a single actin filament bound to the glass surface. Within 30 s, beads that had bound to an actin filament commenced movement.
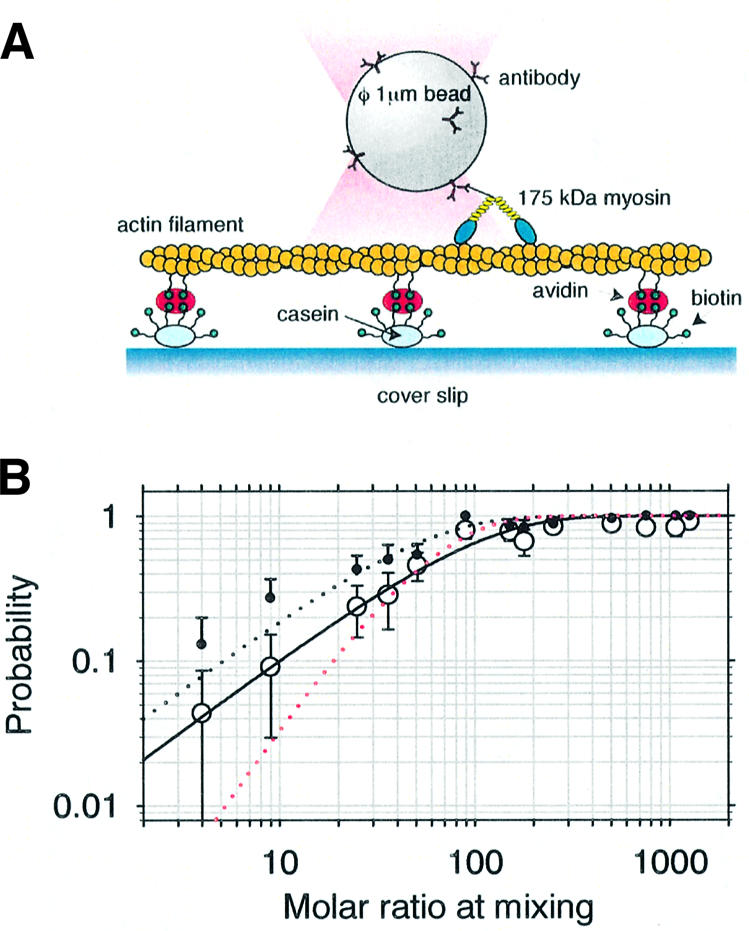
Fig. 4. Optical trap nanometry of myosin XI-coated beads. (A) Schematic drawing of the experimental arrangement. Partially biotinylated actin filaments were attached to biotinylated casein-coated glass surfaces via avidin. (B) Fraction of beads binding (black dots) and then moving (open circles) as a function of the molar mixing ratio, n, of myosin molecules to beads at incubation. The fitted curves are (1 – e–n/λ), with the binding efficiency λ = 49.1 ± 6.8 (χ2 = 3.9) for beads binding (black dotted line) and λ = 94.7 ± 13.6 (χ2 = 2.9) for moving beads (black line); a two-molecule model (red dotted line) yields χ2 = 13.2.
The relative frequency of binding, and hence movement, depends on myosin:bead stoichiometries. Assuming that one active myosin molecule attached to a bead with a geometry favorable for interaction suffices to bind that bead to an actin filament, the fraction of beads bound to actin filaments should follow Poisson statistics (Block et al., 1990). It was confirmed that single myosin molecules are sufficient to move beads by the observed statistics (Figure 4B, solid curve) with probability P(n) = (1 – e–n/λ), where n is the number ratio of myosin molecules mixed with beads and λ is a fitting parameter, showing a Poisson distribution. The slightly lower values for moving beads (Figure 4B, circles) compared with the bound beads (Figure 4B, black dots) may reflect the fraction of the myosin molecules that can bind to actin filaments but cannot move due to unfavorable bead attachment geometry restricting motor movement. The experiments described here were conducted using beads having myosin:bead stoichiometries low enough such that there was <40% probability of binding and hence movement, so the Poisson probability that a bead carried two or more active myosin molecules was <0.09. Assuming a random distribution of myosin molecules over the bead surface and allowing a 60 nm reach for each myosin molecule’s tether (see Figure 1C), the probability that two or more myosin molecules on the same 1 µm diameter bead were able to interact simultaneously with an actin filament is <0.035.
Trap stiffness was chosen to be as small as possible in order to permit measurements with sufficiently large displacement of the bead whilst not exceeding the linear range of the sensor. For these measurements, a compliant optical trap, 4.6 fN/nm, was used. When a trapped bead was brought into contact with an actin filament, it attached and executed transient movements along the actin filament direction (Figure 5A), such that several runs occurred as a cluster. In such clusters, beads progressed for various periods and then were drawn rapidly back to the trap center, whereupon they rebound and recommenced moving. Multiple cycles of attachment, movement and release were observed with the same bead. The average distance moved was 126 ± 76 nm (mean ± SD, n = 355) at 1 µM ATP, corresponding to a trap force of 0.58 ± 0.35 pN, and 113 ± 54 nm (mean ± SD, n = 532) at 100 µM ATP, corresponding to a force of 0.52 ± 0.25 pN (Figure 5B). At 100 µM ATP, we defined the stall force as the force at which movement of the bead was stalled within ±35 nm positional fluctuation for >0.1 s. Since the beads often dissociated before slowing down substantially, most forces calculated here do not correspond to a stall force but rather a yielding force. The mean stall force was 0.60 ± 0.25 pN, n = 85 and that of yielding force was 0.50 ± 0.25 pN, n = 447 at 100 µM ATP. There seems to be no substantial difference between these forces, so that we refer to the maximal force generated in each run without distinguishing stall or yielding forces. This maximal force did not depend significantly upon ATP concentration.

Fig. 5. Force generation and movement of myosin XI-coated beads. (A) Records of force and movement generated by myosin XI at the ATP concentrations indicated. The traces show movement of an individual bead along an actin filament. Displacements of beads from the trap center were measured over 60 s. All traces were filtered using a low-pass Butterworth filter (two-pole, –3 dB at 10 Hz). (B) Distribution of the maximal force at 1 µM (cyan bars) and 100 µM ATP (gray bars).
The maximal sliding velocities of beads were derived by fitting lines to segments of movement with between 0 and 0.3 pN force at various concentrations of ATP in order to compare them with the actin-activated ATPase rate. In these segments, the line fitting yielded reliable velocities in spite of the stochastic nature of the stepping process at low ATP concentrations. The maximal velocity of bead movement at saturating ATP concentration was estimated to be 7.7 ± 0.5 µm/s (Figure 2A, green squares) from the fit by the Michaelis–Menten equation (Figure 2A, green curve). Km was estimated to be 90 ± 24 µM, which was between that for ATPase (81 µM) and that for actin motility (100 µM) (Figure 2A). This maximal velocity of beads was nearly 2-fold faster than the gliding velocity, 4.6 µm/s, of actin filaments moving in the in vitro motility assay (Figure 2A), and hence closer to velocities of cytoplasmic streaming observed in vivo (Yokota et al., 1999).
We also measured the distance (run length) moved by these beads without trapping after bringing them into contact with actin filaments using the optical trap (Figure 6A). Beads having a probability of binding and hence moving between 0.28 and 0.33 were used. Beads that moved >1 µm were measured, since displacements <1 µm are difficult to distinguish from Brownian motion. Histograms of run length at 1, 10, 100 µM and 1 mM ATP show single exponential distributions with mean distances traveled of 1.11–1.43 µm (1.28 ± 0.13 µm, mean ± SEM, n = 4) (Figure 6B). No significant tendency of change in mean distance with ATP concentration was observed. Even though this myosin XI carried a bead 1 µm in diameter, the mean distance is comparable with that obtained from single molecule optical measurements of myosin V (Sakamoto et al., 2000). The probability of myosin XI detachment from an actin filament is estimated to be 0.027 per step (35 nm/1.28 µm). Therefore, the detachment of the beads from actin filaments observed under load (Figure 5A) is due mainly to a load-dependent transition.

Fig. 6. Processive movement of a myosin XI-coated bead. (A) Two time courses of myosin-coated bead movement on an actin filament in the presence of 100 µM ATP. Panels in each column display the same spatial field at the relative times shown on the left. Arrowheads indicate the bead. Scale bar is 2 µm. (B) The run length distributions of bead movements at various ATP concentrations. Since the size of the first bin was half that of the others, the number of events therein was compensated by a factor of 2. The solid curves are exponential distributions fitted to the data, with length constants 1.43, 1.11, 1.24 and 1.32 µm at 1, 10, 100 µM and 1 mM, respectively.
In records of bead displacement, thermal noise decreased as the beads developed greater force (Figures 5A and 7A), indicating a non-linear elasticity, the total (glass–F-actin–myosin–bead–trap) linkage stiffness becoming greater with increasing extension. This phenomenon, a departure from Hooke’s law, was also reported for kinesin-coated (Svoboda et al., 1993) and dynein-coated beads (Sakakibara et al., 1999).

Fig. 7. Step size measurements for myosin XI. (A) Detailed movement of a myosin-coated bead in the presence of 1 µM (left panel) and 100 µM ATP (right panel). Horizontal gridlines are spaced at 35 nm. Multiple steps were observed in both. (B) The step size distributions of bead movement at 1 µM (cyan bars) and 100 µM ATP (gray bars). The solid curve is a Gaussian distribution fitted to the data at 1 µM ATP with peak position 35 ± 4.3 nm; the dotted curve is a fit for data at 100 µM ATP showing peaks at 35 ± 3.1 and 70 ± 4.4 nm.
At forces >0.5 pN, stepwise movement of beads was clearly observed not only at low ATP concentrations but also at high concentrations (Figures 5A and 7A). Thus we then focused on the stepwise movement at forces >0.5 pN. The histogram of the distance moved between dwells shows that this stepwise movement occurred in 35.0 ± 4.3 nm steps, corresponding closely to the 36 nm pseudo-repeat of the actin helix (Figure 7B). At 100 µM and 1 mM ATP, stepwise movement seemed sometimes to occur at 70 nm, possibly due in part to the limited time resolution of the system (τrise ∼7 ms at fc = 50 Hz); hence, the step size distribution showed a second peak (Figure 7B).
Dwell time analysis at various nucleotide concentrations
In order to correlate the ATPase cycle and the stepwise movements of single myosin molecules, the dwell times of steps were measured at three ATP concentrations (1, 10 and 100 µM). Since the dwell time became shorter than the temporal resolution of the system (τrise ∼7 ms at fc = 50 Hz) as the ATP concentration increased, mean dwell time at 1 mM ATP was not measured directly but was estimated as 35 nm/(velocity at >0.5 pN). The velocity at >0.5 pN was calculated by fitting lines to segments of movement between 0.5 pN and maximal force, giving a mean value of 2.9 ± 1.2 µm/s. Thus the mean dwell time at 1 mM ATP was estimated to be ∼12 ms. The mean rate constants calculated from the mean dwell times at 1, 10 and 100 µM ATP were 0.91, 2.89 and 39.7/s, respectively, and at 1 mM ATP, 82.9/s. Thus we obtained a hyperbolic relationship between the mean rate constants and ATP concentration (Figure 8A).

Fig. 8. Dwell time distributions for myosin XI. (A) Dependence of apparent rate constant on ATP concentration. The apparent rate constants were obtained by averaging the dwell times under loads higher than 0.5 pN at various ATP concentrations. The curve is a fit to kmean = k+4k+1[ATP]/(k+4 + k+1[ATP]), where k+4 represents the ADP dissociation rate and k+1 the rate of ATP binding, yielding k+4 = 95 ± 4/s and k+1 = 0.6 ± 0.1/µM/s. (B) Distributions of dwell time under loads higher than 0.5 pN at various concentrations of ATP. Solid curves represent double exponential fits with one rate constant fixed to 95/s, yielding second rate constants of 1.0 ± 0.1, 4.5 ± 0.6 and 47 ± 28/s (±SEM) at 1, 10 and 100 µM ATP, respectively. The mean dwell time τ is shown in each panel. (C) The dwell time distributions at 100 µM ATP in the presence of 200 or 400 µM ADP are shown, with double exponential fits to these plotted as continuous curves. The rate constants obtained are 370 ± 40 and 15.3 ± 1.6/s for 200 µM ADP, and 580 ± 51 and 9.9 ± 0.9/s for 400 µM ADP, yielding apparent rate constants of 14.7/s for 200 µM ADP and 9.7/s for 400 µM ADP, giving Kds = 82 ± 40 µM for 200 µM ADP and 44 ± 11 µM for 400 µM ADP.
Consider the following mechanism (Equation 2) in which the transition from strong (A–M) to weak binding (A + M–ATP) of acto-myosin follows ADP dissociation from acto-myosin complex and subsequent binding of ATP to myosin.

If we assume that k–4[ADP] is negligible at low ADP concentration relative to k+1 and that the dwell time reflects the time for transition from strong (A–M) to weak binding (A + M–ATP), this relationship can be described by one ATP-dependent (k+1) and one ATP-independent rate (k+4) as:
kmean = k+4 k+1 [ATP]/(k+4 + k+1[ATP])(3)
A fit by Equation 3 yields the rate constant, k+4 = 95 ± 4/s (±SD) (Figure 8A) and an apparent ATP-dependent second-order rate constant per mechanical step, k+1 = (0.6 ± 0.1) × 106/M/s (±SD), comparable with the ATP-binding rate in solution for myosin II, 2 × 10⁶/M/s (Oiwa et al., 2000) and 0.9 × 10⁶/M/s for myosin V (De La Cruz et al., 1999).
Although dwell time distributions at various ATP concentrations were approximately exponential, in accordance with the kinetic scheme in Equation 2, the double exponential shown below was used for fits to the dwell time distributions:
P(t) = λ1λ2/(λ2 – λ1) [exp(–λ1t) – exp(–λ2t)](4)
Since the temporal response of the system does not distinguish dwell time data shorter than 10 ms, these were all categorized into a histogram bin of dwell times <10 ms. In the absence of ADP, λ1 corresponds to k+4 and λ2 corresponds to k+1[ATP]. Solid curves in Figure 8B represent double exponential fits with one rate constant k+4 fixed to 95/s, yielding 1.0 ± 0.1, 4.5 ± 0.6 and 47 ± 28/s (±SEM) at 1, 10 and 100 µM ATP, respectively.
In the presence of 200 or 400 µM ADP as well as 100 µM ATP, the dwell time distributions shifted to longer times than in the absence of ADP (Figure 8C). In the double exponential fitting using Equation 3, the product of λ1 and λ2 provides the constraint of the rate constants since it is the product of k+1[ATP] and k+4, which was determined above. Fitting gave the constants of 15.3 ± 1.6 and 370 ± 40/s at 200 µM ADP, and rate constants of 9.9 ± 0.9 and 580 ± 51/s at 400 µM ADP. Although λ1 and λ2 are not simply expressed by the rate constants in Equation 2, the mean rate constant, kmean is expressed as:
kmean = λ1 λ2/(λ1 + λ2) = k+1[ATP]/(1 + [ADP]/Kd + k+1[ATP]/k+4)(5)
Using k+1 = 0.6/µM/s and k+4 = 95/s determined by the dwell time distributions at different ATP concentrations, Kd of ADP is calculated to be 82 ± 40 and 44 ± 11 µM for 200 and 400 µM ADP, respectively.
Discussion
Our biochemical studies of myosin XI have demonstrated its kinetic processivity and shown that its ATPase cycle has a high duty ratio. Structural studies have shown that this myosin has two heads with light chain-binding domains which are long enough, each containing six calmodulin binding IQ motifs, to be able to bind simultaneously to an actin filament spanning the 36 nm distance of the actin helical repeat. In combination with the results of in vitro assays and single-molecule mechanical studies, we conclude that this myosin XI moves processively along the 36 nm actin helical repeat and that this, the fastest known processive movement (∼7 µm/s), is attained by a combination of its high ATPase rate and long stride. From the available data, the hand-over-hand model seems to be applicable as postulated for myosin V (Rief et al., 2000; Walker et al., 2000; Mehta, 2001; Veigel et al., 2002).
Sliding velocities of single myosin molecules along an actin filament were calculated at various concentrations of ATP in order to compare them with the actin-activated ATPase rate (Figure 2A, green squares). The fit by the Michaelis–Menten equation (Figure 2A, green curve) gave a maximum sliding velocity, under low load (<0.3 pN) at saturating ATP concentration, of 7.7 ± 0.5 µm/s. The travel distance per ATPase cycle was thus determined to be 46–56 nm (7.7 ± 0.5 µm/s / 76.3 ± 2.5/s/head per two heads). From the gliding velocity of actin filaments over myosin-coated surfaces, the travel distance per ATPase cycle was determined to be 28–33 nm (4.6 ± 0.2 µm/s/76.3 ± 2.5/s/ head per two heads). These values span the range of direct step measurements, 35 nm, suggesting that this myosin could step one actin repeat for each ATPase cycle. The precise value of the step size 35.0 ± 4.3 nm is close to the value 34.8 ± 0.1 nm for myosin V observed by Ali et al. (2002); however, in our experiments, it was not possible to observe rotations about the actin filament.
According to Veigel et al. (2002), the average number of steps taken per diffusion encounter is calculated as a function of the duty ratio r, Pn = 1 + [ln2/–ln(2r – r2)], provided two heads bind simultaneously to actin and their biochemical cycles are independent and stochastic. The processivity number Pn calculated for this myosin XI is 22, which is smaller than the number obtained experimentally (mean run length/step size = 1.28 µm/35 nm = 37). This suggests that the mechanical and biochemical cycles of myosin XI are well coordinated to prevent it from diffusing away from an actin filament. Therefore, correlation between each step of the ATPase and mechanical stepping is crucial for understanding this processive movement.
The number of steps which this myosin XI made before detaching from actin filaments and returning to the baseline was almost the same over the range of ATP concentrations (1 µM–1 mM) studied. Together with the finding that maximal force was not dependent upon ATP concentration (Figure 5B), these results suggest that the load-dependent transition is not directly related to the ATP-binding step in the actomyosin ATPase cycle. In addition, the mean run length shows no significant changes at different ATP concentrations (Figure 6B), suggesting that one of the two heads almost always has nucleotide (ADP) bound during its mechanical cycle, forming a strongly bound complex with the actin filament.
Dwell time analysis suggests for a hand-over-hand model of processive movement like that of myosin V (De La Cruz et al., 1999; Rief et al., 2000; Walker et al., 2000; Veigel et al., 2002) that the dwell time was the sum of the times waiting for ATP to bind, rapid hydrolysis and Pi release, followed by product (ADP) release. The dwell time data (Figure 8A) yield a second-order chemomechanical rate constant of 0.6/µM/s for ATP binding, and for ADP release a first-order rate constant of 95/s.
The dwell time distributions in the presence of ADP yield mean rate constants of 14.7/s at 200 µM ADP and 9.7/s at 400 µM ADP. Kds were calculated to be 82 µM for 200 µM ADP and 44 µM for 400 µM ADP. The Kd estimated at 200 µM ADP is slightly higher than that obtained from in vitro assays. When kmean is comparable with k+1[ATP], the estimated Kd becomes sensitive to errors in kmean and k+1. Taking the robustness of Equation 5 against the errors of parameters into account, the discrepancy in the estimation of Kd is not so great such that almost all of the dwell time analysis results could be explained by the kinetic Equation 2. One possible explanation for this discrepancy could be the effects of mechanical strain. In in vitro motility assays, mechanical factors (Warshaw et al., 1991) may contribute to the reduction in velocity of actin filaments. Since the addition of ADP increases the probability that long-lived strong binding AM–ADP complexes exist, such acto-myosin complexes could impede actin filament movement. Even under our experimental conditions where actin filaments shorter than 1 µm moving on low-density myosin-coated surfaces were observed, the probability of such resistance could be still high (see also the Supplementary data). The effect of this resistance is an increase in apparent Km, leading to a decrease in Kd, hence the Kd determined from in vitro assays may be underestimated.
At a very low concentration of ATP (1 µM), the behavior of this myosin XI is different from that at higher concentrations of ATP as suggested from the dwell time histograms (Figure 8B). The double exponential according to Equations 2 and 3 does not fit the data well especially at short dwell times. Without the constraint of λ2 = k+4 = 95/s, the histogram is fitted well by a double exponential distribution with rate constants of similar values. This suggests that a kinetic scheme dealing with two heads would be necessary for explanation of the dwell times at low concentrations of ATP.
Finally, we can combine our findings with the hand-over-hand model postulated for myosin V (De La Cruz et al., 1999; Rief et al., 2000; Walker et al., 2000; Veigel et al., 2002) as follows: the leading head binds to an actin filament with ADP-Pi in its catalytic site, phosphate is released and then the head undergoes the working stroke, binding strongly to the actin filament. During this working stroke, the trailing head still binds to the actin filament with either ADP or no nucleotide in its active site. The intramolecular strain then increases along the direction of movement. (This feature is derived from the result that the mean run length is independent of ATP concentration.) After completion of the power stroke and ADP release, a new ATP molecule binds to the trailing head and subsequently the head detaches from the actin filament. The strain stored in the neck domain of the leading head swings the detached head forward. This head hydrolyzes ATP to ADP-Pi, rebinds to the actin filament while releasing Pi and then binds strongly to actin. This strain and the biased diffusion of the detached head and its subsequent rebinding constrain a myosin XI molecule to move in one direction, i.e. towards the barbed end of actin. At physiological concentrations of ATP, ADP release from the trailing head is the rate-limiting step of this mechanochemical cycle of myosin XI.
In order to conclude this scenario, however, biochemical evidence for ADP release being the rate-limiting step of myosin XI and identification of the rate-limiting mechanical transition at saturating ATP concentration are required. Moreover, since step size measurements were made in the high force range, load on the myosin and its dwell time should be correlated (Rief et al., 2000; Mehta, 2001). Therefore, detailed analysis of the relationship between dwell time and ATP concentration will require higher temporal resolution and force-clamp measurements as used in myosin V experiments (Rief et al., 2000; Mehta, 2001).
From the above results and discussion, we conclude that this plant myosin XI is highly specialized in order to produce the fastest known processive movement with a 35 nm step size but generates concomitantly low forces. According to the hydrodynamic analysis (Yoneda and Nagai, 1988), the motive force of cytoplasmic streaming per unit interface was 0.3–0.4 pN/µm2, which is comparable with our results given the assumption that a spherical organelle ∼1 µm in diameter is driven by a few myosin molecules. The work done for each ATP molecule hydrolyzed (free energy 100 zJ) is ∼35 nm × 0.58 pN = 20 zJ, a lower thermodynamic efficiency (20%) than for myosin V (>50%); this may be the energetic price for high velocity processivity. Its rate-limiting step under physiological conditions may be ADP release from myosin; however, additional work is required to elucidate further the relationships between structural and mechanical features of this myosin, including those between ATPase kinetics and fast processive motion.
Materials and methods
Protein preparation
Plant myosins were isolated from cultured tobacco bright yellow-2 cells of N.tabacum (BY-2 cell) basically according to the method of Yokota et al. (1999). Briefly, cells from 5-day-old cultures were used for the isolation of myosin. BY-2 cells suspended in solution containing 0.25 M sucrose, 1% (w/v) casein, 20 mM EGTA, 6 mM MgCl2, 100 µg/ml leupeptin, 0.5 mM phenylmethylsulfonyl fluoride (PMSF), 2 mM dithiothreitol (DTT) and 30 mM PIPES-KOH pH 7.0 were homogenized. After removal of debris by centrifugation, the supernatant was co-sedimented with 0.1 mg/ml rabbit skeletal muscle F-actin at 100 000 g for 30 min. The pellet was re-suspended in 20 ml of EMP solution containing 90 mM KCl, 5 mM EGTA, 6 mM MgCl2, 0.5 mM PMSF, 50 µg/ml leupeptin, 1 mM DTT and 30 mM PIPES-KOH pH 7.0, and kept for 30 min on ice. After a second centrifugation at 100 000 g for 30 min, the pellet was extracted with EMP solution containing 10 mM ATP and 5 mM potassium phosphate pH 7.0 for 10 min on ice. This ATP extract, following centrifugation at 100 000 g for 30 min, was applied directly to a hydroxylapatite column pre-equilibrated with EMP solution containing 5 mM potassium phosphate pH 7.0. The column was eluted stepwise with 5, 150 and 300 mM potassium phosphate in EMP solution. The fractions eluted with 5 mM potassium phosphate buffer were dialyzed against EMP solution with 5 mM KCl on ice for 10 h. This dialysate applied to a Mono Q HR5/5 anion exchange column (Amersham Biosciences, Uppsala, Sweden) was eluted with a gradient of 180–500 mM KCl in EMP solution. The fraction was incubated with F-actin (final concentration at 0.15 mg/ml) for 30 min on ice and centrifuged at 100 000 g for 30 min. The pellet was extracted with EMP solution containing 5 mM ATP and 1 mM DTT on ice for 10 min. The supernatant after centrifugation at 100 000 g for 30 min was used directly as isolated 175 kDa myosin XI in solution. For further purification, it was fractionated by HPLC with a Mono Q HR5/5 column (Amersham Biosciences) under linear gradient operation (180–500 mM KCl with the EMP buffer). To avoid dilution and overestimation of protein concentrations due to contamination, myosin concentrations were always determined using Bradford assays on SDS–polyacrylamide gels, with rabbit skeletal muscle HMM as the concentration standard.
Production of antibodies
We previously cloned and sequenced cDNA encoding 175 kDa myosin from N.tabacum (Yokota et al., 2001). The cDNA coding the C-terminal region of the protein (87 amino acid residues) was amplified by PCR using forward primer 5′-TAGAGATCTGCAACTTTACAGAA TCTGTA-3′ with a BglII site (underlined) and reverse primer 5′-CCTAAGCTTCACTCGTGTAAAAATTGGAA-3′ with a HindIII site (underlined). The PCR product was cloned into pQE41 vector (Qiagen, Valencia, CA) using the BglII and HindIII sites. A fusion protein of the C-terminal region of the protein with dihydrofolate reductase and a histidine tag was expressed in Escherichia coli strain XL1Blue (Stratagene, La Jolla, CA), and purified through an Ni-NTA resin column according to the manufacturer’s protocol (Qiagen). The protein was dialyzed against water, lyophilized, dissolved in phosphate-buffered saline and injected into Japanese white rabbits with Freund’s adjuvant. The antiserum was prepared according to the standard protocol.
Sequence analysis
GenBank was searched using the NCBI-BLASTA program. Alignment of nucleotide sequences and comparison were performed with the DiAlign program at EMBL. After multiple alignment, phylogenetic analysis was performed with the neighbor-joining method using the program in Clustal_X (Thompson et al., 1997). Bootstrap resampling (1000 trials) was used for estimation of the degree of confidence in the branching order. Predictions for coiled-coil structure were carried out using COILS version 2.2 (Lupas, 1996).
Electron microscopy
Mono Q column-purified 175 kDa myosin was adsorbed on a freshly cleaved mica surface, stabilized with buffered uranyl acetate and washed with glycerol-containing solution. The sample was then rotary replicated with platinum–carbon at a 6° elevation angle. Details of the method were described elsewhere (Mabuchi, 1991; Katayama and Ikebe, 1995).
Kinetic experiments
Steady-state actin-activated ATPase was measured at 20°C in solutions containing 25 mM KCl, 4 mM MgCl2, 1 mM EGTA, 1 mM DTT, 25 mM HEPES-KOH pH 7.5 and 0.4–48 µM F-actin with an enzyme-coupled assay (No. E-6646, Molecular Probes, Eugene, OR).
In vitro motility assays.
In vitro assays were performed at 20°C, basically as performed by Toyoshima et al. (1990), but with some modifications. A flow cell, volume 10 µl, was made from two nitrocellulose-coated coverslips (24 mm × 40 mm and 18 mm × 18 mm), with two slivers of polycarbonate film as spacers. A 10 µl aliquot of purified myosin (1–5 µg/ml) in buffer solution (25 mM KCl, 4 mM MgCl2, 1 mM EGTA, 1 mM DTT and 25 mM HEPES-KOH pH 7.5) was introduced into the flow cell and incubated for 10 min. After washing the flow cell with buffer solution containing 0.5 mg/ml bovine serum albumin (BSA), 10 µl of buffer solution containing 50 nM tetramethylrhodamine-labeled actin filaments, 1 mM DTT, an oxygen-scavenging system (25 µg/ml glucose oxidase, 45 µg/ml catalase and 1% glucose) and various concentrations of ATP (from 10 µM to 1 mM) was infused into the flow cell.
In order to measure velocities of actin filaments moving on myosin-coated surfaces, movement was recorded at 30 frames/s with an intensified CCD camera. Video tapes of the actin filament movement were played back off-line, and the positions of individual actin filaments were digitized frame by frame using an Argus-20 image processor (Hamamatsu Photonics, Hamamatsu). Velocities were calculated from the change in position as a function of time. To obtain reliable velocities, only actin filaments shorter than 1 µm that moved continuously over 5 µm were analyzed.
For the attachment rate assay, a custom-built total internal reflection fluorescence microscope (Oiwa et al., 2000) was used to enable precise scoring of landed filaments as those that had touched down and moved for >0.5 µm over 2 s at 20 µM ATP at constant actin concentration (5 µg/ml). The surface density of myosin molecules was calculated assuming that every myosin molecule infused into the flow cell evenly attached to the flow cell surface without losing its activity.
Optical trap nanometry
Polystyrene carboxylated beads 1 µm in diameter were incubated on ice in assay buffer (25 mM KCl, 4 mM MgSO4, 1 mM EGTA, 25 mM HEPES-KOH pH 7.5) for 10 h with varying concentrations of anti-C-terminal peptide antibody. Coated beads were added to myosin solutions and then applied to actin filaments fixed onto a coverslip via avidin–biotin interaction. The experimental set-up for the optical trap (Nd:YAG laser power 500 mW at 1064 nm, Spectra Physics) was the same as used previously (Kojima et al., 1997; Sakakibara et al., 1999). Displacement of the bead was measured using a quadrant photodiode system with 0.1 nm spatial (noise-equivalent value) and 0.02 ms temporal resolution. Trap stiffness (4.6 fN/nm) and bead–myosin linkage stiffness (21–140 fN/nm) were determined from variances of the Brownian fluctuations of beads. An attenuation factor, the ratio of the sum of bead–myosin linkage stiffness and trap stiffness to bead–myosin linkage stiffness, was 1.03–1.22. Displacement of beads within the trap was used in this study without conversion to displacement of myosin. Observations were made at 20°C in the same buffer as used for in vitro motility.
Accession number
Sequence data for 175 kDa myosin XI are available from DDBJ/EMBL/GenBank with accession No. AB082121.
Supplementary data
Supplementary data are available at The EMBO Journal Online.
Acknowledgments
Acknowledgements
We thank Dr Bernhard Brenner for discussion and critical comments on the manuscript. This work was partly supported by a Grant-in-Aid from the Ministry of Education, Science and Culture of Japan (K.O.).
References
- Ali M.Y., Uemura,S., Adachi,K., Itoh,H., Kinosita,K.,Jr and Ishiwata,S. (2002) Myosin V is a left-handed spiral motor on the right-handed actin helix. Nature Struct. Biol., 9, 464–467. [DOI] [PubMed] [Google Scholar]
- Anson M. (1992) Temperature dependence and Arrhenius activation energy of F-actin velocity generated in vitro by skeletal myosin. J. Mol. Biol., 224, 1029–1038. [DOI] [PubMed] [Google Scholar]
- Block S.M., Goldstein,L.S. and Schnapp,B.J. (1990) Bead movement by single kinesin molecules studied with optical tweezers. Nature, 348, 348–352. [DOI] [PubMed] [Google Scholar]
- De La Cruz E.M., Wells,A.L., Rosenfeld,S.S., Ostap,E.M. and Sweeney,H.L. (1999) The kinetic mechanism of myosin V. Proc. Natl Acad. Sci. USA, 96, 13726–13731. [DOI] [PMC free article] [PubMed] [Google Scholar]
- Espreafico E.M., Cheney,R.E., Matteoli,M., Nascimento,A.A., De Camilli,P.V., Larson,R.E. and Mooseker,M.S. (1992) Primary structure and cellular localization of chicken brain myosin-V (p190), an unconventional myosin with calmodulin light chains. J. Cell Biol., 119, 1541–1557. [DOI] [PMC free article] [PubMed] [Google Scholar]
- Finer J.T., Simmons,R.M. and Spudich,J.A. (1994) Single myosin molecule mechanics: piconewton forces and nanometre steps. Nature, 368, 113–119. [DOI] [PubMed] [Google Scholar]
- Guilford W.H., Dupuis,D.E., Kennedy,G., Wu,J., Patlak,J.B. and Warshaw,D.M. (1997) Smooth muscle and skeletal muscle myosins produce similar unitary forces and displacements in the laser trap. Biophys. J., 72, 1006–1021. [DOI] [PMC free article] [PubMed] [Google Scholar]
- Hackney D.D. (1995) Highly processive microtubule-stimulated ATP hydrolysis by dimeric kinesin head domains. Nature, 377, 448–450. [DOI] [PubMed] [Google Scholar]
- Hancock W.O. and Howard,J. (1998) Processivity of the motor protein kinesin requires two heads. J. Cell Biol., 140, 1395–1405. [DOI] [PMC free article] [PubMed] [Google Scholar]
- Higashi-Fujime S. and Sumiyoshi,H. (2001) Molecular sliding mechanism of the fastest Chara myosin from green algae. Curr. Top. Biochem. Res., 4, 61–70. [DOI] [PubMed] [Google Scholar]
- Higashi-Fujime S., Ishikawa,R., Iwasawa,H., Kagami,O., Kurimoto,E., Kohama,K. and Hozumi,T. (1995) The fastest actin-based motor protein from the green algae, Chara and its distinct mode of interaction with actin. FEBS Lett., 375, 151–154. [DOI] [PubMed] [Google Scholar]
- Homsher E., Wang,F. and Sellers,J.R. (1992) Factors affecting movement of F-actin filaments propelled by skeletal muscle heavy meromyosin. Am. J. Physiol., 262, C714–C723. [DOI] [PubMed] [Google Scholar]
- Kamiya N. (1981) Physical and chemical basis of cytoplasmic streaming. Annu. Rev. Plant Physiol., 32, 205–236. [Google Scholar]
- Kashiyama T., Kimura,N., Mimura,T. and Yamamoto,K. (2000) Cloning and characterization of a myosin from characean alga, the fastest motor protein in the world. J. Biochem., 127, 1065–1070. [DOI] [PubMed] [Google Scholar]
- Katayama E. and Ikebe,M. (1995) Mode of caldesmon binding to smooth muscle thin filament: possible projection of the amino-terminal of caldesmon from native thin filament. Biophys. J., 68, 2419–2428. [DOI] [PMC free article] [PubMed] [Google Scholar]
- Kimura Y., Toyoshima,N., Hirakawa,N., Okamoto,K., Ishijima,A. and Higashi-Fujime,S. (2002) Mechanical properties of Chara myosin. Biophys. J., 82, 411a. [Google Scholar]
- Kinkema M. and Schiefelbein,J. (1994) A myosin from a higher plant has structural similarities to class V myosins. J. Mol. Biol., 239, 591–597. [DOI] [PubMed] [Google Scholar]
- Kinkema M., Wang,H. and Schiefelbein,J. (1994) Molecular analysis of the myosin gene family in Arabidopsis thaliana. Plant Mol. Biol., 26, 1139–1153. [DOI] [PubMed] [Google Scholar]
- Kojima H., Muto,E., Higuchi,H. and Yanagida,T. (1997) Mechanics of single kinesin molecules measured by optical trapping nanometry. Biophys. J., 73, 2012–2022. [DOI] [PMC free article] [PubMed] [Google Scholar]
- Kron S.J., Toyoshima,Y.Y., Uyeda,T.Q.P. and Spudich,J.A. (1991) Assays for actin sliding movement over myosin-coated surfaces. Methods Enzymol., 196, 399–416. [DOI] [PubMed] [Google Scholar]
- Leibler S. and Huse,D.A. (1993) Porters versus rowers: a unified stochastic model of motor proteins. J. Cell Biol., 121, 1357–1368. [DOI] [PMC free article] [PubMed] [Google Scholar]
- Lupas A. (1996) Prediction and analysis of coiled-coil structures. Methods Enzymol., 266, 513–525. [DOI] [PubMed] [Google Scholar]
- Mabuchi K. (1991) Heavy-meromyosin-decorated actin filaments: a simple method to preserve actin filaments for rotary shadowing. J. Struct. Biol., 107, 22–28. [DOI] [PubMed] [Google Scholar]
- Mehta A. (2001) Myosin learns to walk. J. Cell Sci., 114, 1981–1998. [DOI] [PubMed] [Google Scholar]
- Morimatsu M., Nakamura,A., Sumiyoshi,H., Sakaba,N., Taniguchi,H., Kohama,K. and Higashi-Fujime,S. (2000) The molecular structure of the fastest myosin from green algae, Chara. Biochem. Biophys. Res. Commun., 270, 147–152. [DOI] [PubMed] [Google Scholar]
- Nishikawa S. et al. (2002) Class VI myosin moves processively along actin filaments backward with large steps. Biochem. Biophys. Res. Commun., 290, 311–317. [DOI] [PubMed] [Google Scholar]
- Oiwa K. et al. (2000) Comparative single-molecule and ensemble myosin enzymology: sulfoindocyanine ATP and ADP derivatives. Biophys. J., 78, 3048–3071. [DOI] [PMC free article] [PubMed] [Google Scholar]
- Reddy A.S. (2001) Molecular motors and their functions in plants. Int. Rev. Cytol., 204, 97–178. [DOI] [PubMed] [Google Scholar]
- Rief M., Rock,R.S., Mehta,A.D., Mooseker,M.S., Cheney,R.E. and Spudich,J.A. (2000) Myosin-V stepping kinetics: a molecular model for processivity. Proc. Natl Acad. Sci. USA, 97, 9482–9486. [DOI] [PMC free article] [PubMed] [Google Scholar]
- Rock R.S., Rice,S.E., Wells,A.L., Purcell,T.J., Spudich,J.A. and Sweeney,H.L. (2001) Myosin VI is a processive motor with a large step size. Proc. Natl Acad. Sci. USA, 98, 13655–13659. [DOI] [PMC free article] [PubMed] [Google Scholar]
- Sakakibara H., Kojima,H., Sakai,Y., Katayama,E. and Oiwa,K. (1999) Inner-arm dynein c of Chlamydomonas flagella is a single-headed processive motor. Nature, 400, 586–590. [DOI] [PubMed] [Google Scholar]
- Sakamoto T., Amitani,I., Yokota,E. and Ando,T. (2000) Direct observation of processive movement by individual myosin V molecules. Biochem. Biophys. Res. Commun., 272, 586–590. [DOI] [PubMed] [Google Scholar]
- Shimmen T. and Yokota,E. (1994) Physiological and biochemical aspects of cytoplasmic streaming. Int. Rev. Cytol., 155, 97–139. [Google Scholar]
- Svoboda K., Schmidt,C.F., Schnapp,B.J. and Block,S.M. (1993) Direct observation of kinesin stepping by optical trapping interferometry. Nature, 365, 721–727. [DOI] [PubMed] [Google Scholar]
- Thompson J.D., Gibson,T.J., Plewniak,F., Jeanmougin,F. and Higgins,D.G. (1997) The CLUSTAL_X windows interface: flexible strategies for multiple sequence alignment aided by quality analysis tools. Nucleic Acids Res., 25, 4876–4882. [DOI] [PMC free article] [PubMed] [Google Scholar]
- Toyoshima Y.Y., Kron,S.J. and Spudich,J.A. (1990) The myosin step size: measurement of the unit displacement per ATP hydrolyzed in an in vitro assay. Proc. Natl Acad. Sci. USA, 87, 7130–7134. [DOI] [PMC free article] [PubMed] [Google Scholar]
- Trybus K.M., Krementsova,E. and Freyzon,Y. (1999) Kinetic characterization of a monomeric unconventional myosin V construct. J. Biol. Chem., 274, 27448–27456. [DOI] [PubMed] [Google Scholar]
- Veigel C., Wang,F. Bartoo,M.L., Sellers,J.R. and Molloy,J.E. (2002) The gated gait of the processive molecular motor, myosin V. Nature Cell Biol., 4, 59–65. [DOI] [PubMed] [Google Scholar]
- Walker M.L., Burgess,S.A., Sellers,J.R., Wang,F., Hammer,J.A.,III, Trinick,J. and Knight,P.J. (2000) Two-headed binding of a processive myosin to F-actin. Nature, 405, 804–807. [DOI] [PubMed] [Google Scholar]
- Warshaw D.M., Desrosiers,J.M., Work,S.S. and Trybus,K.M. (1991) Effects of MgATP, MgADP, and Pi on actin movement by smooth muscle myosin. J. Biol. Chem., 266, 24339–24343. [PubMed] [Google Scholar]
- Wells A.L., Lin,A.W., Chen,L.Q., Safer,D., Cain,S.M., Hasson,T., Carragher,B.O., Milligan,R.A. and Sweeney,H.L. (1999) Myosin VI is an actin-based motor that moves backwards. Nature, 401, 505–508. [DOI] [PubMed] [Google Scholar]
- Yamamoto K., Kikuyama,M., Sutoh-Yamamoto,N. and Kamitsubo,E. (1994) Purification of actin-based motor protein from Chara corallina. Proc. Jap. Acad., 70, 175–180. [Google Scholar]
- Yamamoto K., Kikuyama,M., Sutoh-Yamamoto,N., Kamitsubo,E. and Katayama,E. (1995) Myosin from alga Chara: unique structure revealed by electron microscopy. J. Mol. Biol., 254, 109–112. [DOI] [PubMed] [Google Scholar]
- Yokota E. and Shimmen,T. (1994) Isolation and characterization of plant myosin from pollen tubes of lily. Protoplasma, 177, 153–162. [Google Scholar]
- Yokota E., Yukawa,C., Muto,S., Sonobe,S. and Shimmen,T. (1999) Biochemical and immunocytochemical characterization of two types of myosins in cultured tobacco bright yellow-2 cells. Plant Physiol., 121, 525–534. [DOI] [PMC free article] [PubMed] [Google Scholar]
- Yokota E., Sonobe,S., Orii,H., Yuasa,T., Inada,S. and Shimmen,T. (2001) The type and the localization of 175-kDa myosin in tobacco cultured cells BY-2. J. Plant Res., 114, 115–116. [Google Scholar]
- Yoneda M. and Nagai,R. (1988) Structural basis of cytoplasmic streaming in Characean internodal cells. A hydrodynamic analysis. Protoplasma, 147, 64–76. [Google Scholar]