

Abstract
Prior experience indicated that use of higher doses of cytarabine during induction for acute myeloid leukemia (AML) with a histone deacetylase inhibitor resulted in high response rates. S1203 was a randomized multicenter trial for previously untreated patients aged 18–60 with AML which compared daunorubicin and cytarabine (DA), idarubicin with higher dose cytarabine (IA) and IA with vorinostat (IA+V). The primary endpoint was event free survival (EFS).
738 patients were randomized: 261 to each DA and IA arms and 216 to the IA+V arm. 96, 456, and 150 patients had favorable-, intermediate-, and unfavorable-risk cytogenetics, respectively. 152 were NPM1 and 158 FLT3 mutated. The overall remission rate was 77.5% including 62.5% CR and 15.0% CRi. No differences in remission, EFS, or overall survival were observed among the 3 arms except for the favorable cytogenetics subset who had improved outcomes with DA and postremission high dose cytarabine. A trend towards increased toxicity was observed with the IA and IA+V arms.
The use of higher dose cytarabine during induction therapy in younger patients with AML, with or without vorinostat, does not result in improved outcomes. (Funded by the US National Institutes of Health and others, ClinicalTrials.gov number, NCT01802333.)
INTRODUCTION
Acute myeloid leukemia (AML) is the result of proliferation of myeloid precursors with impaired ability for normal differentiation leading to peripheral blood cytopenias and increased risk of infection and hemorrhage.1 AML is characterized by multiple recurrent cytogenetic and molecular changes that are associated with response to therapy and overall prognosis.2,3 This genetic information, together with patient characteristics such as age, performance status, organ function, and comorbidities, is used to determine type of therapy and potential role of allogeneic stem cell transplantation (alloSCT).3,4
In North America, the most commonly used AML therapy is modeled after a Cancer and Leukemia Group B trial consisting of a “7+3” induction with cytarabine and an anthracycline followed by several cycles of high dose cytarabine consolidation.5 Younger patients benefited from the use of higher doses of anthracycline for 3 days with continuous infusion cytarabine. This treatment is associated with complete response (CR) rates of 70% and a median survival of 24 months.6 These results are still suboptimal as a majority of patients will relapse and die from their disease.
There has been a debate whether higher doses of cytarabine are beneficial or not during the induction phase in AML. An example of such an approach is idarubicin and high dose cytarabine (IA), which was associated with high response rates in a single institution report.7
In addition to “7+3” or IA types of therapy, multiple clinical trials have studied the potential of adding a third agent to such combinations. Examples in the era of genomic annotation include successful addition of a FLT3 inhibitor to 7+3 or the use of a nucleoside analogue in combination with cytarabine and an anthracycline.8,9 Vorinostat is a histone deacetylase (HDAC) inhibitor that has been shown to have single agent antileukemia activity and to synergize with both hypomethylating agents and in a sequence specific fashion with anthracyclines.10–12 A phase II trial performed at a single institution combining IA with vorinostat (IA+V) reported a high response rate in a cohort of patients with poor-risk characteristics.7 Of importance, patients with core binding factor abnormalities (CBFs) were excluded from these trials;since re-approval of gemtuzumab ozogamicin (GO) in 2017 induction with 7+3+GO combination has been recommended for these patients.3
In view of this significant activity of IA+V, a multicenter randomized phase 3 clinical trial was designed to compare standard “7+3” with IA, with or without vorinostat, for younger patients with AML. SWOG 1203 was thus designed to answer two important questions: whether a higher dose of cytarabine improves outcomes when compared to standard dose as administered in 7+3 and whether the addition of vorinostat improves outcomes when compared to IA. An additional goal of this trial was to study the success rate of transplanting high-risk patients in first complete remission in the context of a large randomized clinical trial. These results were reported in a separate manuscript.13
METHODS
SWOG S1203 was an US National Cancer Institute (NCI) study led by SWOG, with accrual from sites throughout the National Clinical Trials Network (NCI NCTN). The study was registered in ClinicalTrials.gov as NCT01802333 and was approved at all participating centers following institutional guidelines. The protocol may be found in the Supplementary Information.
Cytogenetic analysis was performed by local laboratories used by participating institutions. Cytogenetic risk stratification was based on updated SWOG criteria.14–17 Favorable-risk cytogenetics includes the presence of clonal abnormality of t(8;21) or inv(16)/t(16;16). High-risk cytogenetics was defined as those with clonal aberrations of abn3q26 [inv(3)/t(3;3)], del(5q)/−5, del(7q)/−7, 11q23 rearrangement [except t(9;11)], del(17p), t(6;9), t(9;22) complex (at least 3 unrelated abnormalities), and monosomal karyotype (either loss of 2 different chromosomes or loss of 1 chromosome together with a structural chromosome abnormality other than add, ring, and mar). Intermediate-risk cytogenetics includes all results from an informative study without any of the favorable- or high-risk clonal aberrations. Patients without an informative study, either failed karyotype analysis due to non-proliferation/no metaphase available or limited study with a normal karyotype based on fewer than 20 metaphases analyzed, are categorized as “unknown cytogenetics”.
Eligibility
Patients between 18 and 60 years old with AML by World Health Organization 2008 criteria and evidence of marrow involvement were eligible. Patients with acute promyelocytic leukemia (APL) or blastic phase of chronic myeloid leukemia were excluded. Patients could not have received therapy for AML or myelodysplastic syndromes. Other inclusion criteria included Zubrod performance status 3 or lower, evidence of cardiac ejection fraction of more than 44%, and no evidence of QTc prolongation (more than 500 msec). Patients with severe comorbidities were not eligible but patients with HIV, hepatitis B or C infection were allowed under specific conditions (see protocol in the Supplementary Information). Pregnant patients were not eligible and effective contraceptive methods were required.
Treatment
A detailed treatment schema is provided in the protocol document (Section 7 of the protocol in the Supplementary Information). In summary, therapy was divided into an induction phase followed by a consolidation phase. Treatment schemas during induction and consolidation are shown in the protocol document. The 7+3 arm used daunorubicin at 90 mg/m2 with infusional cytarabine 100 mg/m2 per day (DA). Because of potential shortages, daunorubicin could be replaced by idarubicin 12 mg/m2/day when needed. In the IA arms, idarubicin was used at a dose of 12 mg/m2 IV daily × 3 days and cytarabine at a dose of 1500 mg/m2 IV daily as a 24-hour continuous infusion for 4 days. In the IA+V arm, vorinostat was used at a dose of 500 mg orally three times a day for 3 days on days 1 to 3 and IA started on day 4. For the 4 cycles of consolidation, in the DA arm cytarabine was used at a dose of 3000 mg/m2 IV over 3 hours twice a day on days 1, 3, and 5. In the IA and IA+V arms consolidation consisted of cytarabine 750 mg/m2 IV daily × 3 and idarubicin at 8 mg/m2 on days 1 and 2. Vorinostat was used at the same dose as during induction. Toxicities were assessed according to the Commmon Terminology Criteria for Adverse Events version 4.0 and therapy was dose adjusted following protocol guidelines.
Study calendar
Follow up during the study is detailed in the protocol document (Supplementary Information). Patients were required to have a bone marrow evaluation with cytogenetics within 28 days prior to registration. Assessment of cardiac ejection fraction was also required prior to study entry. In addition, physical examination, laboratory assessments and buccal swabs for stem cell donor search were required. Laboratory assessments were serially obtained during induction. Bone marrow was obtained for disease assessment at the end of induction prior to consolidation. Patients that did not achieve remission with the first cycle of induction were allowed to receive a modified cycle of re-induction. Patients with higher-risk cytogenetics and in remission were then assessed for alloSCT. An echocardiogram and electrocardiogram were also obtained at the end of induction. Patients were treated with all supportive care measures as needed including transfusions of blood products, use of prophylactic antibiotics and treatment of any complications such as neutropenic fever using local institutional guidelines.
Study design and statistical methods
The primary objective of the study was to compare event-free survival (EFS) in patients with AML that received DA versus IA or IA+V. A second primary objective was to determine the fraction of high-risk patients receiving alloSCT in first remission. Secondary objectives were to compare toxicities, disease-free survival (DFS), and overall survival among the three arms. Morphologic response (including complete remission [CR] and CR with incomplete hematologic recovery [CRi, ANC < 1 000/mcl or platelets < 100 000/mcl]) definitions followed the contemporary consensus review definitions.18 EFS was defined for all patients and was measured from the date of randomization to the first of the following events: death from any cause, relapse from remission (CR or CRi), or completion of protocol induction/re-induction therapy without documentation of CR or CRi; patients last known to be alive in CR or CRi were censored at the date of last contact. DFS was defined for patients who achieved CR or CRi with protocol induction/re-induction and was measured from date of CR or CRi to the first day of relapse from CR or CRi or death from any cause; patients last known to be alive in CR or CRi were censored at the date of last contact. Overall survival was defined for all patients and was measured from the date of randomization to the date of death due to any cause; patients last known to be alive were censored at the date of last contact.
The full details of the statistical design are provided in Section 11 of the protocol document. The design specified 1:1:1 randomization between the three arms and specified up to 5 interim analyses. Fisher’s exact test and the Wilcoxon-rank sum test were used to assess differences in categorical and quantitative variables across the arms. EFS, DFS, and OS were estimate using the Kaplan-Meier method. Cox models were used for multivariable regression modeling of EFS, DFS, and OS.
RESULTS
Study Population
Between April 2013 and November 2015, 754 patients were registered to the study. Accrual to IA+V was stopped on June 1, 2015 due to IA+V crossing a futility threshold at the second interim analysis. The study completed accrual to the DA and IA arms in November 2015. The IA arm crossed a futility threshold at the fourth interim analysis and the trial was closed to further accrual. The results of the study were released in spring of 2016. Sixteen patients were found to be ineligible, therefore a total 738 eligible patients are summarized in the following analyses. A consort diagram is shown in Figure 1. 261 eligible patients were registered on the DA and IA arms respectively and 216 on the IA+V arm. Patient characteristics are shown in Table 1. Median age was 49 years (min 18, max 60) and 49% of the patients were female. Median white blood cell count (WBC) was 10.8 (x 109/L) (min 0.3, max 800). 96 patients (13%) had favorable-, 457 (63%) intermediate- and 159 (22%) high-risk cytogenetics. FLT3-ITD mutation was present in 120 (16%) patients and NPM1 mutation was present in 152 (21%). There were no statistically significant differences in terms of patient characteristics distribution among the different treatment arms (Table 1).
Figure 1.
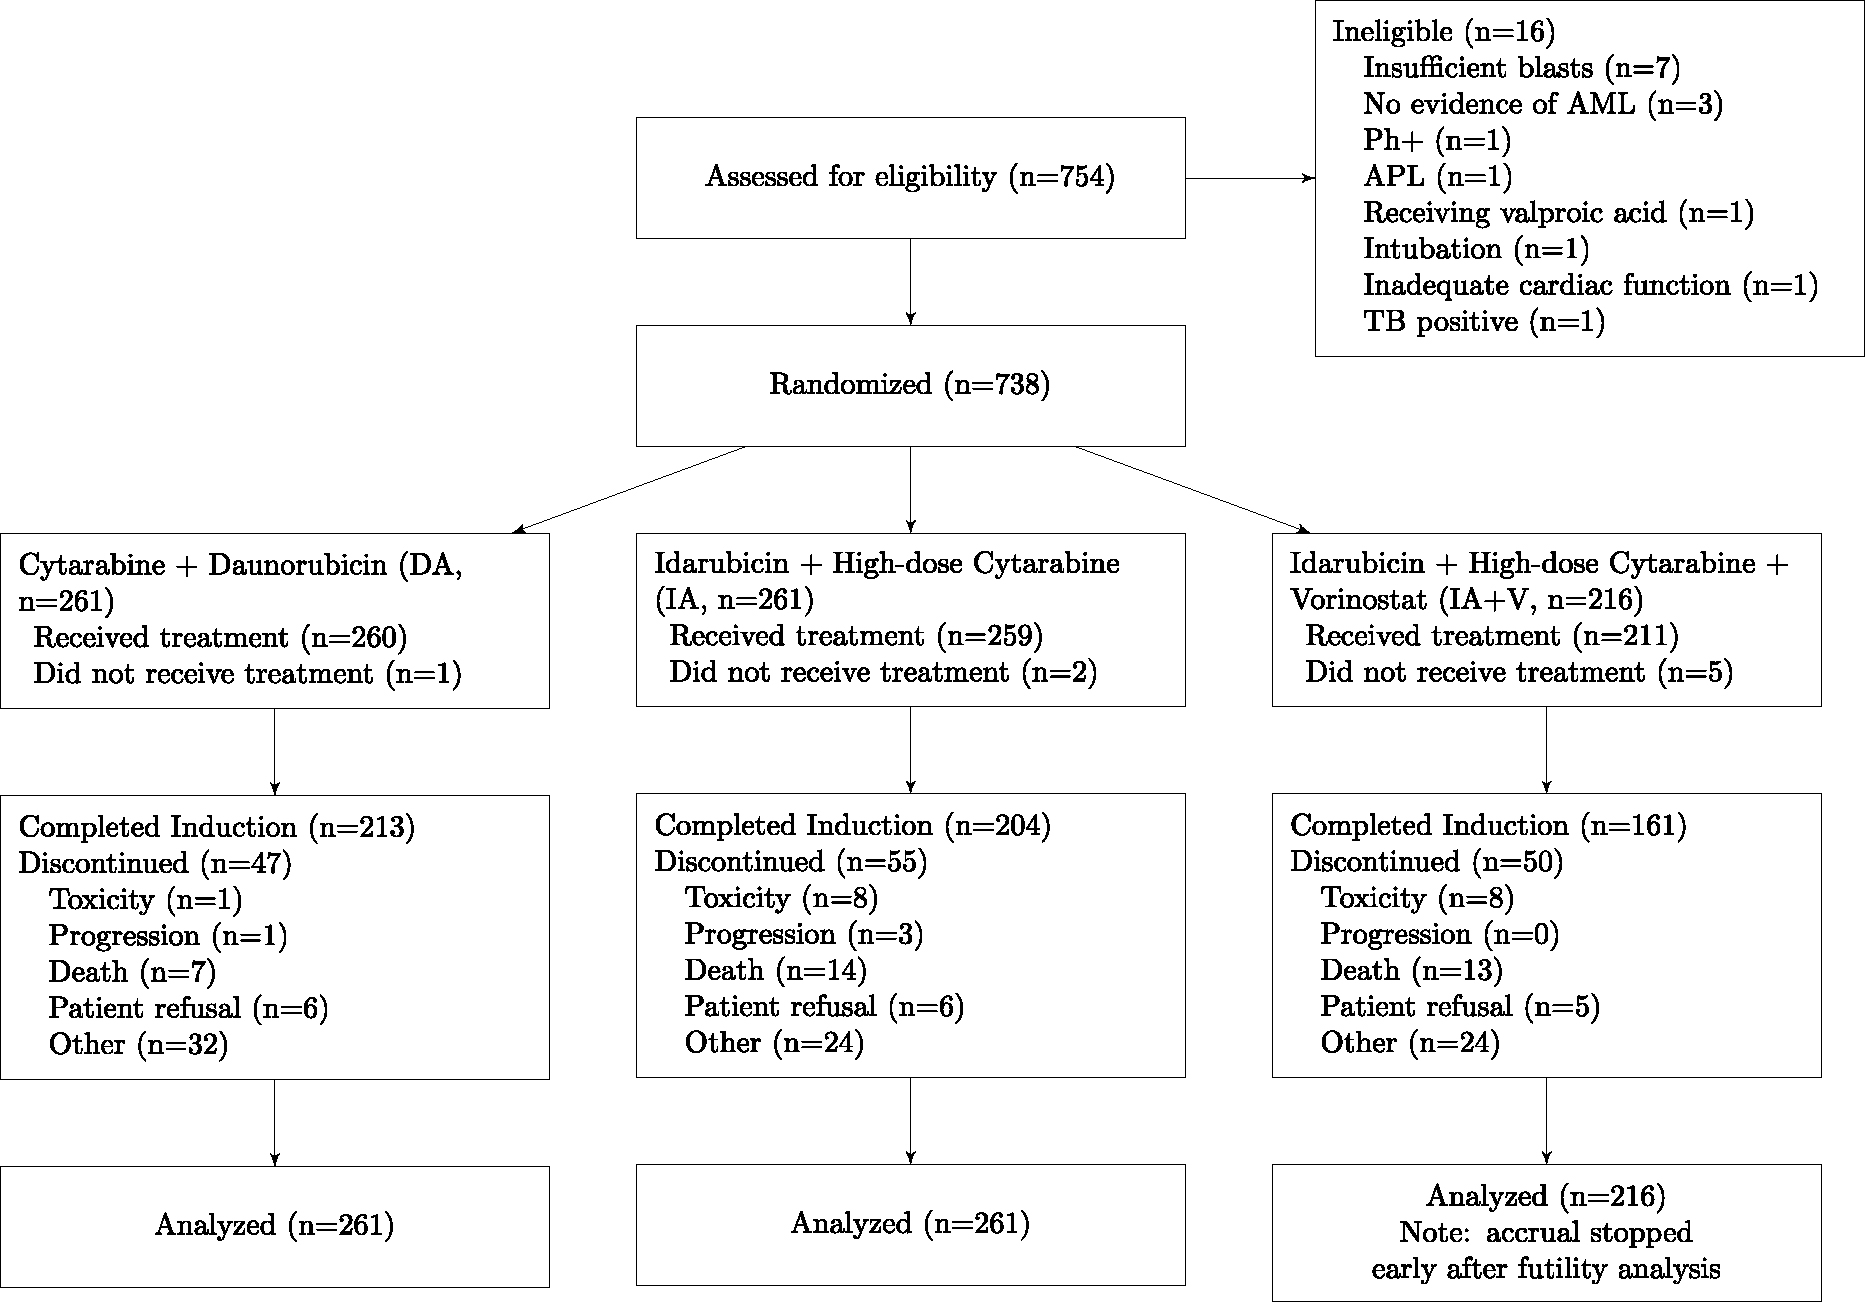
Consort diagram
AML - acute myeloid leukemia; APL - acute promyelocytic leukemia; TB - tuberculosis
Table 1.
Patient summary by treatment arm. Median (range) and N (%) reported.
| Factor | All | DA (N = 261) | IA (N = 261) | IA+V (N = 216) | P-value |
|---|---|---|---|---|---|
|
| |||||
| Age (years) | 49 (18,60) | 48 (19, 60) | 51 (18, 60) | 48 (19, 60) | 0.39 |
| White | 613 (83) | 218 (84) | 217 (83) | 178 (82) | 0.47 |
| Black | 55 (7) | 19 (7) | 19 (7) | 17 (8) | |
| Asian | 17 (2) | 6 (2) | 4 (2) | 7 (3) | |
| Native American | 6 (1) | 3 (1) | 0 (0) | 3 (1) | |
| Pacific Islander | 3 (0) | 2 (1) | 1 (0) | 0 (0) | |
| Unknown race | 39 (5) | 10 (4) | 18 (7) | 11 (5) | |
| More than one race | 5 (1) | 3 (1) | 2 (1) | 0 (0) | |
| Hispanic | 62 (8) | 19 (7) | 22 (8) | 21 (10) | 0,64 |
| Not hispanic | 676 (92) | 242 (93) | 239 (92) | 195 (90) | |
| Female | 360 (49) | 131 (50) | 127 (49) | 102 (47) | 0.81 |
| Male | 378 (51) | 130 (50) | 134 (51) | 114 (53) | |
| PS 0–1 | 643 (87) | 221 (85) | 233 (90) | 189 (88) | 0.25 |
| PS 2–3 | 94 (13) | 40 (15) | 27 (10) | 27 (12) | |
| WBC (109/L) | 10.8 (0.3,800) | 13 (1, 800) | 11 (0, 223) | 9 (0, 600) | 0.19 |
| Platelets (109/L) | 49 (3,9300) | 50 (4, 8500) | 47 (7, 9300) | 49 (3, 374) | 0.57 |
| Marrow blasts (%) | 60 (0,100) | 60 (0, 100) | 64 (0, 100) | 57 (0, 98) | 0.16 |
| Blood blasts (%) | 26 (0,100) | 24 (0, 99) | 27 (0, 100) | 26 (0, 95) | 0.88 |
| Hemoglobin (g/dL) | 8.5 (3.8,76) | 8 (4, 76) | 8 (5, 72) | 9 (4, 33) | 0.39 |
| Favorable cyto | 96 (13) | 28 (11) | 30 (12) | 38 (18) | 0.21 |
| Intermediate cyto | 457 (63) | 164 (64) | 159 (63) | 134 (64) | |
| Unfavorable cyto | 159 (22) | 60 (23) | 61 (24) | 38 (18) | |
| Unknown cyto | 8 (1) | 4 (2) | 3 (1) | 1 (0) | |
| FLT3--ITD | 120 (16) | 49 (19) | 38 (15) | 33 (15) | 0.72 |
| FLT3-TKD | 38 (5) | 14 (5) | 16 (6) | 8 (4) | |
| FLT3-WT | 357 (48) | 124 (48) | 124 (48) | 109 (50) | |
| FLT3 unknown | 223 (30) | 74 (28) | 83 (32) | 66 (31) | |
| NPM1 mutation | 152 (21) | 57 (22) | 52 (20) | 43 (20) | 0.63 |
| NPM1-WT | 315 (43) | 112 (43) | 104 (40) | 99 (46) | |
| NPM1 uknown | 271 (37) | 92 (35) | 105 (40) | 74 (34) | |
| CEBPA single mutation | 17 (2) | 7 (3) | 5 (2) | 5 (2) | 0.088 |
| CEBPA double mutation | 20 (3) | 10 (4) | 7 (3) | 3 (1) | |
| CEBPA-WT | 276 (37) | 92 (35) | 86 (33) | 98 (45) | |
| CEBPA unknown | 425 (58) | 152 (58) | 163 (62) | 110 (51) | |
PS: performance status
WBC: white blood cell count
ITD: internal tandem duplication
TKD: tyrosine kinase domain mutation
WT: wild-type
Toxicities
The overall mortality rates at days 30 and 60 for the whole study population were 4% and 7%, respectively. With DA, day 30 and 60 mortalities were 3% and 5%, respectively, whereas with IA were 6% and 9% and with IA+V were 4% and 9%. There was no significant difference in 30- and 60-day mortality between 3 arms (p=0.15 and 0.08 respectively, Supplemental Table S1). The IA+V arm had higher rates of grade 3 diarrhea compared to the other two arms (6% on DA, 8% on IA, 18% on IA+V, p<0.001) and higher rates of grade 3 typhlitis (3% on DA, 5% on IA, 10% on IA+V, p=0.002). Grade 4 and 5 GI toxicities rates were low; one patient on the DA arm had a grade 5 typhlitis and 1 patient on the IA+V arm had grade 4 diarrhea and another patient on the IA+V arm had grade 4 typhlitis. Grade 4 and 5 sepsis rates were higher on the IA and IA+V arms compared to DA (grade 4 rates: 6% on DA, 7% on IA, 13% in IA+V (p=0.002); grade 5 rates: 0% on DA, 3% on IA, 3% on IA+V, p=0.03; p-value for grade 4+5=0.005). Other toxicities were similar across the arms. The study did not collect data on time to hematopoietic recovery, but among patients who achieved a CR or CRi on the first induction cycle, the time to starting consolidation from the day of CR/CRi was longer on the DA arm compared to the IA and IA+V arms (median 18 days on DA, 12 days on IA, 13 days on IA+V, p<0.001).
Response
Results are shown in Table 3. There were no differences in response rates between any of the arms. CR was documented in 461 patients (62%) and CRi in additional 111 patients (15%) for an overall response rate (ORR) of 78%. The median time to response (25%, 75% of patients) in the DA, IA, and IA+V arms was 27 (14, 35), 32 (27, 35), 31 (28, 37) days, respectively (p<0.001). There were no differences in response in subsets defined by cytogenetic risk, FLT3-ITD, NPM1 mutations, and age (18–39 and 40–60) (all p>0.23).
Table 3.
Response summary by arm. N (%) reported.
| Subgroup | DA | IA | IA+V | P-value |
|---|---|---|---|---|
|
| ||||
| Full cohurt, CR | 161 (63) | 167 (64) | 130 (60) | 0.55 |
| Full cohort. CRi | 33 (13) | 41 (16) | 37 (17) | |
| Full cohort. failure | 64 (25) | 53 (20) | 49 (23) | |
| Favorable cytogenetic risk | ||||
| CR | 22 (79) | 25 (83) | 28 (74) | 0.25 |
| CRi | 5 (18) | 1 (3) | 4 (11) | |
| Failure | 1 (4) | 4 (13) | 6 (16) | |
| Intermediate cytogenetic risk | ||||
| CR | 109 (66) | 112 (70) | 80 (60) | 0.23 |
| CRi | 19 (12) | 22 (14) | 24 (18) | |
| Failure | 36 (22) | 26 (16) | 30 (22) | |
| Unfavorable cytogenetic risk | ||||
| CR | 30 (50) | 24 (39) | 20 (53) | 0.26 |
| CRI | 8 (18) | 16 (20) | 9 (24) | |
| Failure | 22 (37) | 21 (34) | 9 (24) | |
| FLT3-ITD | ||||
| CR | 32 (63) | 26 (66) | 19 (58) | 0.79 |
| CRi | 7 (14) | 4 (11) | 7 (21) | |
| Failure | 10 (20) | 9 (24) | 7 (21) | |
| FLT3 wild-type | ||||
| CR | 76 (61) | 79 (64) | 63 (58) | 0 33 |
| CRi | 16 (13) | 23 (19) | 23 (21) | |
| Failure | 32 (26) | 22 (16) | 23 (21) | |
| NPM1 mutated | ||||
| CR | 39 (66) | 40 (77) | 28 (65) | 0.62 |
| CRi | 8 (14) | 7 (13) | 9 (21) | |
| Failure | 10 (16) | 5 (10) | 6 (14) | |
| NFM1 wild-type | ||||
| CR | 68 (61) | 64 (62) | 56 (57) | 0.47 |
| CRi | 14 (12) | 20 (19) | 19 (19) | |
| Failure | 30 (27) | 20 (19) | 24 (24) | |
Abbreviations: CR - complete remission; CRi – complete remission with incomplete hematologic recovery
Event-Free Survival
With a median follow up of 33 months among patients without events, there were no significant differences in EFS between any of the arms (all p>0.38, Figure 2). All three arms had plateaued between 2 and 3 years after randomization; 2-year EFS in the DA, IA, and IA+V arms was 36%, 41%, and 37%, respectively; and 3-year EFS was 35%, 37%, and 31% respectively. In subsets defined by cytogenetic risk, FLT3-ITD, NPM1 mutation status, and age (18–39 and 40–60) there were no significant differences (all p>0.20) except in the favorable cytogenetic risk subset, in which the IA and IA+V arms had significantly worse EFS compared to the DA arm (DA versus IA p=0.008, DA versus IA+V p=0.006, Supplemental Figure S1).
Figure 2.
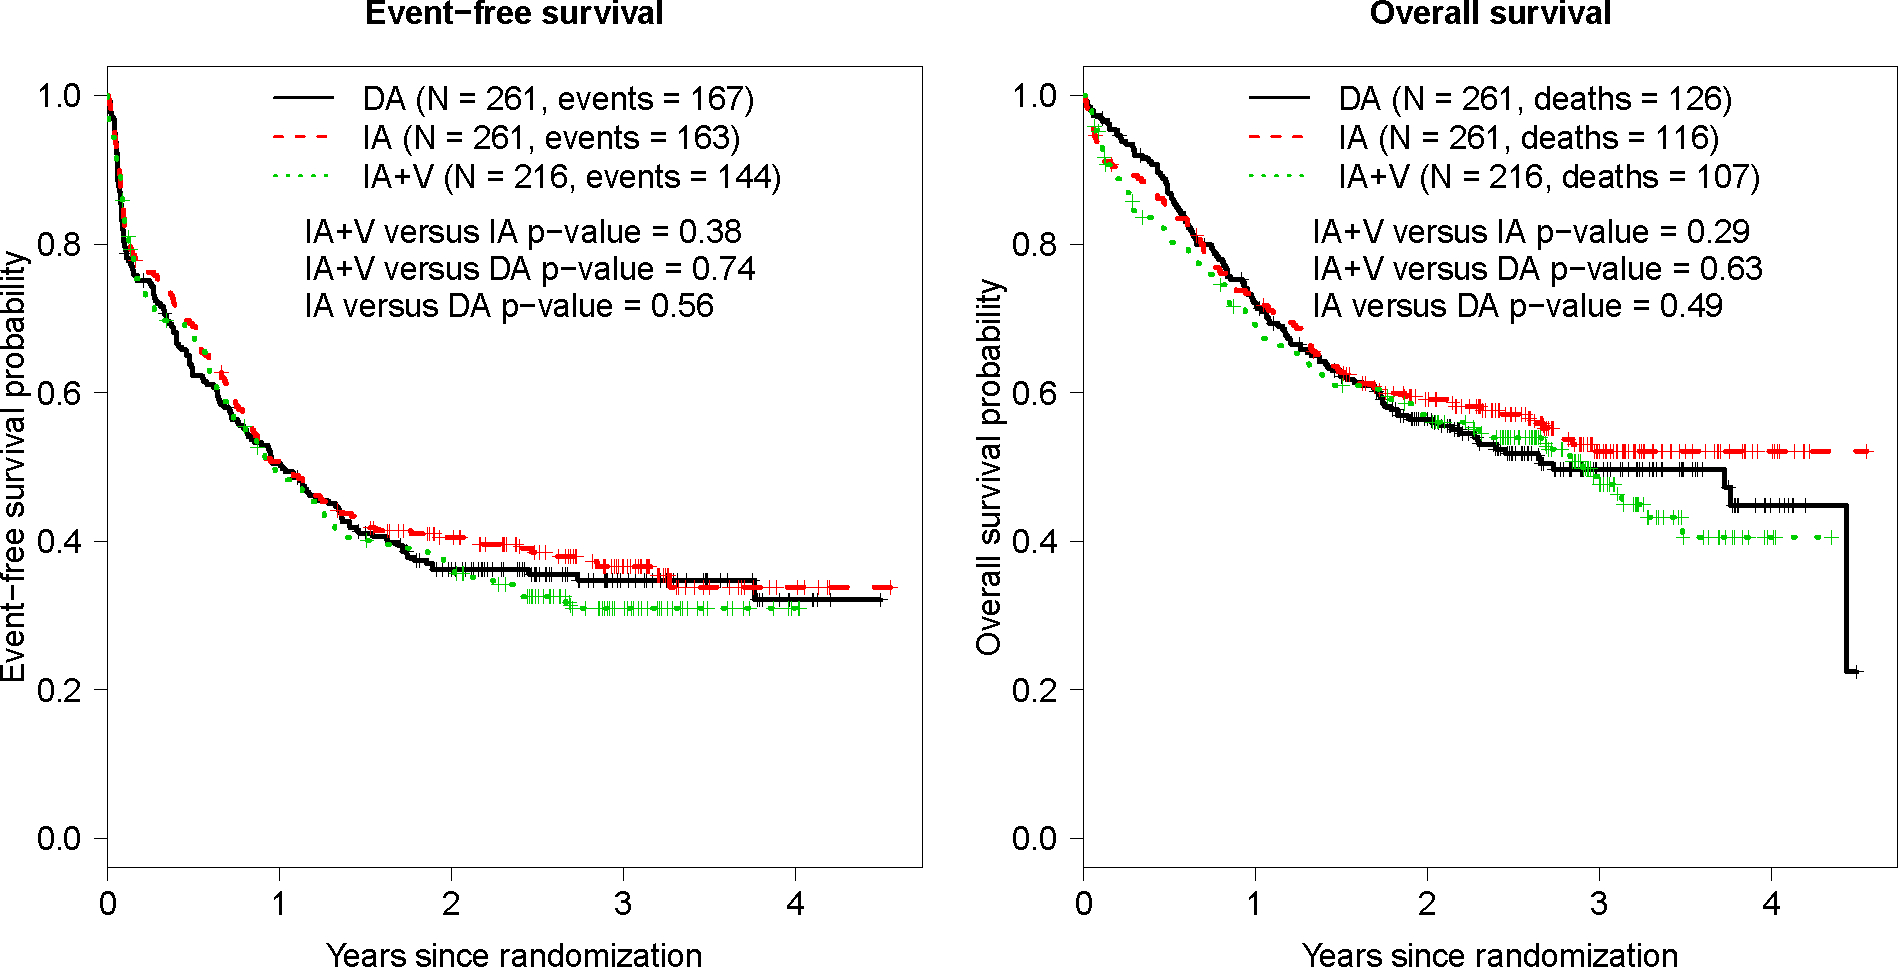
Event-free survival and overall survival by treatment arm.
Overall survival
With a median follow-up of 33 months among patients still alive, there were no significant differences in OS between any of the arms (all p>0.29, Figure 2). Two-year OS in the DA, IA, and IA+V arms was 57%, 59% and 57%, respectively; 3-year OS was 50%, 52%, and 48% respectively. In subsets defined by cytogenetic risk, FLT3-ITD mutation, NPM1 mutation, and age (18–39 and 40–60) there were no significant differences (all p>0.13), including among patients with favorable risk cytogenetics; though the comparison in this subgroup had limited power due to the limited number of events (IA versus DA hazard ratio [HR] = 2.32, p=0.11; IA+V versus DA HR = 1.94, p=0.19 Supplemental Figure S1).
Comparison with historical data
This study was designed based on assumptions from a prior trial in SWOG, S0106, which used DA as the control arm. We used Cox regression models to evaluate differences in survival between the studies controlling for age, gender, performance status, prestudy WBC, platelets, marrow blasts, blood blasts, hemoglobin, secondary AML status, cytogenetic risk, and NPM1/FLT3 mutation status. There were no significant differences in OS between the DA arm of S0106 and the S1203 DA and IA arms (p=0.31 and 0.78 respectively); the OS on the IA+V arm was significantly worse than OS on the S0106 DA arm (HR=1.42, p=0.019).
DISCUSSION
SWOG S1203 was designed with an aim to improve outcomes in younger patients with non-APL AML. This was a cytogenetic and molecular agnostic study, meaning that therapy was not adapted to potentially targetable cytogenetic or molecular alterations (i.e., FLT3 mutations or presence of CBF abnormalities). In this study, the control arm was DA, still the standard of care but incorporating higher doses of daunorubicin, an approach that resulted in improvement in survival in younger patients.6 The experimental arms consisted of a combination of idarubicin with high doses of cytarabine and in combination with the HDAC inhibitor vorinostat.
In the overall study population, no improvement in outcomes (EFS, OS, or response) was observed when comparing the IA arms with DA. There was an increase in drug related toxicities with the IA+V arm. This data indicates that there is no advantage to using a high dose cytarabine based induction compared to standard DA in younger patients with AML. That said, there is no evidence either that DA is superior to any of the other arms. When comparing IA with IA+V, there was no evidence that the addition of vorinostat improved outcomes when compared to IA and therefore there is no justification to add vorinostat to IA.
AML is a heterogeneous disorder that includes distinct molecular and cytogenetic alterations. These molecular alterations are associated with differences in outcomes. The major groups analyzed here included patients with specific molecular alterations (NPM1 and FLT3 mutations) and cytogenetic alterations (poor, intermediate, and favorable risk). No differences in outcomes were observed when comparing DA versus the IA arms except for the subset of patients with favorable risk cytogenetics, with CBF alterations. This subset included 96 (13%) patients that were evenly distributed in each arm. Unfortunately, treatment of this subset of patients underscores the potential complexity of selecting initial treatment of AML based on genetic data as a large majority of centers during the time of the study did not have access to genetic reports until after therapy was already initiated. For instance, at the institution where the IA programs were developed, MD Anderson Cancer Center, investigators had access to cytogenetic and molecular results in the first 2 to 3 days after initial evaluation of patients prior to any therapy, thus allowing optimal therapy stratification.
S1203 was designed in 2010–2011 before systematic data on mutation profiles and targeted agents were available. Recent reports indicate that the addition of a FLT3 inhibitor has resulted in improved outcomes in patients with FLT3 mutated AML and the addition of GO to standard induction chemotherpay may improve outcomes in patients with favorable cytogenetics.8,19
In summary, the data presented from this large multicenter trial indicate that standard 7+3 regimen and IA produce similar outcomes in younger patients with AML except for those with CBF alteration that clearly need a higher dose cytarabine based consolidation approach. The addition of vorinostat did not improve the activity of IA.
Supplementary Material
Table 2.
Toxicity during induction by treatment arm: number of patients with a given type and grade of adverse event.
| Cytarabine + Daunorubicin (DA) (n=261) Grade |
Cytarabine + Idarubicin (IA) (n=259) Grade |
Vorinostat + Cytarabine + Idarubicin (IA+V) (n=211) Grade |
|||||||
|---|---|---|---|---|---|---|---|---|---|
|
| |||||||||
| ADVERSE EVENTS | 3 | 4 | 5 | 3 | 4 | 5 | 3 | 4 | 5 |
|
| |||||||||
| Blood and lymphatic system disorders | |||||||||
| Anemia | 141 (54) | 17( (7) | - | 143 (55) | 21 (8) | - | 100 (47) | 6 (3) | - |
| Blood/lymph disorder-Other | 1 (<1) | - | - | - | 1 (<1) | - | - | - | - |
| Febrile neutropenia | 145 (56) | 7 (3) | - | 150 (58) | 10 (4) | - | 109 (52) | 5 (2) | - |
| Leukocytosis | - | 1 (<1) | - | 1 (<1) | - | - | 1 (<1) | - | - |
| TTP | 1 (<1) | 2 (1) | - | - | - | - | 1 (<1) | 0 | 0 |
| Cardiac disorders | |||||||||
| Atrial fibrillation | - | - | - | - | 3 (1) | - | - | 1 (<1) | - |
| Cardiac arrest | - | - | 1 (<1) | - | - | 3 (1) | - | 1 (<1) | 1 (<1) |
| Cardiac disorder-Other, spec | 1 (<1) | - | - | - | 1 (<1) | - | - | 1 (<1) | - |
| Conduction disorder | - | 1 (<1) | - | - | - | - | - | - | - |
| Heart failure | 4 (2) | - | - | 2 (1) | - | 0 | 1 (<1) | 2 (1) | - |
| Pericardial tamponade | - | - | - | - | - | - | - | 1 (<1) | - |
| Gastrointestinal disorders | |||||||||
| Colitis | 3 (1) | - | - | 9 (3) | - | - | 4 (2) | 1 (<1) | - |
| Colonic perforation | - | - | - | - | - | - | - | 1 (<1) | - |
| Diarrhea | 15 (6) | - | - | 20 (8) | - | - | 37 (18) | 1 (<1) | - |
| Duodenal hemorrhage | - | 1 (<1) | - | - | - | - | - | - | - |
| Enterocolitis | 1 (<1) | - | - | 4 (2) | 2 (1) | - | 5 (2) | - | - |
| GI disorders-Other, specify | 1 (<1) | - | - | 3 (1) | 2 (1) | - | - | - | - |
| Gastric hemorrhage | - | - | - | 1 (<1) | - | 1 (<1) | 2 (1) | 1 (<1) | - |
| Mucositis oral | 18 (7) | 1 (<1) | - | 18 (7) | - | - | 11 (5) | - | - |
| Typhlitis | 7 (3) | - | 1 (<1) | 14 (5) | - | - | 22 (10) | 1 (<1) | - |
| General disorders and administration site conditions | |||||||||
| Death NOS | - | - | 2 (1) | - | - | 1 (<1) | - | - | - |
| Fever | 3 (1) | 1 (<1) | - | 7 (3) | - | - | 5 (2) | 1 (<1) | - |
| Gen disorders/admin site cond | - | - | - | 3 (1) | 1 (<1) | - | 1 (<1) | - | - |
| Multi-organ failure | - | - | 1 (<1) | - | 2 (1) | 1 (<1) | 1 (<1) | 2 (1) | 2 (1) |
| Hepatobiliary disorders | |||||||||
| Hepatic failure | - | 1 (<1) | - | - | - | - | - | - | - |
| Hepatobil disorders-Other | - | - | 1 (<1) | - | - | - | 1 (<1) | - | - |
| Infections and infestations | |||||||||
| Abdominal infection | 1 (<1) | - | - | - | 1 (<1) | - | 1 (<1) | - | - |
| Infections/infestations-Other | 17 (7) | 1 (<1) | - | 19 (7) | 2 (1) | - | 13 (6) | - | - |
| Lung infection | 21 (8) | - | - | 18 (7) | 4 (2) | - | 12 (6) | 2 (1) | - |
| Scrotal infection | - | - | - | - | - | - | - | 1 (<1) | - |
| Sepsis | - | 16 (6) | - | - | 19 (7) | 7 (3) | - | 27 (13) | 7 (3) |
| Soft tissue infection | - | 1 (<1) | - | - | - | - | - | - | - |
| Injury, poisoning and procedural complications | |||||||||
| Vascular access complication | - | - | - | 2 (1) | - | - | - | 1 (<1) | - |
| Investigations | |||||||||
| ALT increased | 11 (4) | 1 (<1) | - | 17 (7) | - | - | 19 (9) | 1 (<1) | - |
| AST increased | 7 (3) | 1 (<1) | - | 15 (6) | - | - | 11 (5) | 1 (<1) | - |
| Blood bilirubin increased | 8 (3) | 1 (<1) | - | 12 (5) | 3 (1) | - | 18 (9) | 4 (2) | - |
| CD4 lymphocytes decreased | - | 1 (<1) | - | - | 1 (<1) | - | - | - | - |
| Creatinine increased | 1 (<1) | - | - | 4 (2) | 2 (1) | - | 3 (2) | 1 (<1) | - |
| ECG QT corrected int prolong | - | - | - | 1 (<1) | 1 (<1) | - | 2 (1) | - | - |
| Ejection fraction decreased | 2 (1) | 1 (<1) | - | 5 (2) | 1 (<1) | - | 4 (2) | - | - |
| Investigations-Other, specify | 1 (<1) | - | - | 2 (1) | 4 (2) | - | 1 (<1) | 2 (1) | - |
| Lymphocyte count decreased | 31 (12) | 58 (22) | - | 19 (7) | 88 (34) | - | 8 (4) | 69 (33) | - |
| Neutrophil count decreased | 2 (1) | 140 (54) | - | 9 (3) | 119 (46) | - | 2 (1) | 102 (48) | - |
| Platelet count decreased | 10 (4) | 165 (63) | - | 9 (4) | 159 (61) | - | 9 (4) | 118 (56) | - |
| White blood cell decreased | 7 (3) | 149 (57) | - | 15 (6) | 145 (56) | - | 5 (2) | 107 (51) | - |
| Metabolism and nutrition disorders | |||||||||
| Acidosis | - | 1 (<1) | - | 1 (<1) | - | - | 1 (<1) | 1 (<1) | - |
| Anorexia | 4 (2) | 1 (<1) | - | 16 (6) | - | - | 11 (5) | - | - |
| Hyperglycemia | 5 (2) | - | - | 10 (4) | 2 (1) | - | 15 (7) | 1 (<1) | - |
| Hyperkalemia | - | - | - | - | 1 (<1) | - | 1 (<1) | - | - |
| Hypernatremia | - | - | - | - | - | - | 1 (<1) | 1 (<1) | - |
| Hyperuricemia | - | - | - | 1 (<1) | - | - | - | 1 (<1) | - |
| Hypoalbuminemia | 4 (2) | 1 (<1) | - | 8 (3) | - | - | 8 (4) | - | - |
| Hypocalcemia | 7 (3) | 1 (<1) | 16 (6) | 1 (<1) | - | 22 (10_ | 3 (1) | - | |
| Hypokalemia | 15 (6) | 3 (1) | - | 20 (8) | - | - | 22 (10) | 2 (1) | - |
| Hyponatremia | 18 (7) | 2 (1) | - | 20 (8) | - | - | 9 (4) | - | - |
| Hypophosphatemia | 18 (7) | 3 (1) | - | 27 (10) | 4 (2) | - | 29 (14) | 2 (1) | - |
| Nervous system disorders | |||||||||
| Edema cerebral | - | - | - | - | - | - | - | 1 (<1) | - |
| Intracranial hemorrhage | - | - | - | - | - | - | - | - | 1 (<1) |
| Nervous sys disorders-Other | - | - | - | - | - | 1 (<1) | - | - | - |
| Stroke | - | - | - | 1 (<1) | - | - | - | 1 (<1) | - |
| Vasovagal reaction | - | - | - | 1 (<1) | - | - | - | 1 (<1) | - |
| Renal and urinary disorders | |||||||||
| Acute kidney injury | - | 2 (1) | - | 2 (1) | 3 (1) | - | 2 (1) | 2 (1) | - |
| Chronic kidney disease | - | - | - | 1 (<1) | 1 (<1) | - | - | - | - |
| Renal/urinary disorders-Other | - | - | - | - | 1 (<1) | - | - | - | - |
| Respiratory, thoracic and mediastinal disorders | |||||||||
| ARDS | - | 1 (<1) | - | 1 (<1) | 1 (<1) | 1 (<1) | - | 4 (2) | - |
| Bronchopulmonary hemorrhage | 1 (<1) | - | - | - | 1 (<1) | - | 1 (<1) | 1 (<1) | 1 (<1) |
| Dyspnea | 2 (1) | 1 (<1) | - | 4 (2) | 3 (1) | - | 5 (2) | 3 (1) | - |
| Hypoxia | 1 (<1) | 1 (<1) | - | 3 (1) | 1 (<1) | - | 5 (2) | 4 (2) | - |
| Pneumonitis | 1 (<1) | - | - | 3 (1) | 1 (<1) | - | 2 (1) | - | - |
| Pulmonary edema | 1 (<1) | - | - | 1 (<1) | 1 (<1) | - | 4 (2) | 1 (<1) | - |
| Resp/thoracic/mediastinal ds | 1 (<1) | - | - | 2 (1) | 1 (<1) | - | 1 (<1) | 1 (<1) | - |
| Respiratory failure | - | 2 (1) | 1 (<1) | - | 5 (2) | 3 (1) | - | 10 (5) | 4 (2) |
| Vascular disorders | |||||||||
| Hematoma | - | - | - | - | 0 | 1 (<1) | - | - | - |
| Hypertension | 7 (3) | - | - | 6 (2) | - | - | 5 (2) | 1 (<1) | - |
| Hypotension | 3 (1) | - | - | 8 (3) | 4 (2) | - | 4 (2) | 5 (2) | - |
| MAX. GRADE ANY ADVERSE EVENT | |||||||||
| 26 (10) | 192 (74) | 7 (3) | 29 (11) | 187 (72) | 18 (7) | 33 (11) | 143 (68) | 16 (8) | |
Adverse events unlikely or not related to treatment have been excluded. Adverse events with no entries for grades 4 to 5 have been suppressed.
Support and Acknowledgments
Research reported in this publication was supported by the National Cancer Institute of the National Institutes of Health under Award Numbers CA180888, CA180819, CA18020, CA180821, CA180863, CA077202, CA180816, CA180855, CA180846, CA189848, CA189957, CA180858, CA189860, CA180798, CA189953, CA189856, CA180835, CA189822, CA189971, CA189858, CA189830, CA180801, CA189853, CA189872, CA180826, CA11083, CA46282, CA46368, CA46136, CA46113, CA16385, CA12644, CA04919, CA13612, CA35119, CA73590, CA58723, CA016672, and CCSRI #021039. The content is solely the responsibility of the authors and does not necessarily represent the official views of the National Institutes of Health.
We thank the patients who participated in this trial and their families, the team members from each treating institution, and the support staff of the SWOG Operations Office and Statistics and Data Management Center.
Footnotes
Competing Interests statement:
The authors disclose that they do not have any competing financial interests in relation to the work described in the manuscript.
REFERENCES
- 1.Dohner H, Weisdorf DJ, Bloomfield CD. Acute Myeloid Leukemia. N Engl J Med 2015;373(12):1136–52. DOI: 10.1056/NEJMra1406184. [DOI] [PubMed] [Google Scholar]
- 2.Patel JP, Gonen M, Figueroa ME, et al. Prognostic relevance of integrated genetic profiling in acute myeloid leukemia. N Engl J Med 2012;366(12):1079–89. DOI: 10.1056/NEJMoa1112304. [DOI] [PMC free article] [PubMed] [Google Scholar]
- 3.Dohner H, Wei AH, Appelbaum FR, et al. Diagnosis and management of AML in adults: 2022 recommendations from an international expert panel on behalf of the ELN. Blood 2022;140(12):1345–1377. DOI: 10.1182/blood.2022016867. [DOI] [PubMed] [Google Scholar]
- 4.Dinardo CD, Jonas BA, Pullarkat V, et al. Azacitidine and Venetoclax in Previously Untreated Acute Myeloid Leukemia. New England Journal of Medicine 2020;383(7):617–629. DOI: 10.1056/nejmoa2012971. [DOI] [PubMed] [Google Scholar]
- 5.Mayer RJ, Davis RB, Schiffer CA, et al. Intensive postremission chemotherapy in adults with acute myeloid leukemia. Cancer and Leukemia Group B. N Engl J Med 1994;331(14):896–903. DOI: 10.1056/NEJM199410063311402. [DOI] [PubMed] [Google Scholar]
- 6.Fernandez HF, Sun Z, Yao X, et al. Anthracycline dose intensification in acute myeloid leukemia. N Engl J Med 2009;361(13):1249–59. DOI: 10.1056/NEJMoa0904544. [DOI] [PMC free article] [PubMed] [Google Scholar]
- 7.Garcia-Manero G, Tambaro FP, Bekele NB, et al. Phase II trial of vorinostat with idarubicin and cytarabine for patients with newly diagnosed acute myelogenous leukemia or myelodysplastic syndrome. J Clin Oncol 2012;30(18):2204–10. DOI: 10.1200/JCO.2011.38.3265. [DOI] [PMC free article] [PubMed] [Google Scholar]
- 8.Stone RM, Mandrekar SJ, Sanford BL, et al. Midostaurin plus Chemotherapy for Acute Myeloid Leukemia with a FLT3 Mutation. N Engl J Med 2017;377(5):454–464. DOI: 10.1056/NEJMoa1614359. [DOI] [PMC free article] [PubMed] [Google Scholar]
- 9.Holowiecki J, Grosicki S, Giebel S, et al. Cladribine, but not fludarabine, added to daunorubicin and cytarabine during induction prolongs survival of patients with acute myeloid leukemia: a multicenter, randomized phase III study. J Clin Oncol 2012;30(20):2441–8. DOI: 10.1200/JCO.2011.37.1286. [DOI] [PubMed] [Google Scholar]
- 10.Garcia-Manero G, Yang H, Bueso-Ramos C, et al. Phase 1 study of the histone deacetylase inhibitor vorinostat (suberoylanilide hydroxamic acid [SAHA]) in patients with advanced leukemias and myelodysplastic syndromes. Blood 2008;111(3):1060–6. DOI: 10.1182/blood-2007-06-098061. [DOI] [PubMed] [Google Scholar]
- 11.Kadia TM, Yang H, Ferrajoli A, et al. A phase I study of vorinostat in combination with idarubicin in relapsed or refractory leukaemia. Br J Haematol 2010;150(1):72–82. DOI: 10.1111/j.1365-2141.2010.08211.x. [DOI] [PMC free article] [PubMed] [Google Scholar]
- 12.Sanchez-Gonzalez B, Yang H, Bueso-Ramos C, et al. Antileukemia activity of the combination of an anthracycline with a histone deacetylase inhibitor. Blood 2006;108(4):1174–82. DOI: 10.1182/blood-2005-09-008086. [DOI] [PMC free article] [PubMed] [Google Scholar]
- 13.Pagel JM, Othus M, Garcia-Manero G, et al. Rapid Donor Identification Improves Survival in High-Risk First-Remission Patients With Acute Myeloid Leukemia. JCO Oncology Practice 2020;16(6):e464–e475. DOI: 10.1200/jop.19.00133. [DOI] [PMC free article] [PubMed] [Google Scholar]
- 14.Slovak ML, Kopecky KJ, Cassileth PA, et al. Karyotypic analysis predicts outcome of preremission and postremission therapy in adult acute myeloid leukemia: a Southwest Oncology Group/Eastern Cooperative Oncology Group Study. Blood 2000;96(13):4075–83. (https://www.ncbi.nlm.nih.gov/pubmed/11110676). [PubMed] [Google Scholar]
- 15.Medeiros BC, Kohrt HE, Arber DA, et al. Immunophenotypic features of acute myeloid leukemia with inv(3)(q21q26.2)/t(3;3)(q21;q26.2). Leukemia Research 2010;34(5):594–597. DOI: 10.1016/j.leukres.2009.08.029. [DOI] [PMC free article] [PubMed] [Google Scholar]
- 16.Fang M, Storer B, Estey E, et al. Outcome of patients with acute myeloid leukemia with monosomal karyotype who undergo hematopoietic cell transplantation. Blood 2011;118(6):1490–4. DOI: 10.1182/blood-2011-02-339721. [DOI] [PMC free article] [PubMed] [Google Scholar]
- 17.Middeke JM, Fang M, Cornelissen JJ, et al. Outcome of patients with abnl(17p) acute myeloid leukemia after allogeneic hematopoietic stem cell transplantation. Blood 2014;123(19):2960–7. DOI: 10.1182/blood-2013-12-544957. [DOI] [PubMed] [Google Scholar]
- 18.Cheson BD, Bennett JM, Kopecky KJ, et al. Revised recommendations of the International Working Group for Diagnosis, Standardization of Response Criteria, Treatment Outcomes, and Reporting Standards for Therapeutic Trials in Acute Myeloid Leukemia. J Clin Oncol 2003;21(24):4642–9. DOI: 10.1200/JCO.2003.04.036. [DOI] [PubMed] [Google Scholar]
- 19.Appelbaum FR, Bernstein ID. Gemtuzumab ozogamicin for acute myeloid leukemia. Blood 2017;130(22):2373–2376. DOI: 10.1182/blood-2017-09-797712. [DOI] [PubMed] [Google Scholar]
Associated Data
This section collects any data citations, data availability statements, or supplementary materials included in this article.