-
Notifications
You must be signed in to change notification settings - Fork 2
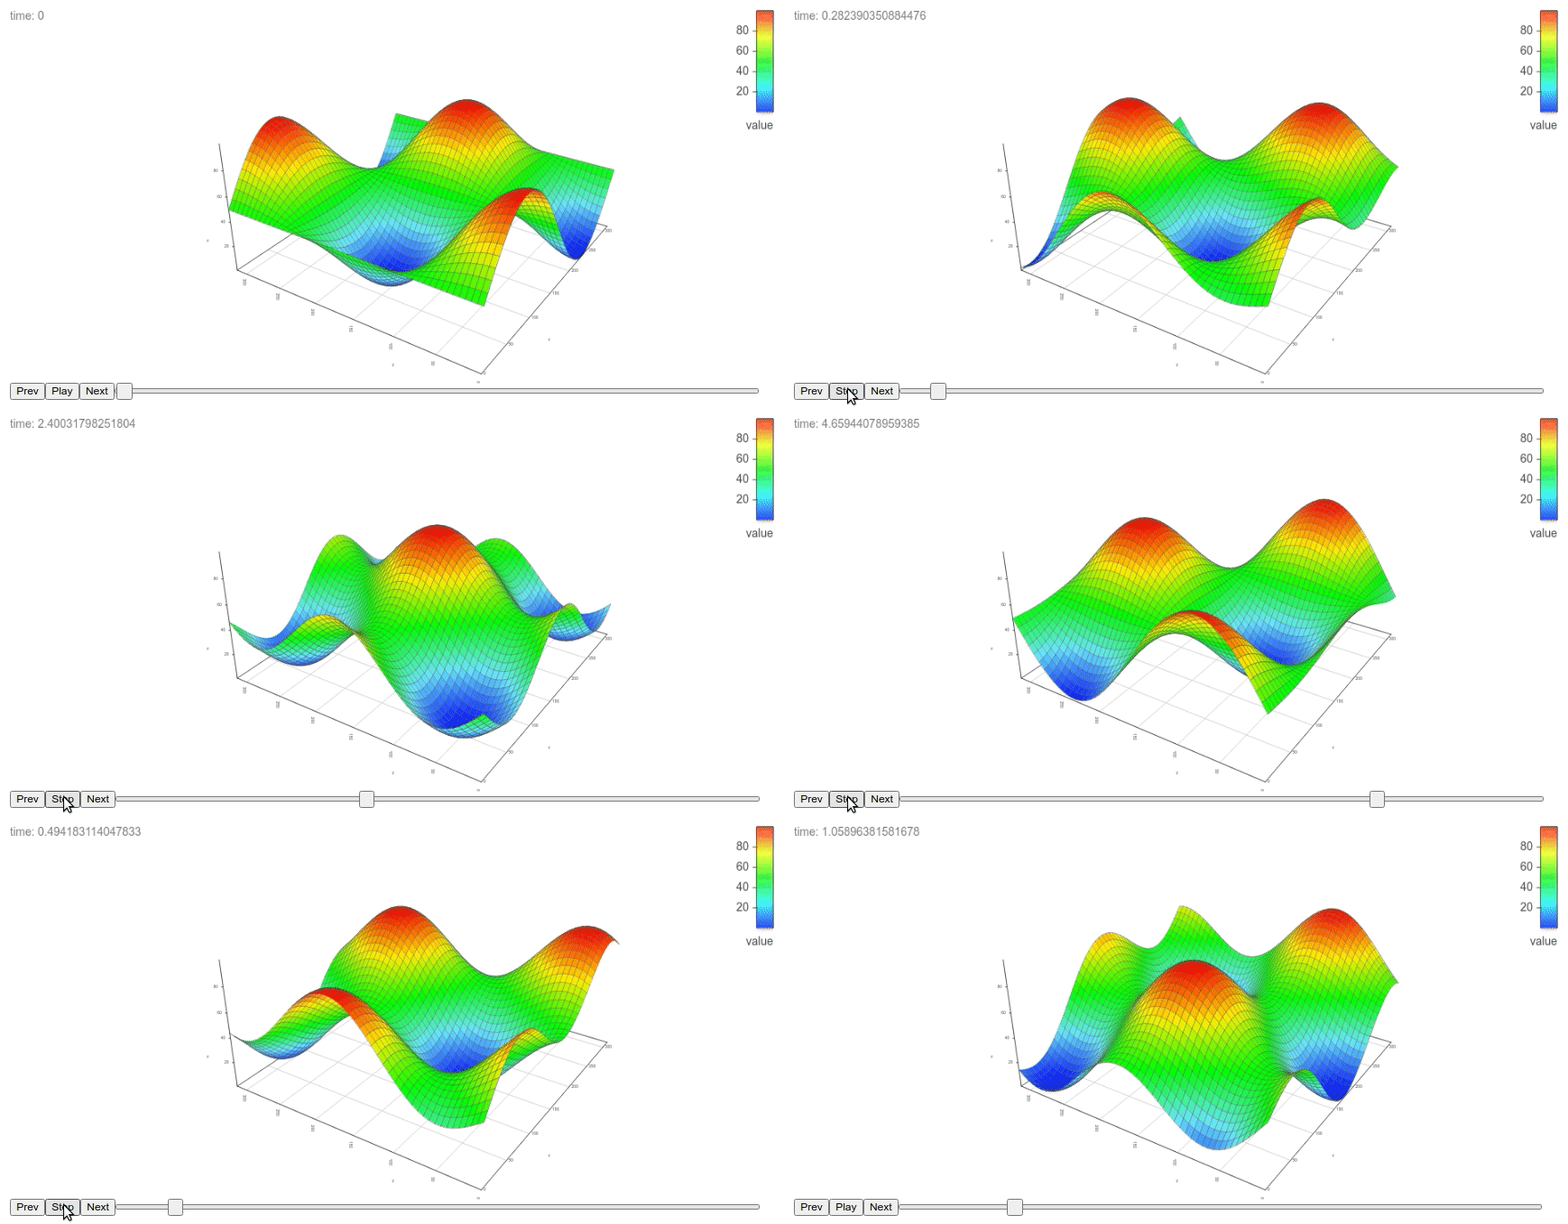
Create interactive visualization charts to draw data in three dimensional graphs. The graphs can be included in Shiny apps and R markdown documents, or viewed from the R console and 'RStudio' Viewer. Based on the 'vis.js' Graph3d module and the 'htmlwidgets' R package.
License
stla/graph3d
Folders and files
| Name | Name | Last commit message | Last commit date | |
|---|---|---|---|---|
Repository files navigation
About
Create interactive visualization charts to draw data in three dimensional graphs. The graphs can be included in Shiny apps and R markdown documents, or viewed from the R console and 'RStudio' Viewer. Based on the 'vis.js' Graph3d module and the 'htmlwidgets' R package.
Topics
Resources
License
Stars
Watchers
Forks
Releases
No releases published
Packages 0
No packages published
