-
Notifications
You must be signed in to change notification settings - Fork 2
How to investigate slowness with PerfView
The article shows how to get an understanding how time is spent between methods in a given scenario.
We'll try to understand the nature of the Experience Editor opening speed and potential steps to improve it.
The game plan is:
- Record the video showing what are threads doing
- Find the
slowoperation in the video by filtering other participants - Figure out what makes it slow
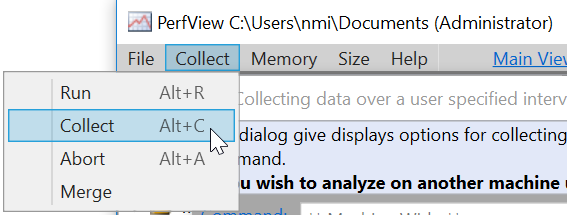
We'll use the free PerfView by Microsoft - just 2 clicks to collect the needed data:

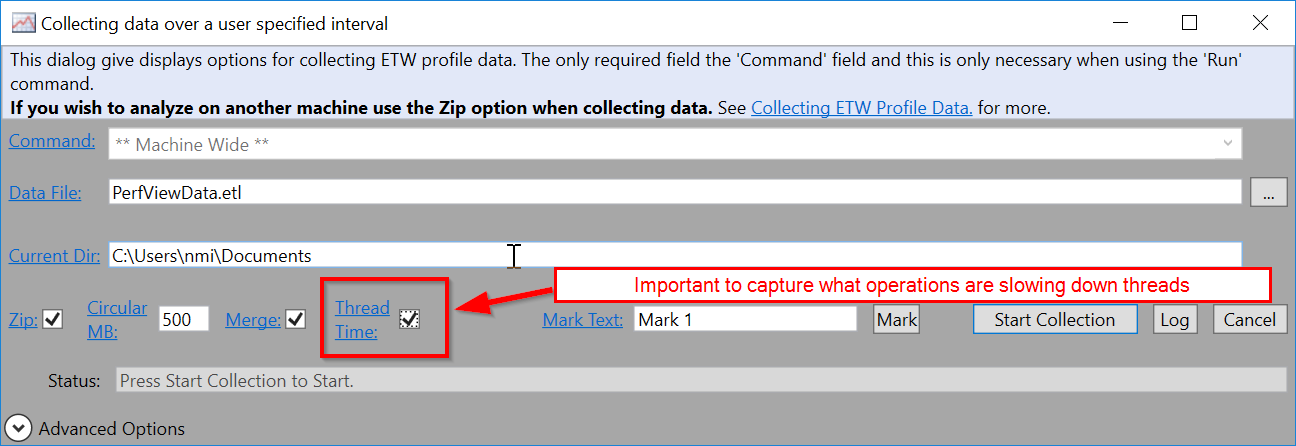
Important to select ALL CHECKBOXES as Thread Time is unchecked by default:

Once you push Start Collection data needed in 98% cases is already picked.
- The closer profiling session matches the
slowoperation timing, the less noise you get - A few 2 long profiles are far better than one hour long

Please do NOT collect profiles longer than a few minutes.
The demo is to investigate what affects Experience Editor opening performance, preparation = login to Sitecore.
Main points from How to collect performance profiles for slow pages by PerfView:
- Start the collection
- Perform slow operation (Request Experience Editor page)
- Stop collection after page fully loaded

The definitive description of the steps from How to analyze the PerfView profile with thread time data video:
- Advanced group already ships with a cooked report
Thread Time (with Tasks) Stacks- just open it - Add the values to the
IncPatstextbox to filter out tons of non-needed data:-
Sitecoreto only include frames having smth to do with our application -
System.Webto only include frames dealing with Web operations (filter out FileWatchers and background workers)
-
- Find the heaviest thread by ordering frames
Inccolumn and adding it toIncPatsfilter - Hiding the noise done by fast operations by setting
Foldingto a few % - There are well-known empty methods that do not cause any load and can be
Foldedto simplify the graph, examples:- CorePipeline.Run -> just invoke processors one-by-one
- dynamicClass -> Sitecore Reflection feature allowing fastest method call
- Switching to the
Flame graphview we can hover over bars to find what slows us down- The wider bar - the more time spent there
- Colors do not matter, they were picked to easily distinguish different frames
Our example shows System.Web.Compilation.BuildManager.GetCompiledType consumes a big pile of time.
- Review the source code for any obvious reason
- Debug the code with runtime values to see what is so specific here
- Create a micro-benchmark with current code VS suggested measuring the performance gain/win
