🚀 polyglot, lighweight, multi-standard drop-in observability framework for Logs, Metrics and Traces
... it's pronounced /ˈkwɪr..ɪŋ/ or just querying
- Polyglot: All-in-one, Drop-in compatible with Loki, Prometheus, Tempo, Pyroscope
- Lightweight: Powered by Bun - the fast, all-in-one JavaScript runtime + ClickHouse OLAP Engine
- Familiar: Use stable & popular LogQL, PromQL, TempoQL languages to query and visualize data
- Voracious: Ingest using Opentelemetry, Loki, Prometheus, Tempo, Influx, Datadog, Elastic & more
- Versatile: Explore data with qryn's built-in Explorer and CLI or native Grafana datasource compatibility
- Secure: Retain total control of data, using ClickHouse, DuckDB or InfluxDB IOx with S3 object storage
- Unmetered: Unlimited FOSS deployments or qryn.cloud option with advanced features and performance
- Indepentent: Opensource, Community powered, Anti lock-in alternative to Vendor controlled stacks
- Setup & Deploy qryn OSS using the documentation and get help in our Matrix room

- No time? Use qryn.cloud and get polyglot in just minutes! Drop-in LGTM alternative ☁️

💡 qryn independently implements popular observability standards, protocols and query languages
qryn ships with view - our zero dependency, lightweight data explorer for Logs, Metrics and Traces

⚡ qryn is officially integrated with opentelemetry supports any log, trace or metric format
Ingested data can be queried using any of the avialable qryn APIs (LogQL, PromQL, TraceQL)
💡 No modifications required to your opentelemetry instrumentation!
qryn supports native ingestion for Loki, Prometheus, Tempo/Zipkin and many other protocols
With qryn users can push data using any combination of supported APIs and formats
💡 No opentelemetry or any other middlewayre/proxy required!
Any Loki compatible client or application can be used with qryn out of the box
⚡ qryn implements the Loki API for transparent compatibility with LogQL clients
The Grafana Loki datasource can be used to natively browse and query logs and display extracted timeseries

🎉 No plugins needed
👁️ No Grafana? No problem! Use View
Any Prometheus compatible client or application can be used with qryn out of the box
⚡ qryn implements the Prometheus API for transparent PromQL compatibility using WASM 🏆
The Grafana Prometheus datasource can be used to natively to query metrics and display timeseries

🎉 No plugins needed
👁️ No Grafana? No problem! Use View
⚡ qryn implements the Tempo API for transparent compatibility with TraceQL clients.
Any Tempo/Opentelemetry compatible client or application can be used with qryn out of the box
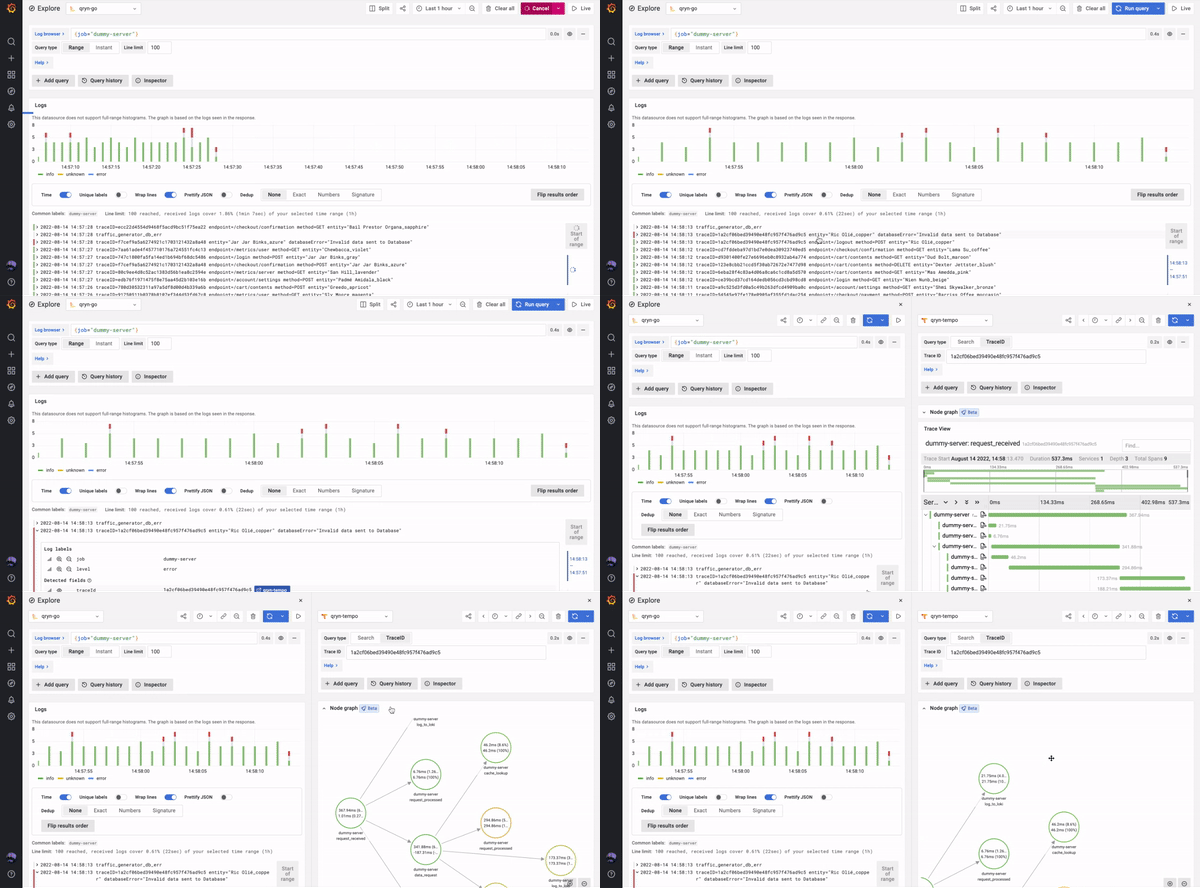
The Tempo datasource can be used to natively query traces including TraceQL and supporting service graphs

🎉 No plugins needed
👁️ No Grafana? No problem! Use View
qryn can ingest data using formats from InfluxDB, DataDog, Elastic and other vendors.
With qryn and grafana everything just works right out of the box:
- Native datasource support without any plugin or extension
- Advanced Correlation between Logs, Metrics and Traces
- Service Graphs and Service Status Panels, and all the cool features

📚 Follow our team behind the scenes on the qryn blog
Whether it's code, documentation or grammar, we ❤️ all contributions. Not sure where to get started?
- Join our Matrix Channel, and ask us any questions.
- Have a PR or idea? Request a session / code walkthrough with our team for guidance.
©️ QXIP BV, released under the GNU Affero General Public License v3.0. See LICENSE for details.
