Price data provided by cryptocompare.com.
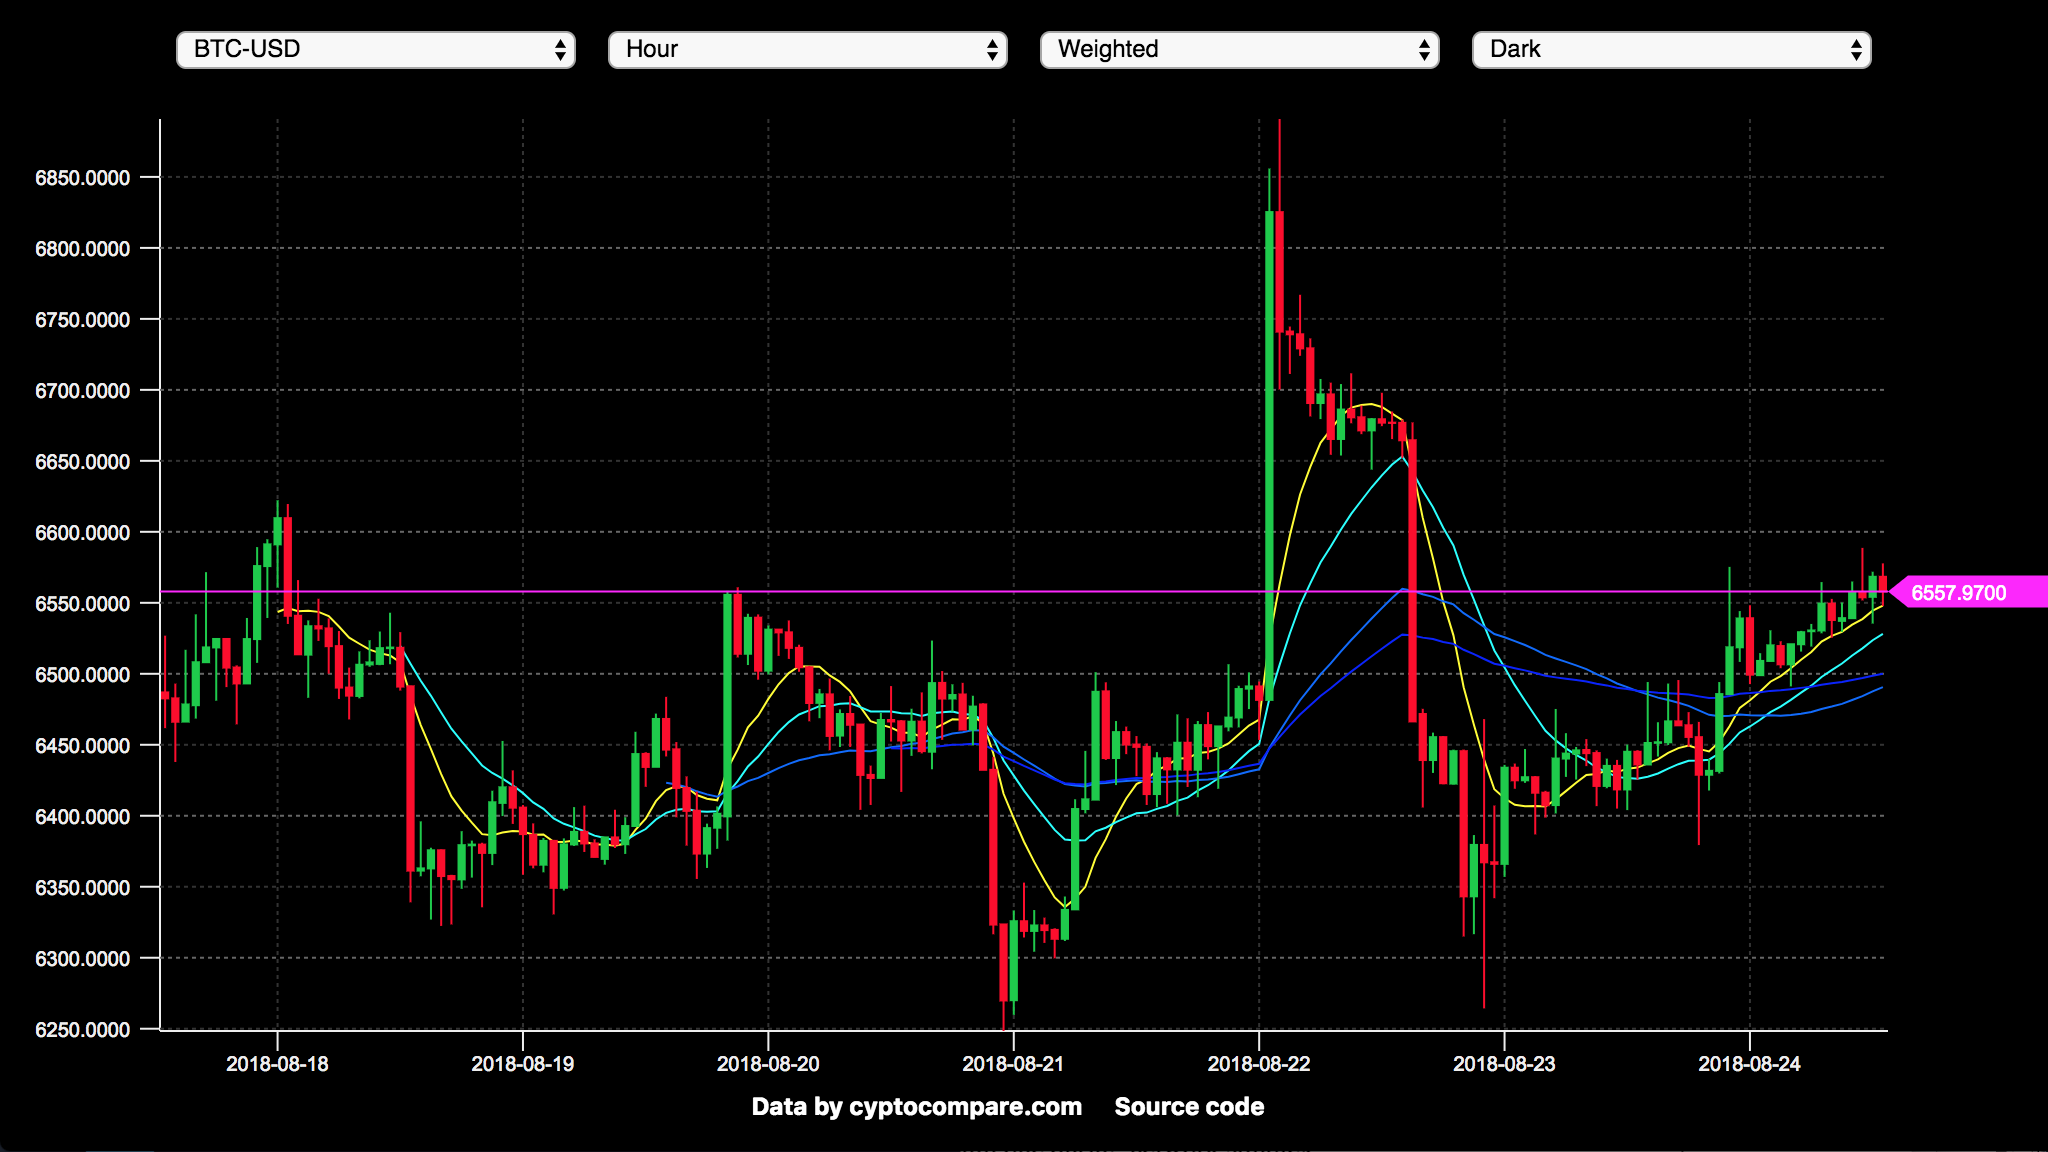
This example demonstrates how to use @thi.ng/rstream & @thi.ng/transducers constructs to create a basic crypto-currency candle chart with multiple moving averages plots. Unlike most other examples in this repo, there's no additional state handling used (e.g. via @thi.ng/atom constructs) and the entire app largely relies on various stream combinators & transformers. Furthermore, this approach only triggers UI updates / diffs when there were any relevant upstream value changes.
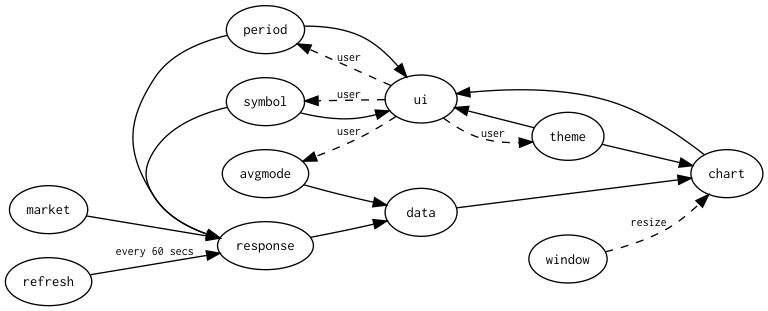
The diagram below shows a schematic of the dataflow graph used:
Please refer to the example build instructions on the wiki.
- Karsten Schmidt
© 2018 Karsten Schmidt // Apache Software License 2.0

