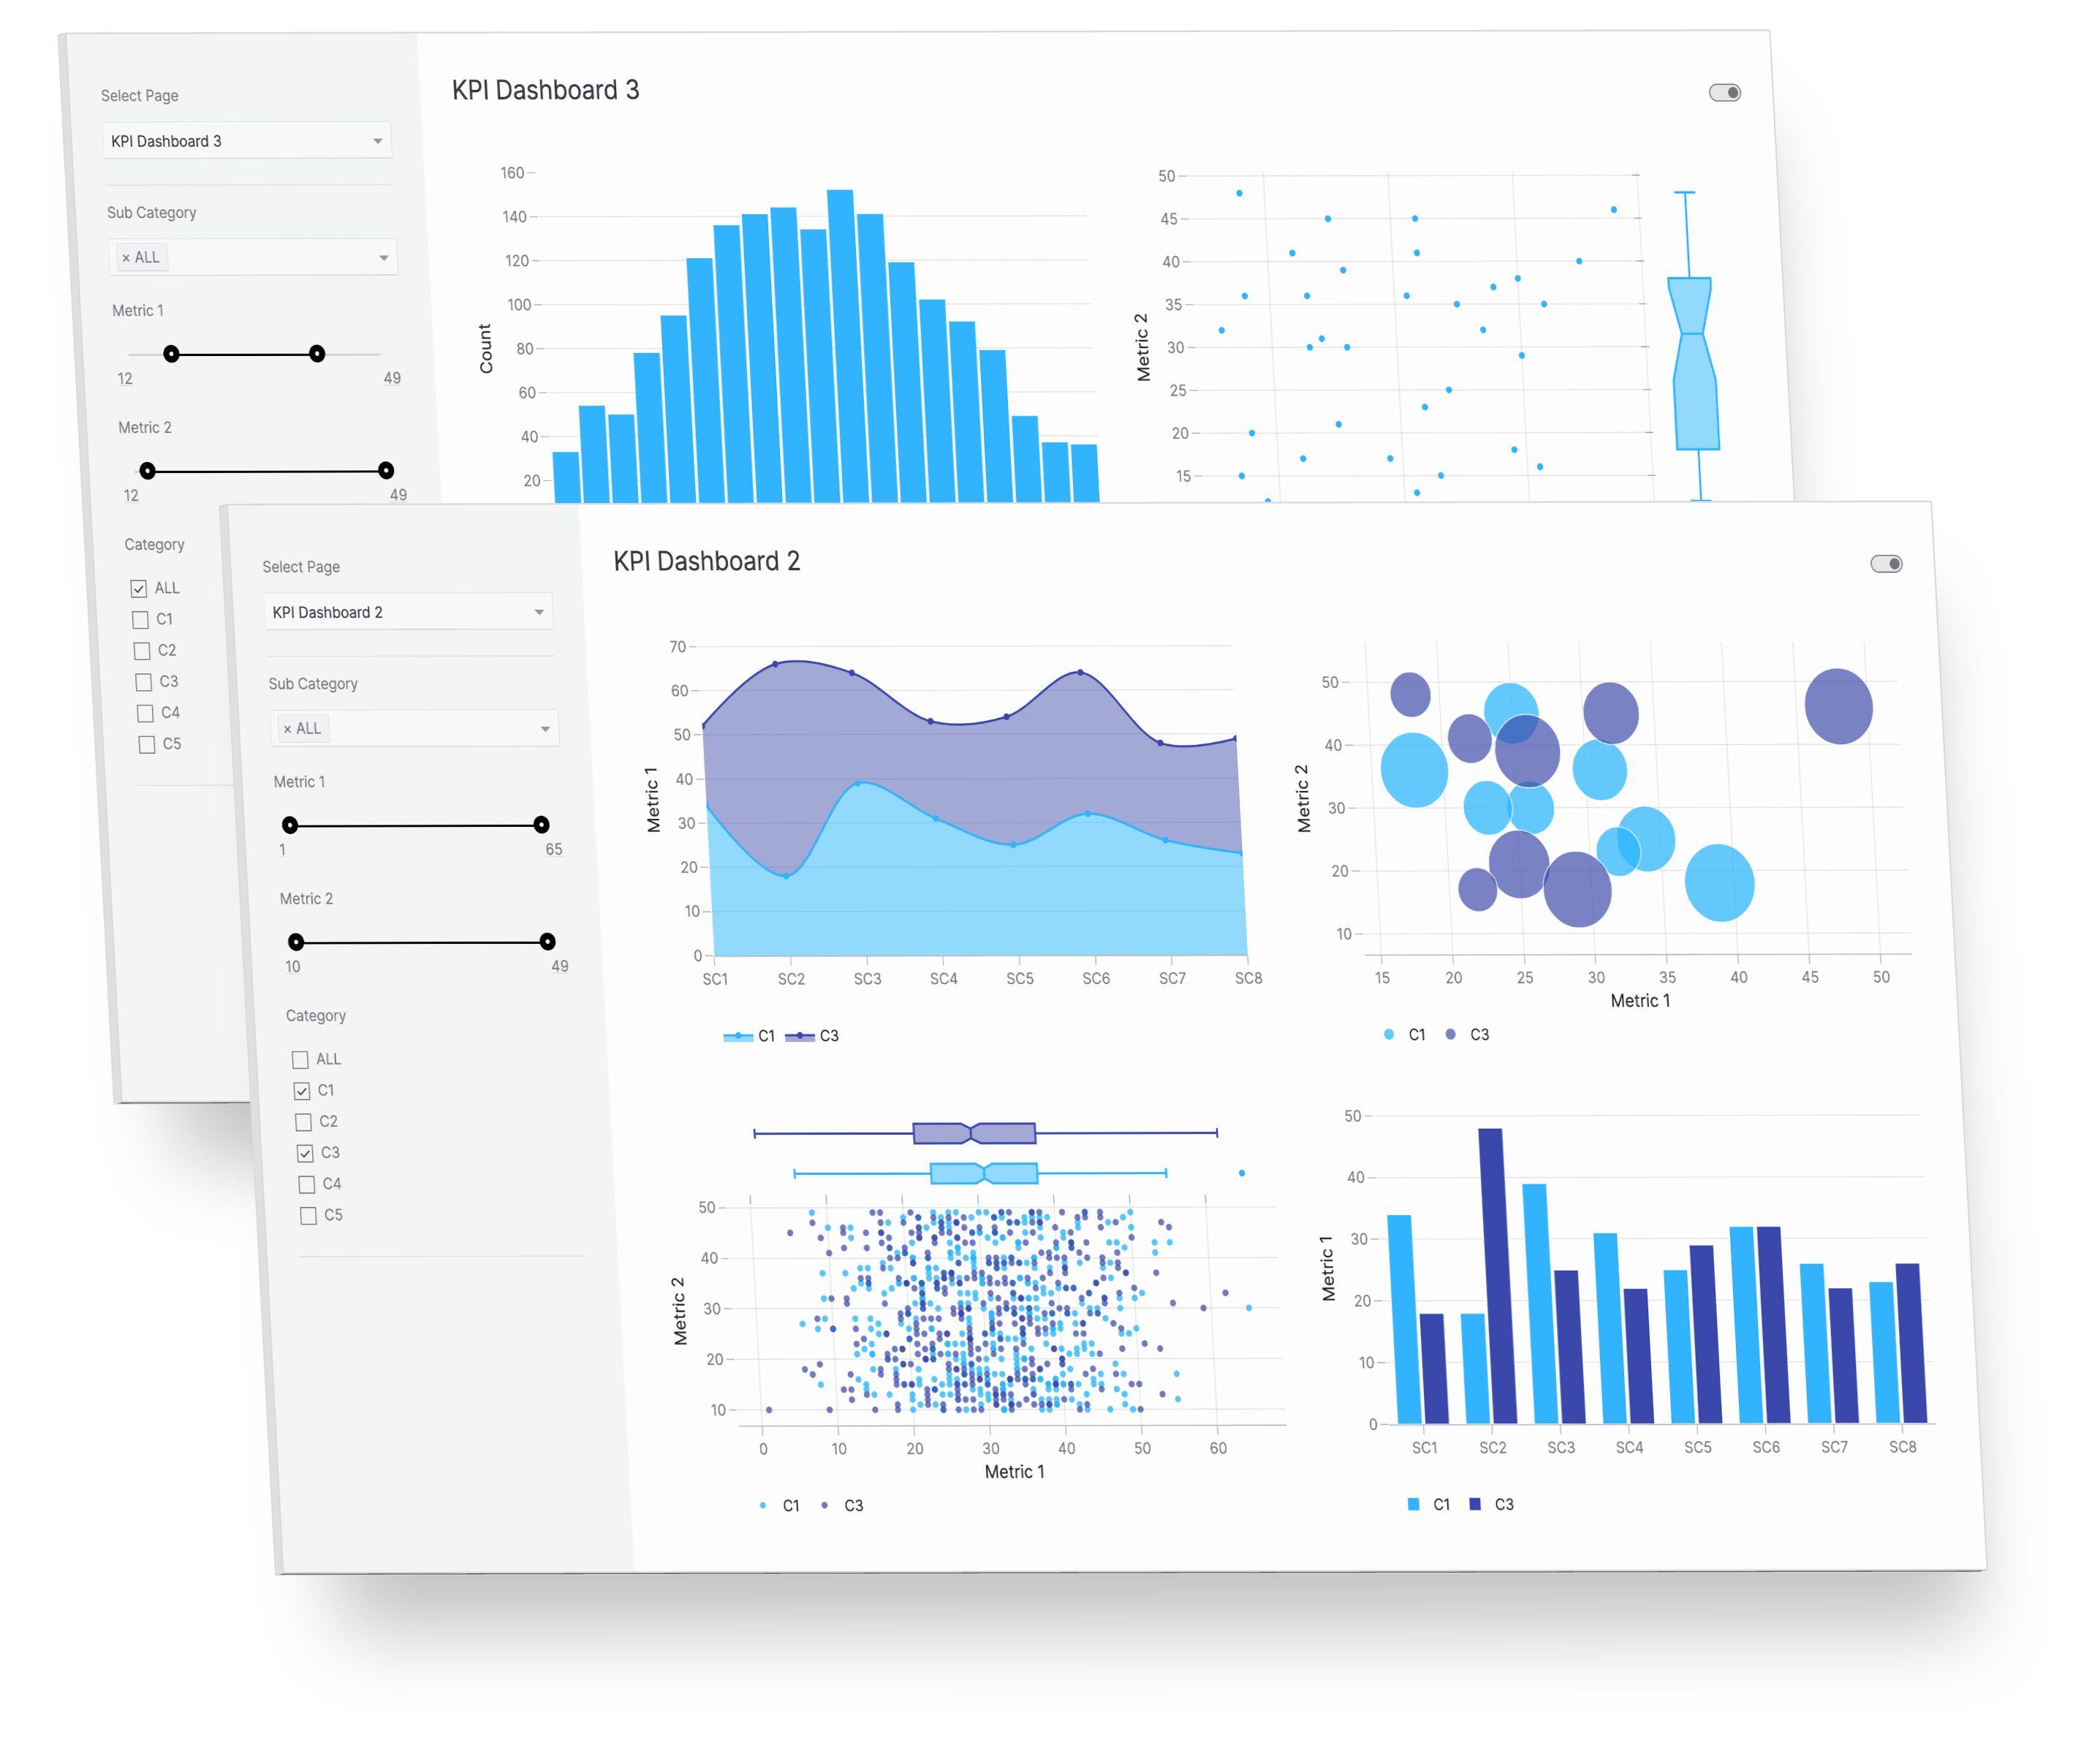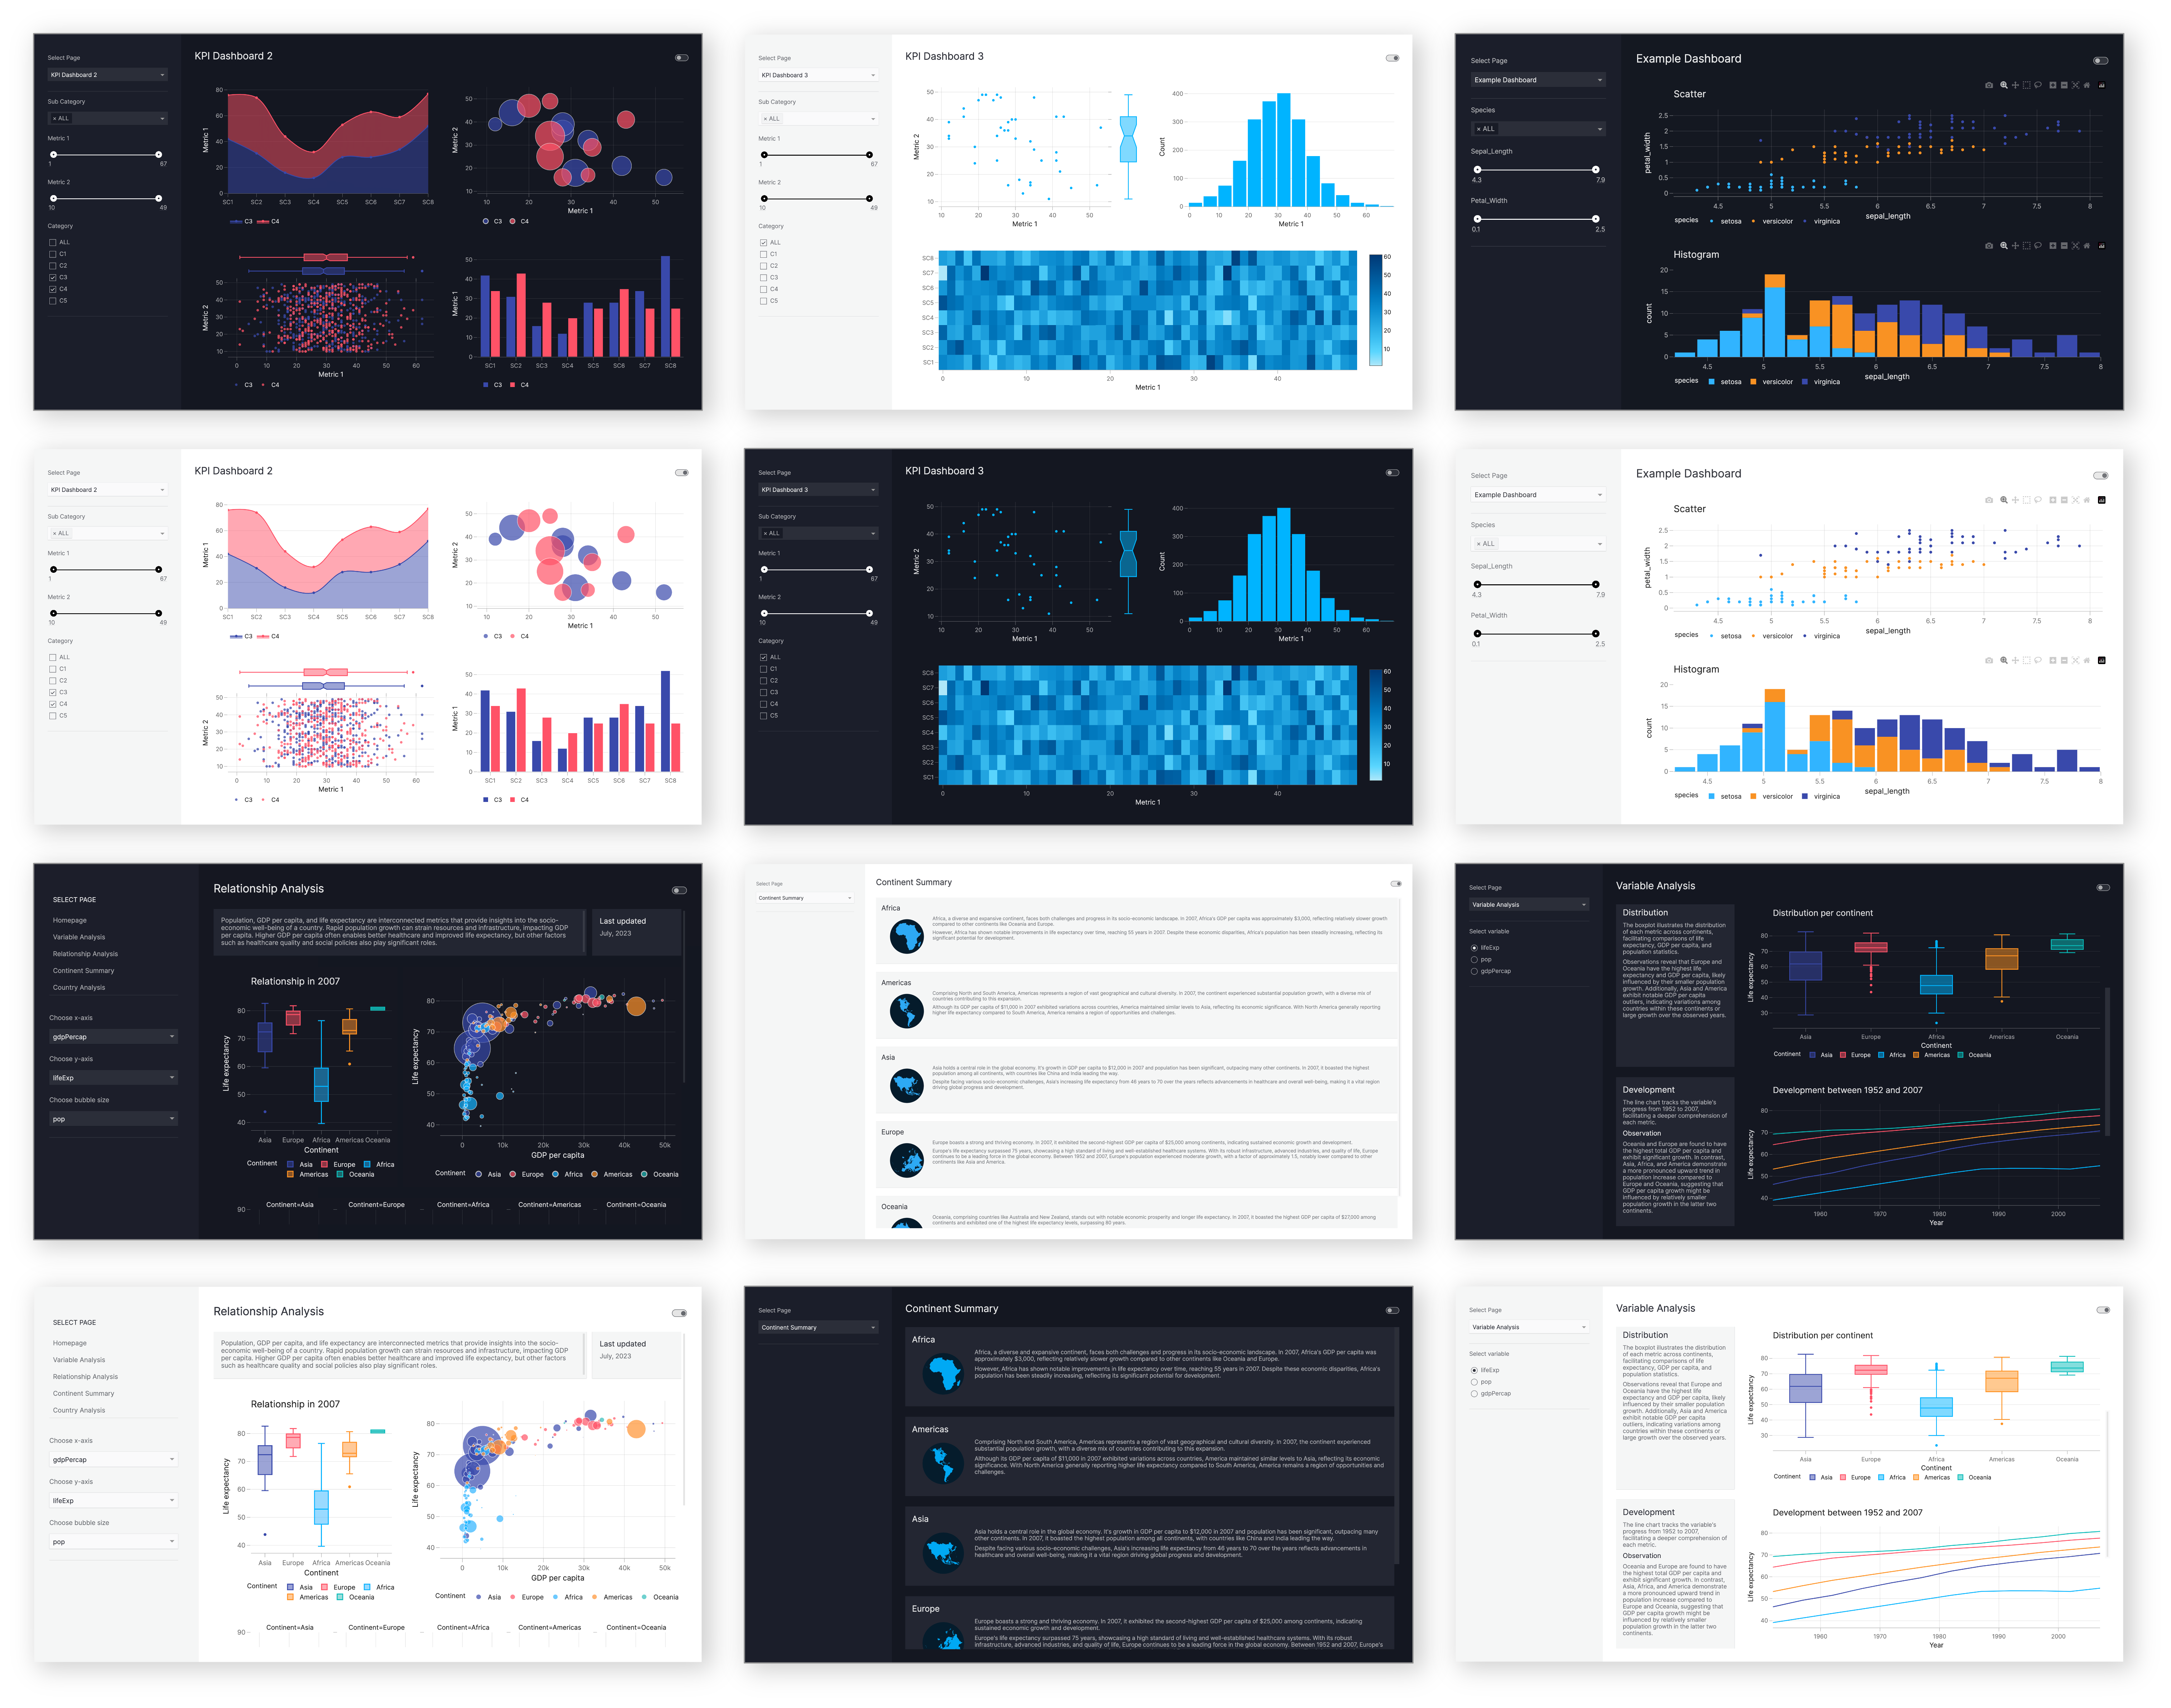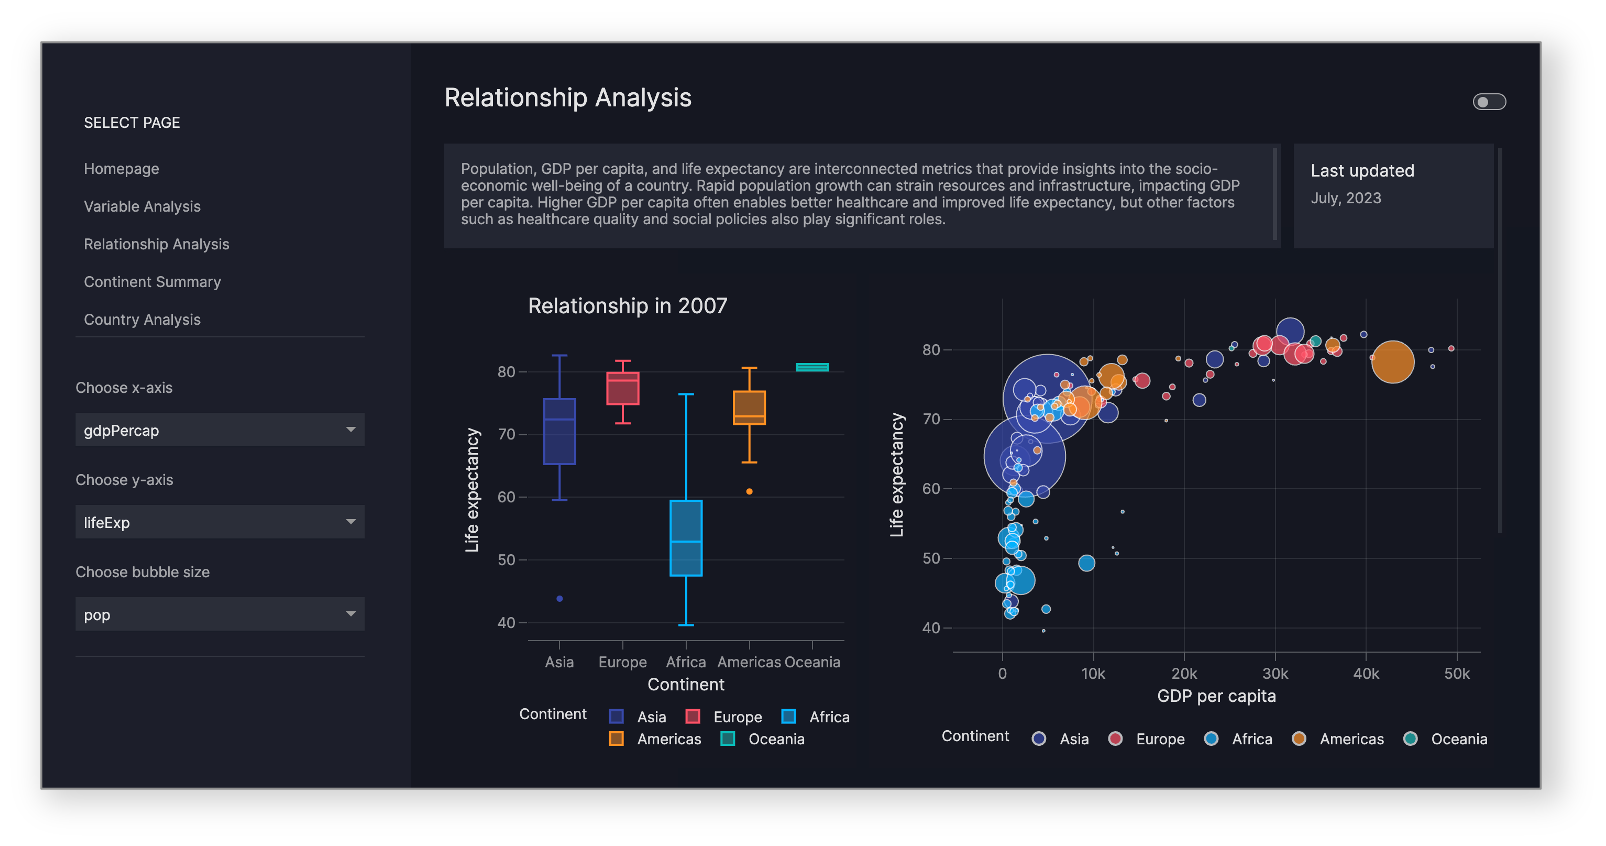
Visual Intelligence. Beautifully engineered
Vizro is a toolkit for creating modular data visualization applications
Rapidly self-serve the assembly of customised dashboards in minutes - without the need for advanced coding or design experience - to create flexible and scalable, Python enabled data visualization applications
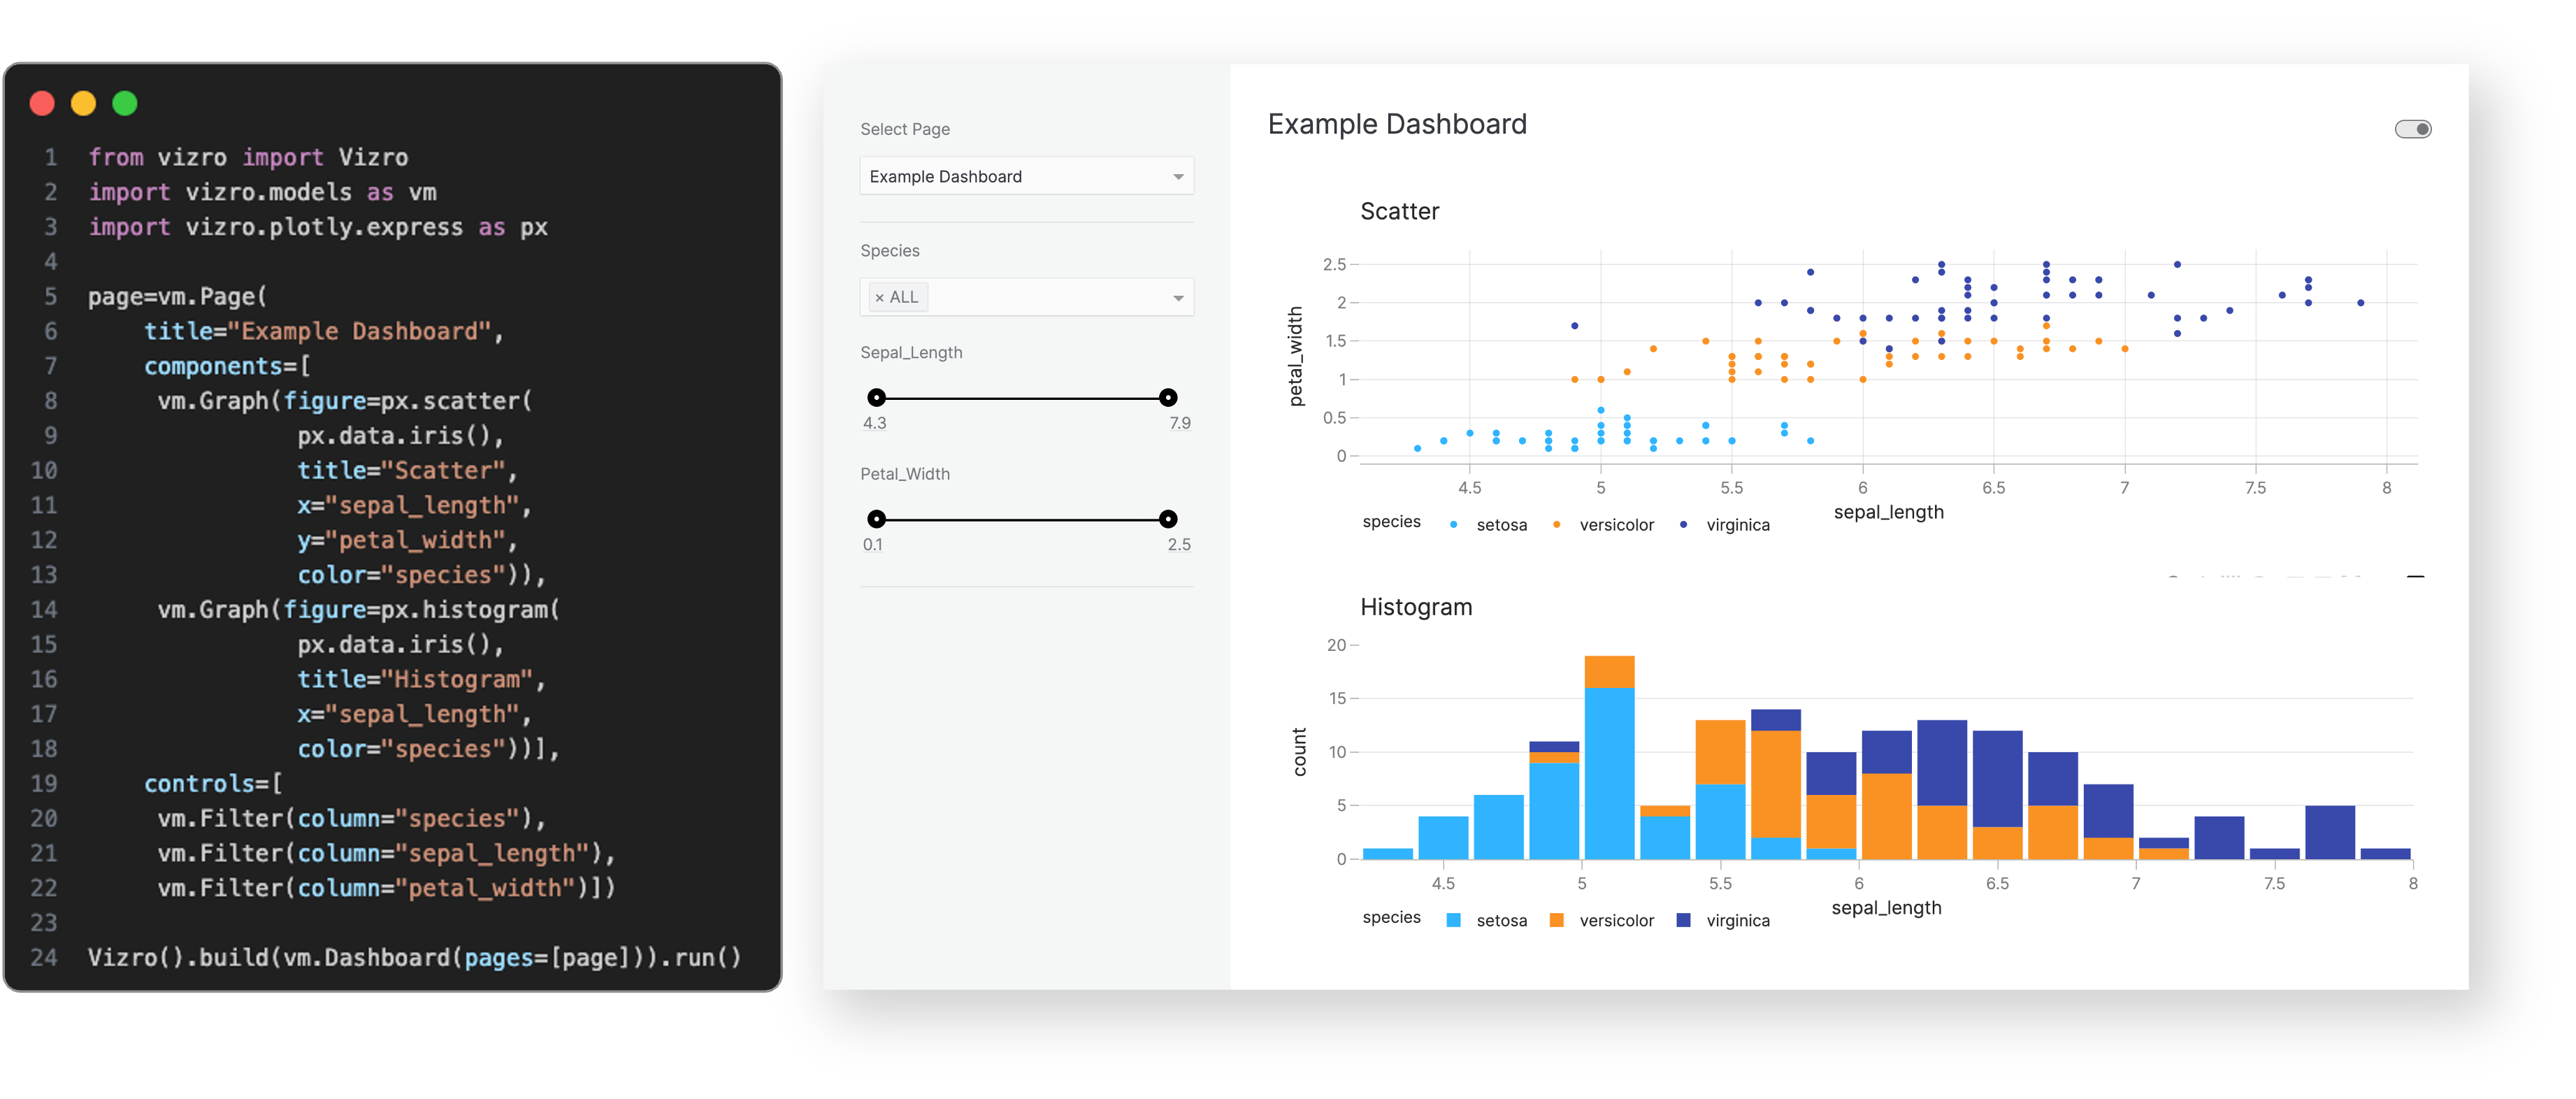
Use a few lines of simple configuration to create complex dashboards, which are automatically assembled utilising libraries such as Plotly and Dash, with inbuilt coding and design best practices
Define high level categories within the configuration, including:
- components: create charts, tables, input/output interfaces, and more
- controls: create filters, parameter inputs, and custom action controllers
- pages, layouts and navigation: create multiple pages, with customisable layouts and flexible navigation across them
- actions and interactions: create interactions between charts, and use pre-defined or customised actions (such as exporting)
Configuration can be written in multiple formats including Pydantic models, JSON, YAML or Python dictionaries for added flexibility of implementation
Optional high-code extensions allow almost infinite customisation in a modular way, combining the best of low-code and high-code - for flexible and scalable, Python enabled data visualization applications
pip install vizroSee the Install guide for more information
Please note this repository is a monorepo and the core vizro package can be found in /vizro-core
See the Tutorials for creating your first dashboard
See the Documentation for more details
We encourage you to ask and answer technical questions via the GitHub Issues. This is also the place where you can submit bug reports or request new features.
To learn more about making a contribution, please see the Contributing Guide for more information
You can also view current and former contributors
Please see our security policy
vizro is distributed under the terms of the Apache License 2.0
