"Vector! That's me, 'cause I'm committing crimes with both direction and magnitude. Oh, yeah!" — "Vector", Despicable Me
Vector is a catalog for vector data. It enables users to store, query, and display vector data — which includes everything from fault lines to thermal anomalies to material spectra.
Formal documentation for this library is available under the Descartes Labs API Documentation. Below is a very simple example to get you started with uploading and querying data to and from Vector.
To start using the Vector client, first import it:
from descarteslabs.vector import Table, TableOptions, models, properties as p
import json
import geopandas as gpd
import ipyleaflet
Next, we can create a Vector Table by executing the following Python code:
class CustomModel(models.PolygonBaseModel):
  name: str

table = Table.create(product_id="my-favourite-shapes", name="My favourite shapes", description="This is just one of my favorite shapes", model=CustomModel)
This product will contain only the most appealing shapes. Vector Tables consist of features, which themselves consist of a geometry and attributes. Let's create a feature that contains a triangle geometry, and give it a name by adding a property:
geojson = {
  "type": "FeatureCollection",
  "features": [
    {
      "type": "Feature",
      "properties": {
        "name": "The coldest lake"
      },
      "geometry": {
        "coordinates": [
          [
            [
              -110.40972704675957,
              54.464841702835145
            ],
            [
              -109.69305293767921,
              54.41100418392534
            ],
            [
              -110.00659786040178,
              54.75020711805794
            ],
            [
              -110.40972704675957,
              54.464841702835145
            ]
          ]
        ],
        "type": "Polygon"
      }
    }
  ]
}
...and then add it to the Vector table we just created by executing the following Python code:
gdf = gpd.GeoDataFrame.from_features(geojson["features"], crs="EPSG:4326")
table.add(gdf)
We can retrieve this feature by querying the product in a few different ways. First, by its name:
table.options.property_filter = p.name == "The coldest lake"
gdf = table.collect()
...and second, by an AOI which intersects with the geometry of our feature. The AOI is defined as a GeoJSON geometry:
# Define the AOI...
aoi = {
  "coordinates": [
    [
      [
        -110.7588318166646,
        54.941440389459956
      ],
      [
        -110.7588318166646,
        54.14613049153121
      ],
      [
        -109.34594259898329,
        54.14613049153121
      ],
      [
        -109.34594259898329,
        54.941440389459956
      ],
      [
        -110.7588318166646,
        54.941440389459956
      ]
    ]
  ],
  "type": "Polygon"
}

# ...and query the product
table.reset_options()
table.options.aoi = aoi
gdf = table.collect()
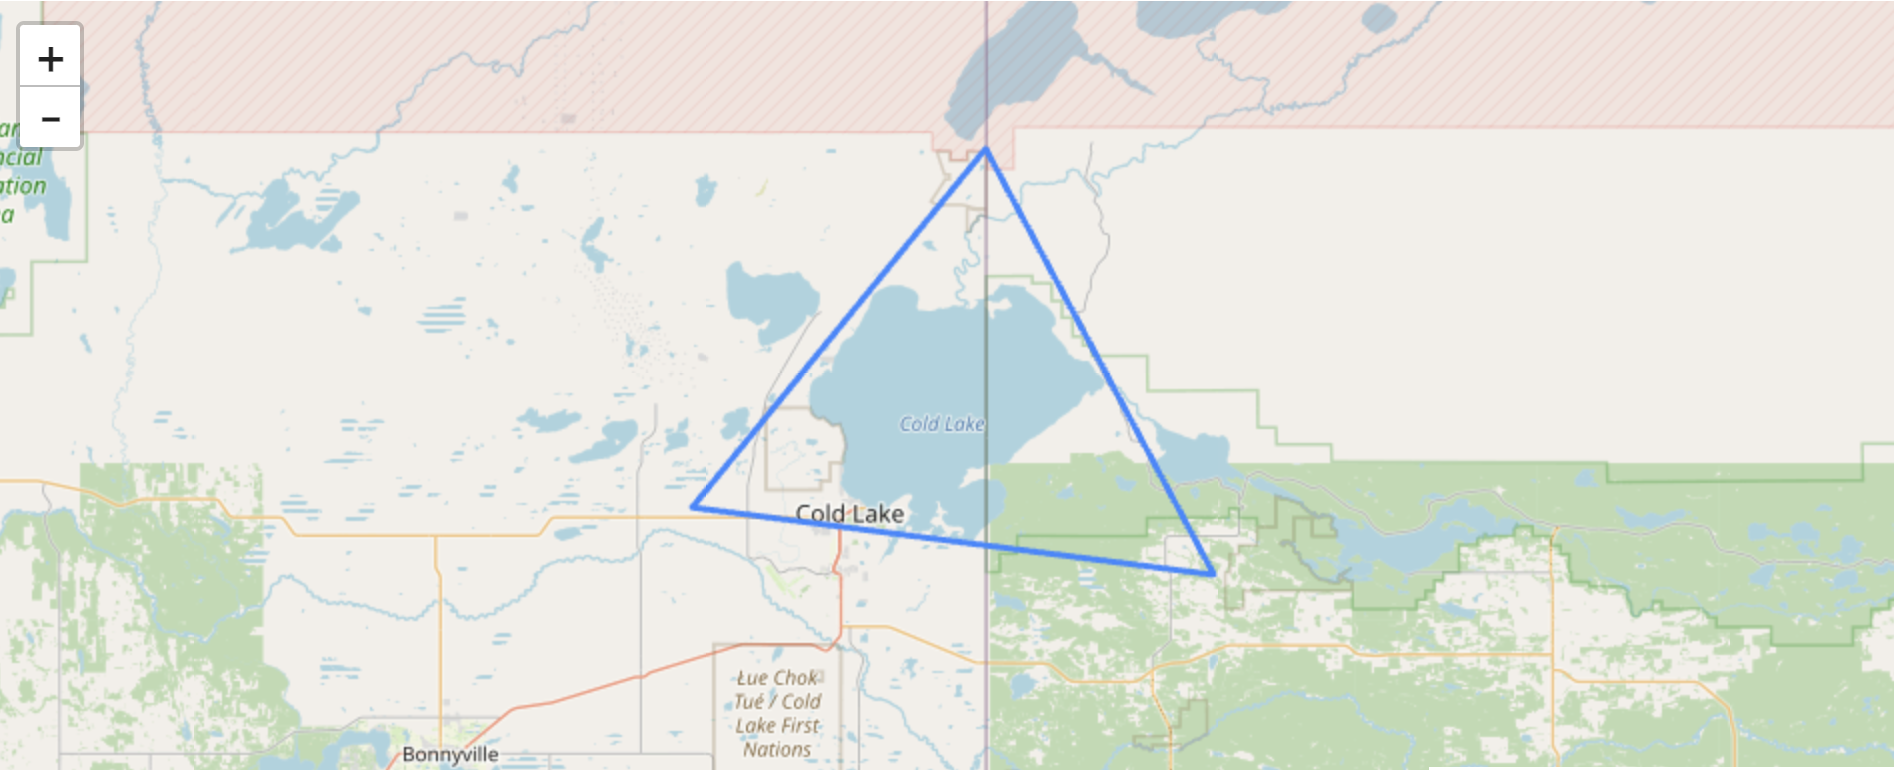
Since, in this case, our feature has a geometry, we can also visualise it on a map! Let's do this now, using ipyleaflet:
# Instantiate and configure the ipyleaflet Map
m = ipyleaflet.Map()
m.center = 54.549829, -110.060936
m.zoom = 9

# Display the map
display(m)

# Visualize the vector tile layer on the map
table.visualize("My favourite shapes", m)
Which should yield the feature we just created, outlining the coldest lake on Earth:
The Vector service also provides for more advanced product and feature management and querying. You can read more about what can be done with Vector in the Descartes Labs API Documentation.
