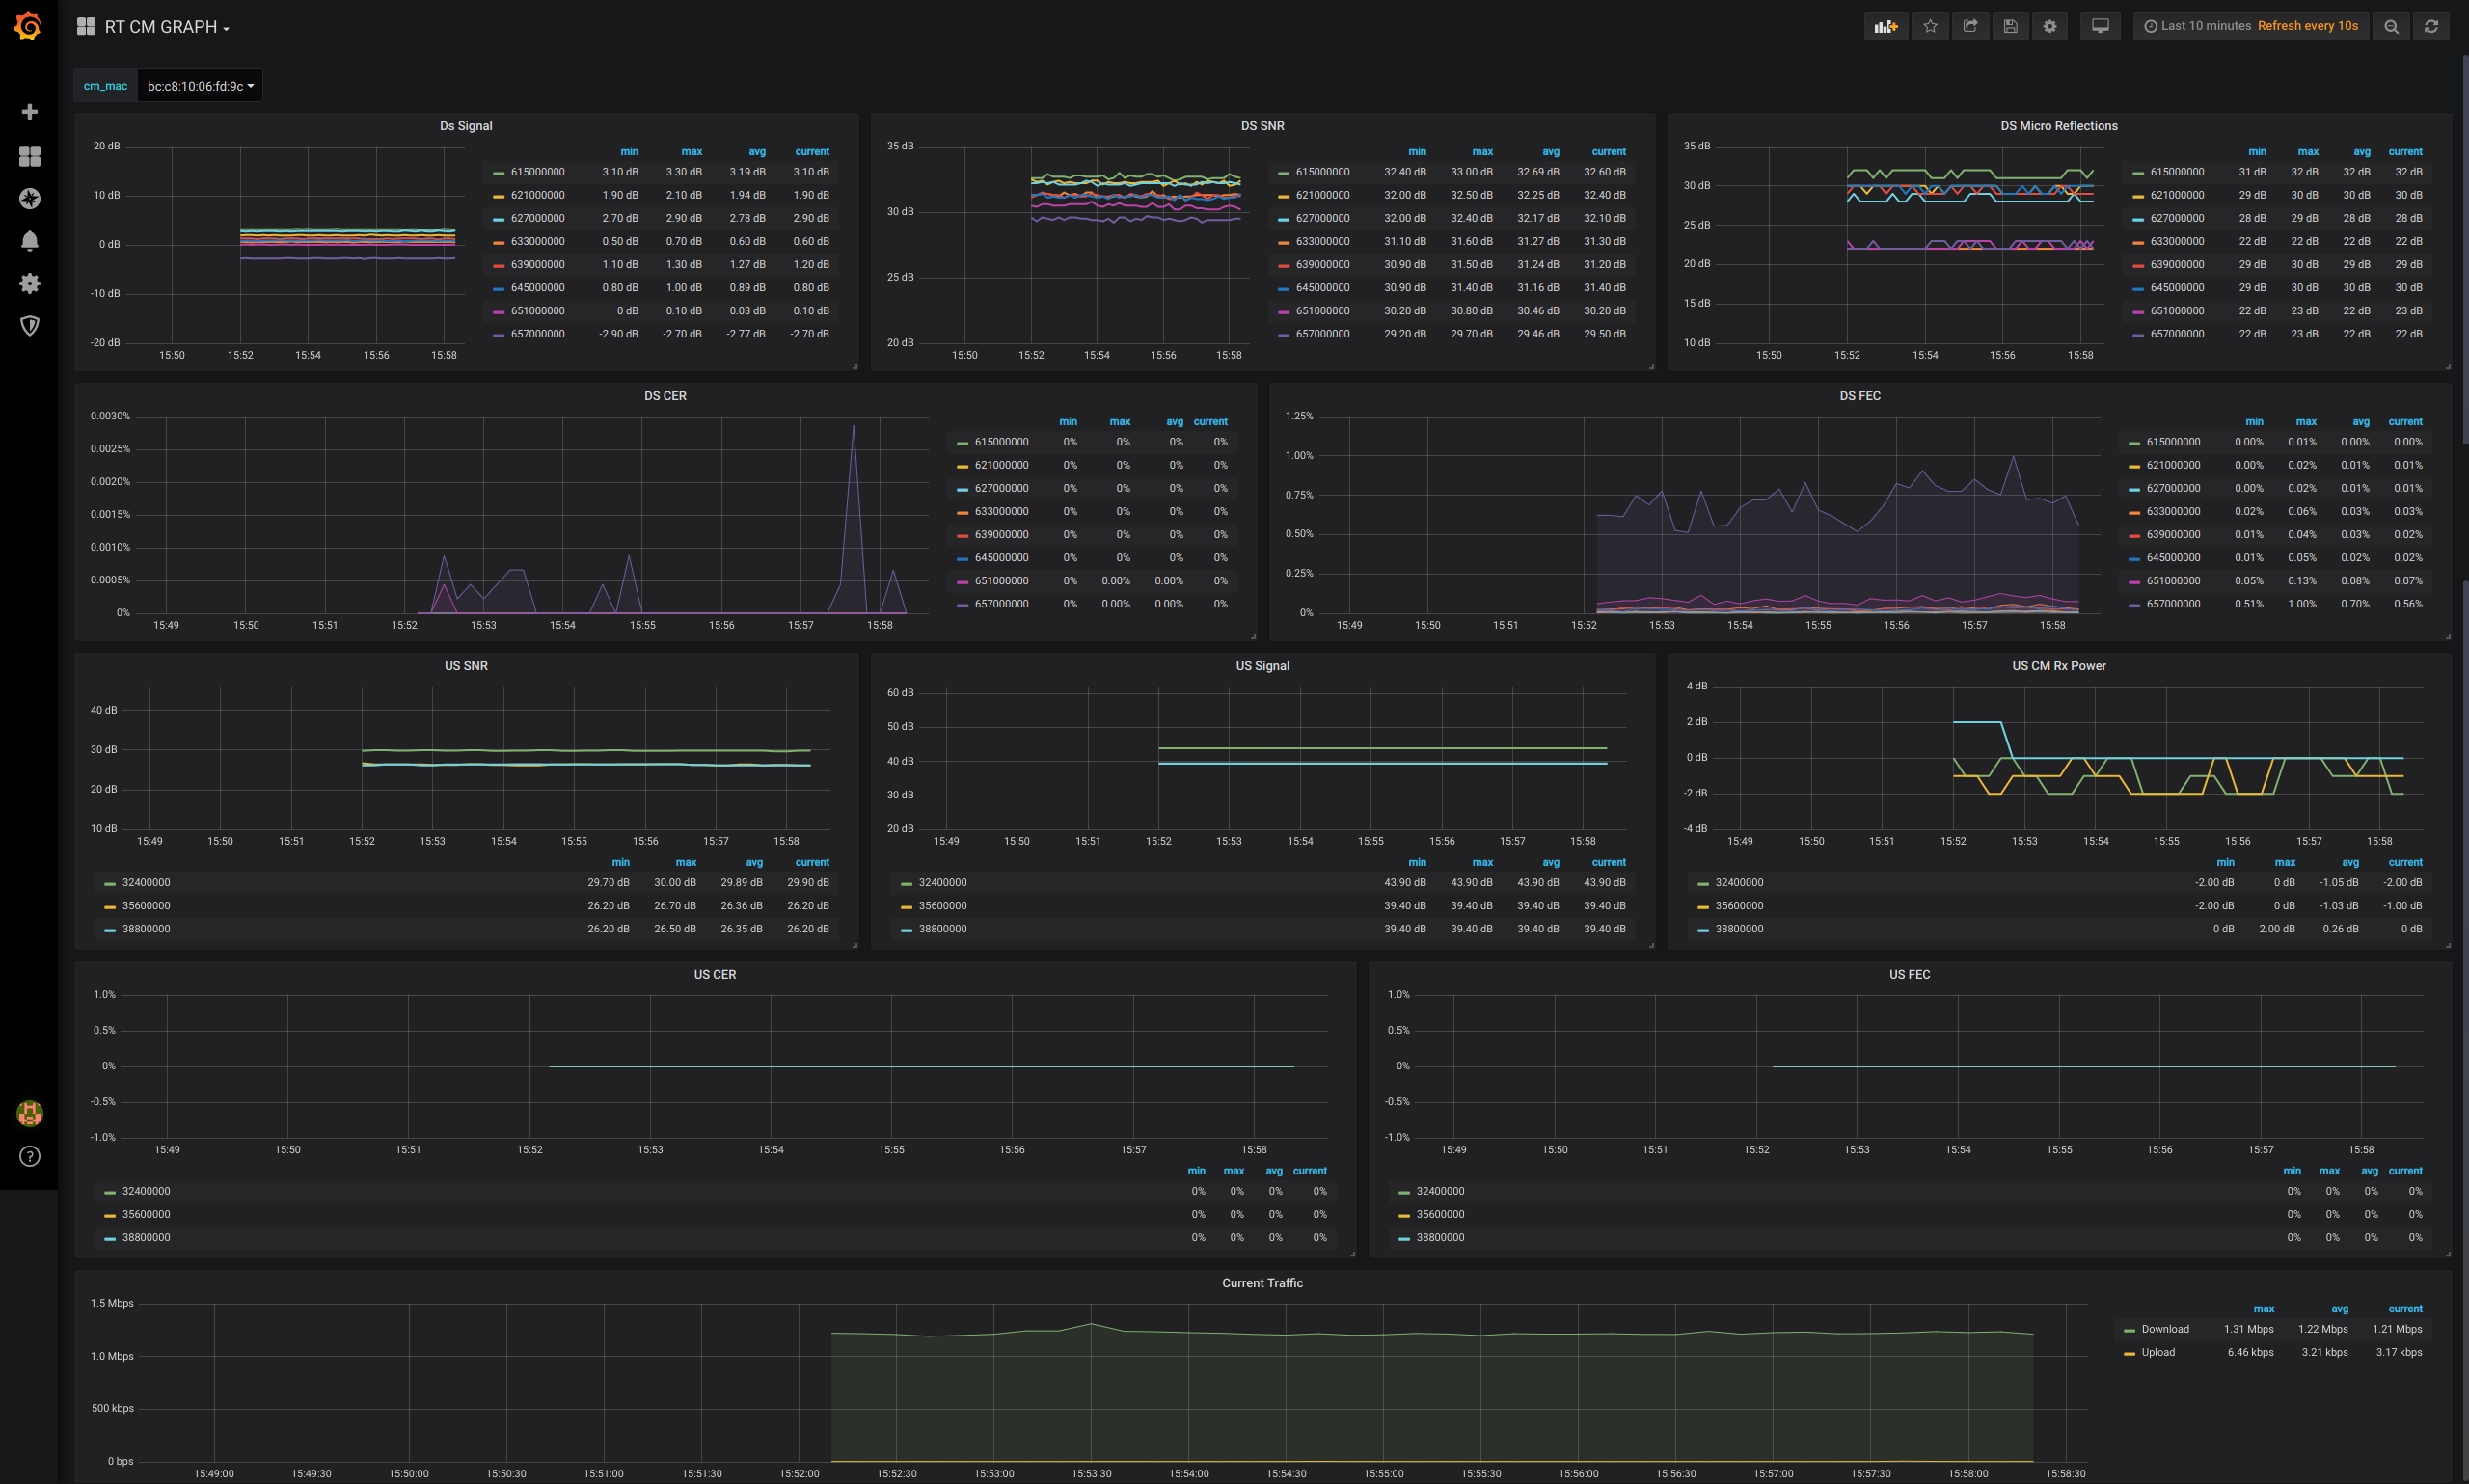
RealTime Cable Modem Graph for Docsis cable modems
Displaying current docsis information about the customer or cable modem is always something you must have an option to look at. This is a real time CM graph running for 5 minutes and refreshing after 10 seconds. It is displaying the following information:
- Downstream Signal
- Downstream Signal To Noise Ratio
- Downstream Micro Reflections
- Downstream Codeword Error Ratio
- Downstream Forward Error Correction
- Upstream Signal
- Upstream Signal To Noise Ratio
- Upstream Cable Modem RX Power
- Upstream Codeword Error Ratio
- Upstream Forward Error Correction
- Current Traffic On Cable Interface
Prerequirements
Installation
sudo su
pip3 install puresnmp
cd /opt
git clone https://github.com/l-n-monitoring/CM-RT-GRAPH.git
chmod +x /opt/CM-RT-GRAPH/telegraf/rtPoller/clearRtCM.sh
chmod +x /opt/CM-RT-GRAPH/telegraf/rtPoller/addRtCM.py
sudo echo "*/1 * * * * root /opt/CM-RT-GRAPH/telegraf/rtPoller/clearRtCM.sh" > /etc/cron.d/rtCheck
Edit cmts.json file and add/change your CMTS(es).
nano /opt/CM-RT-GRAPH/telegraf/rtPoller/templates/cmts.json
[
        {
        "hostname": "10.10.1.8",
        "community": "sadfssda25234563",
        "port": 161,
        "cmCommunity": "352672427643vds!dd"
        },
        {
        "hostname": "10.10.1.9",
        "community": "sadfssda25234563",
        "port": 161,
        "cmCommunity": "352672427643vds!dd"
        }

]
Grafana
Login to your grafana server: http://yourserver.ip:3000/ (admin/admin by default)
Add Data Source
Let's create data source called "telegraf".
Choose green button: Add data source
Save Data Source
Probably influxdb is running on the same server. Database is called "telegraf" and also data source should be called "telegraf".
Import Dashboard
-
Slide over dashboard button and click on "Manage".
-
Click on green button "Upload .json File"
-
Choose RT_CM_GRAPH-GRAFANA.json" located in /opt/CM-RT-GRAPH/telegraf/rtPoller/templates/ and click "Import". " and click "Import".
Add CM To Real Time polling
/opt/CM-RT-GRAPH/telegraf/rtPoller/addRtCM.py 00:22:33:55:33:11
Navigate to http://grafanaip:3000/ choose RT CM GRAPH dashboard and enter cm_mac. Once you'll get the dashboard path you can use direct url. My is http://grafanaip:3000/d/6gm_OtWWk/rt-cm-graph?orgId=1&var-cm_mac=00:22:33:55:33:11. This way you can get direct link.


