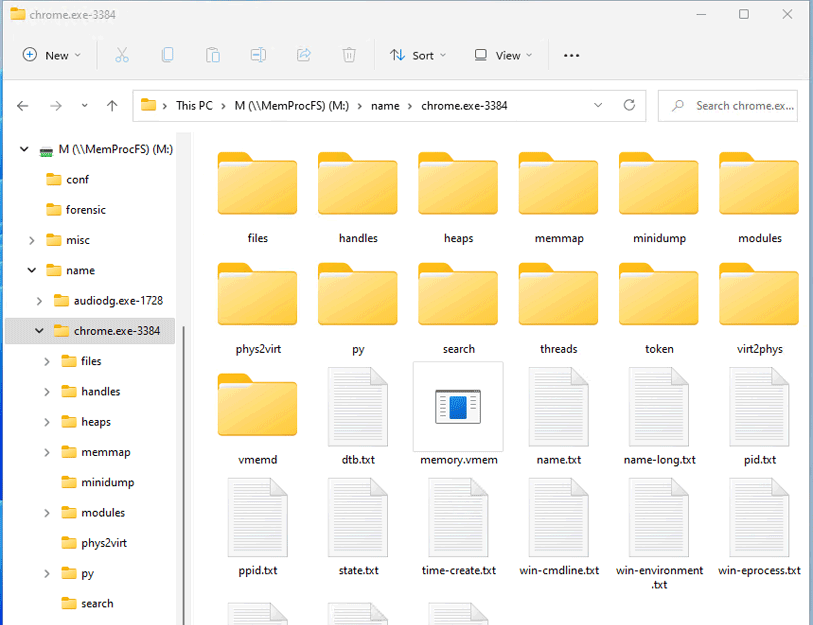
MemProcFS is an easy and convenient way of viewing physical memory as files in a virtual file system.
Easy trivial point and click memory analysis without the need for complicated commandline arguments! Access memory content and artifacts via files in a mounted virtual file system or via a feature rich application library to include in your own projects!
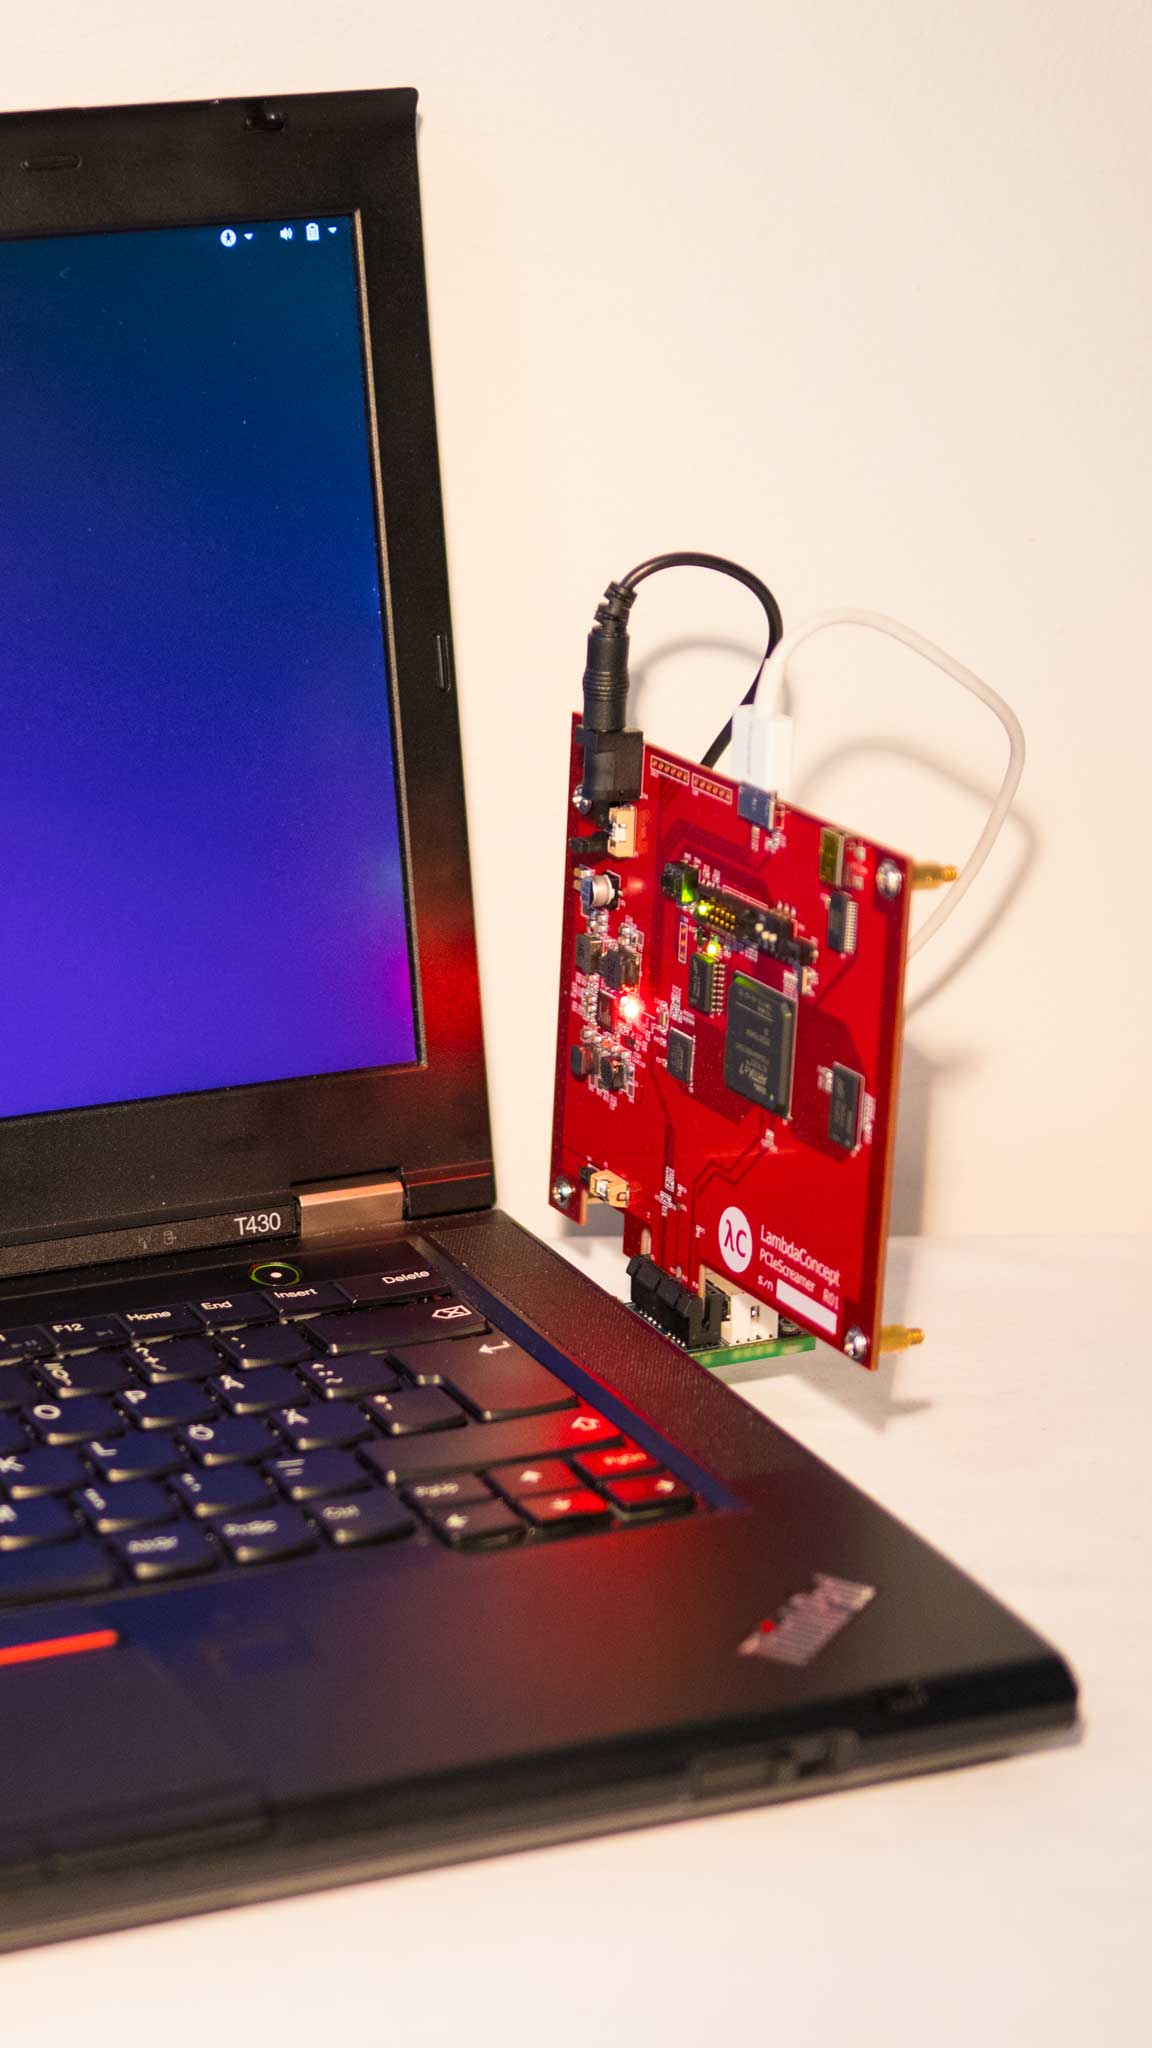
Analyze memory dump files, live memory via DumpIt or WinPMEM, live memory in read-write mode from virtual machines or from PCILeech FPGA hardware devices!
It's even possible to connect to a remote LeechAgent memory acquisition agent over a secured connection - allowing for remote live memory incident response - even over higher latency low band-width connections! Peek into Virtual Machines with MemProcFS, LiveCloudKd or VMware!
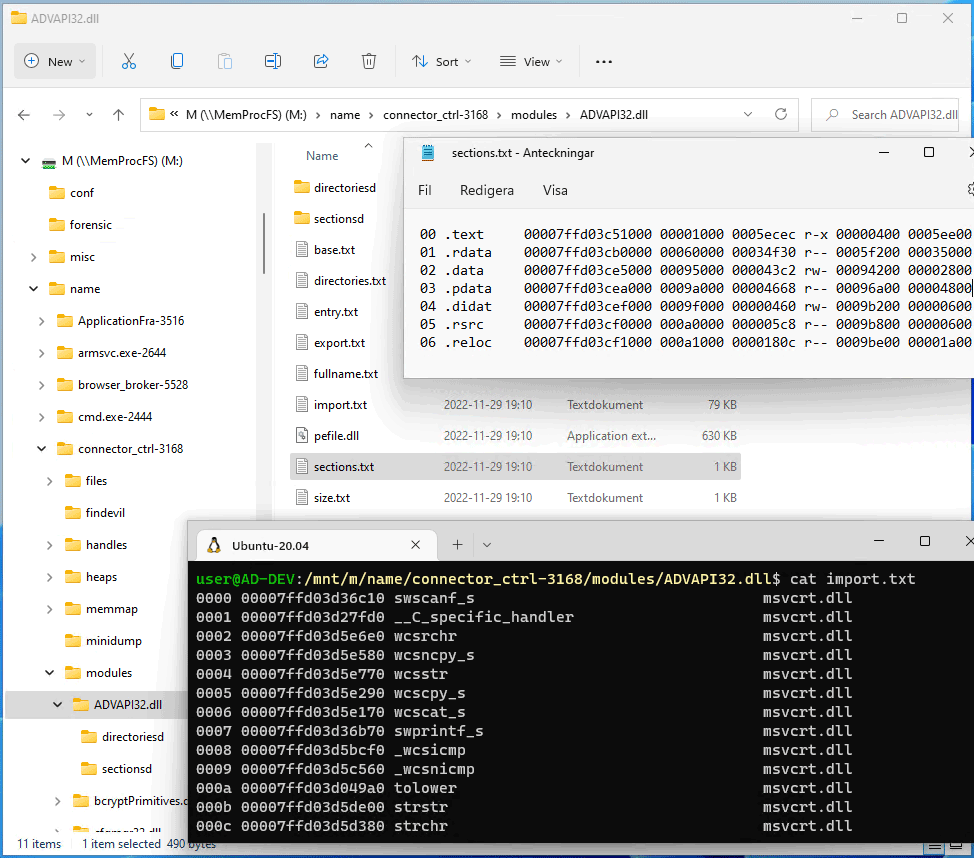
Use your favorite tools to analyze memory - use your favorite hex editors, your python and powershell scripts, WinDbg or your favorite disassemblers and debuggers - all will work trivally with MemProcFS by just reading and writing files!
Check out the excellent quick walkthrough from 13Cubed to get going! Also check out my older conference talks from Disobey and BlueHat.
For additional documentation please check out the project wiki for in-depth detailed information about the file system itself, its API and its plugin modules! For additional information about memory acqusition methods check out the LeechCore project or hop into the #pcileech Discord channel!
To get going clone the sources in the repository or download the latest binaries, modules and configuration files from the releases section and check out the guide.
Get the latest binaries, modules and configuration files from the latest release. Alternatively clone the repository and build from source.
Mounting the file system requires the Dokany file system library to be installed. Please download and install the latest version of Dokany version 2 at: https://github.com/dokan-dev/dokany/releases/latest
To capture live memory (without PCILeech FPGA hardware) download DumpIt and start MemProcFS via DumpIt /LIVEKD mode. Alternatively, get WinPMEM by downloading the most recent signed WinPMEM driver and place it alongside MemProcFS - detailed instructions in the LeechCore Wiki.
PCILeech FPGA will require hardware as well as FTD3XX.dll to be dropped alongside the MemProcFS binaries. Please check out the LeechCore project for instructions.
MemProcFS is dependent on packages, please do a sudo apt-get install libusb-1.0 fuse openssl lz4 before trying out MemProcFS. If building from source please check out the guide about MemProcFS on Linux.
Include MemProcFS in your C/C++, C#, Java, Python or Rust programming projects! Everything in MemProcFS is exposed via an easy-to-use API for use in your own projects! The Plugin friendly architecture allows users to easily extend MemProcFS with C/C++/Rust/Python plugins!
Everything in MemProcFS is exposed as APIs. APIs exist for both C/C++ vmmdll.h, C# vmmsharp.cs, Java, Python pip package and Rust crate. The file system itself is made available virtually via the API without the need to mount it. It is possible to read both virtual process memory as well as physical memory! The example below shows reading 0x20 bytes from physical address 0x1000:
>>> import memprocfs
>>> vmm = memprocfs.Vmm(['-device', 'c:/temp/win10_memdump.raw'])
>>> print(vmm.hex( vmm.memory.read(0x1000, 0x20) ))
0000    e9 4d 06 00 01 00 00 00  01 00 00 00 3f 00 18 10   .M..........?...
0010    00 00 00 00 00 00 00 00  00 00 00 00 00 00 00 00   ................
MemProcFS is available as a Python pip package and it's easy to integrate in your Jupyter Notebooks.
Start MemProcFS from the command line - possibly by using one of the examples below.
Or register the memory dump file extension with MemProcFS.exe so that the file system is automatically mounted when double-clicking on a memory dump file!
- mount the memory dump file as default M:
memprocfs.exe -device c:\temp\win10x64-dump.raw - mount the memory dump file as default M: with extra verbosity:
memprocfs.exe -device c:\temp\win10x64-dump.raw -v - mount the memory dump file as default M: and start forensics mode:
memprocfs.exe -device c:\temp\win10x64-dump.raw -forensic 1 - mount the memory dump file as /home/pi/mnt/ on Linux:
./memprocfs -mount /home/pi/linux -device /dumps/win10x64-dump.raw - mount the memory dump file as S:
memprocfs.exe -mount s -device c:\temp\win10x64-dump.raw - mount live target memory, in verbose read-only mode, with DumpIt in /LIVEKD mode:
DumpIt.exe /LIVEKD /A memprocfs.exe /C "-v" - mount live target memory, in read-only mode, with WinPMEM driver:
memprocfs.exe -device pmem - mount live target memory, in read/write mode, with PCILeech FPGA memory acquisition device:
memprocfs.exe -device fpga -memmap auto - mount a memory dump with a corresponding page files:
memprocfs.exe -device unknown-x64-dump.raw -pagefile0 pagefile.sys -pagefile1 swapfile.sys
Pre-built binaries, modules and configuration files are found in the latest release.. MemProcFS binaries are built with Visual Studio 2022 and Ubuntu x64/AARCH64.
Detailed build instructions may be found in the Wiki in the Building section.
The project source code is released under: GNU Affero General Public License v3.0. Some bundled dependencies and plugins are released under GPLv3. Some bundled Microsoft redistributable binaries are released under separate licenses. Alternative licensing may be possible upon request.
PCILeech, MemProcFS and LeechCore are open source but not open contribution. PCILeech, MemProcFS and LeechCore offers a highly flexible plugin architecture that will allow for contributions in the form of plugins. If you wish to make a contribution, other than a plugin, to the core projects please contact me before starting to develop.
- Twitter:
- Discord:
- PCILeech: https://github.com/ufrisk/pcileech
- PCILeech FPGA: https://github.com/ufrisk/pcileech-fpga
- LeechCore: https://github.com/ufrisk/LeechCore
- MemProcFS: https://github.com/ufrisk/MemProcFS
- YouTube: https://www.youtube.com/channel/UC2aAi-gjqvKiC7s7Opzv9rg
- Blog: http://blog.frizk.net
- MemProcFS-Analyzer: https://github.com/evild3ad/MemProcFS-Analyzer
PCILeech and MemProcFS is free and open source!
I put a lot of time and energy into PCILeech and MemProcFS and related research to make this happen. Some aspects of the projects relate to hardware and I put quite some money into my projects and related research. If you think PCILeech and/or MemProcFS are awesome tools and/or if you had a use for them it's now possible to contribute by becoming a sponsor!
If you like what I've created with PCIleech and MemProcFS with regards to DMA, Memory Analysis and Memory Forensics and would like to give something back to support future development please consider becoming a sponsor at: https://github.com/sponsors/ufrisk
To all my sponsors, Thank You 💖
Previous releases (click to expand):
v1.0
- Initial Release.
v1.1-v4.9
- Various updates. Please see individual relases for more information.
- Major release with new features to support parallel analysis tasks.
- Breaking API changes and major updates.
- Extended forensic analysis capabilties and CSV file support.
- Linux plugin support.
- New Java API.
- Support for Windows 11 22H2.
- Text & Binary-only views at '/misc/view/'.
- Bug fixes.
- Virtual Machine support.
- ARM64 Windows support.
- FPGA performance improvements.
- Device tree information in /sys/drivers.
- Linux feature additions: memcompress and token.
- Manual download of debug symbols (PDBs) on offline systems (Windows only).
- Bug fixes and performance optimizations.
- PE forwarded functions.
- PE version information.
- MemProcFS Python batch mode.
- Linux Python plugin support.
- Hyper-V Container/Sandbox support.
- Windows Hypervisor Platform support (VMware and VirtualBox on Hyper-V).
- Rust API support.
- Debug symbol support when running on Linux.
- Findevil: New thread-based detections. Findevil is now forensic mode only.
- Jupyter Notebook example
- Yara support in forensics mode and search.


