

Abstract
The master circadian pacemaker located within the suprachiasmatic nuclei (SCN) controls neural and neuroendocrine rhythms in the mammalian brain. Astrocytes are abundant in the SCN, and this cell type displays circadian rhythms in clock gene expression and extracellular accumulation of ATP. Still, the intracellular signaling pathways that link the SCN clockworks to circadian rhythms in extracellular ATP accumulation remain unclear. Because ATP release from astrocytes is a calcium-dependent process, we investigated the relationship between intracellular Ca2+ and ATP accumulation and have demonstrated that intracellular Ca2+ levels fluctuate in an antiphase relationship with rhythmic ATP accumulation in rat SCN2.2 cell cultures. Furthermore, mitochondrial Ca2+ levels were rhythmic and maximal in precise antiphase with the peak in cytosolic Ca2+. In contrast, our finding that peak mitochondrial Ca2+ occurred during maximal extracellular ATP accumulation suggests a link between these cellular rhythms. Inhibition of the mitochondrial Ca2+ uniporter disrupted the rhythmic production and extracellular accumulation of ATP. ATP, calcium, and the biological clock affect cell division and have been implicated in cell death processes. Nonetheless, rhythmic extracellular ATP accumulation was not disrupted by cell cycle arrest and was not correlated with caspase activity in SCN2.2 cell cultures. Together, these results demonstrate that mitochondrial Ca2+ mediates SCN2.2 rhythms in extracellular ATP accumulation and suggest a role for circadian gliotransmission in SCN clock function.
Introduction
Intercellular communication within neural networks of the suprachiasmatic nucleus (SCN) is integral to the master circadian pacemaker properties of this hypothalamic structure. A fundamental property of this circadian pacemaker is that SCN cells generate and sustain ensemble cellular rhythms independently of external input (Lee et al., 2003). Circadian oscillations are especially prevalent in the SCN among core components of the feedback loops that comprise the molecular clockworks. Period1 (Per1), Per2, Bmal1, cryptochrome 1 (Cry1), Cry2, and Rev-erbα are core clock genes whose expression in the SCN is rhythmically regulated through mutual interactions in these molecular feedback loops (Shearman et al., 2000). In turn, the molecular clockworks impose circadian rhythmicity on other intracellular processes and specific SCN output signals, of which some are thought to provide for the local coordination of timekeeping among cell-autonomous circadian clocks in the SCN. Circadian rhythms of extracellular ATP accumulation in the SCN may represent an important output signal for the local coordination of time among populations of SCN clock cells (Womac et al., 2009).
At present, the intracellular signaling pathways responsible for linking molecular components of the SCN clockworks to rhythms in ATP accumulation remain unclear. Intracellular Ca2+ signaling has been implicated as a key messenger linking the core clock mechanism to downstream physiological oscillations in SCN neurons (Honma and Honma, 2003; Ikeda, 2004; Welsh et al., 2010). For example, cytosolic free Ca2+ concentration is marked by diurnal and circadian fluctuations in SCN neurons (Colwell, 2000; Ikeda et al., 2003; Irwin and Allen, 2009). Calcium signaling is a key regulator of diverse cellular processes, including mitochondrial ATP production (Griffiths and Rutter, 2009).
Because the SCN is enriched with a large population of astrocytes and this glial cell type is capable of calcium-dependent ATP release (Guthrie et al., 1999), it is possible that cytosolic and/or mitochondrial Ca2+ may play an important role in the clock control of extracellular ATP accumulation. To test this hypothesis, the present experiments were conducted in vitro using an immortalized line of rat SCN cells (SCN2.2), which retains the endogenous rhythm-generating and pacemaker properties of the SCN in situ (Allen et al., 2004). Similar to the cellular composition of the rat SCN, the SCN2.2 line consists of a heterogeneous population of neural cells, including a large number of astrocytic cells. Consequently, we first examined both cytosolic and mitochondrial Ca2+ concentrations in SCN2.2 cells for evidence of time-dependent differences and their relationship to the rhythmic pattern of extracellular ATP accumulation. In conjunction with these experiments, we also determined whether pharmacological disruption of cytosolic or mitochondrial Ca2+ signaling alters circadian fluctuations in extracellular ATP levels in SCN2.2 cells. Because Ca2+ signaling, ATP, and the circadian clock have been linked to cell cycle and cell death processes (Baran, 1996; Marcussen and Larsen, 1996; Gery et al., 2006; Hajnóczky et al., 2006), a series of experiments was conducted to examine the potential influence of cell cycle and cell death processes on the temporal pattern of extracellular ATP accumulation.
Materials and Methods
General SCN2.2 cell culture.
SCN2.2 cell cultures were derived from fetal progenitors of the rat SCN (E15) immortalized with the adenovirus E1A gene (Earnest et al., 1999). Cells derived from the same passage for a given experiment (passage numbers 10–20 from the founding immortalized cells) were cultured on laminin-coated dishes (60 mm; Corning) and maintained at 37°C and 5% CO2 in minimum essential medium (Invitrogen), supplemented with 10% FBS (Hyclone), glucose (3000 μg/ml), l-glutamine (292 mg/ml), and 1% penicillin/streptomycin/neomycin antibiotic (Invitrogen) under constant temperature (37°C) and 5% CO2 conditions. During cell propagation, the medium was changed at 48 h intervals, and cultures were split every 2–3 d. Unless otherwise described, experimental cells were subcultured in Neurobasal medium for all ATP accumulation and Ca2+ imaging assays.
Heterogeneity of SCN2.2 cell cultures.
SCN2.2 cells were plated on poly-d-lysine- and laminin-coated, two well Nunc glass chamber slides (Thermo Fisher Scientific), and multiple imaging approaches were used to assess the diversity of cell types. Cell cultures were stained with 300 nm DAPI, a fluorescent marker of cell nuclei (Sigma), to determine total cell counts. Morphological characteristics (small spherical somata and elongated processes) and calcein-AM fluorescence that primarily localizes in neurons were used to estimate that 10.6 ± 3.1% (mean ± SD) of SCN2.2 cells are neuronal. This neuronal estimate is consistent with previous observations on the proportion of SCN2.2 cells that express immunoreactivity for neuron-specific antigens or SCN neuropeptides such as arginine vasopressin peptide and VIP (Earnest et al., 1999). Although some variability in the expression of astroglial markers has been observed previously in this cell line (Earnest et al., 1999), a stable portion of the SCN cells used here were GFAP-immunopositive. Briefly, cultures were fixed with 4% paraformaldehyde, washed with PBS, and incubated in a rabbit anti-GFAP antibody (1:100; Sigma) in blocking solution (10% fetal goat serum, 1% Triton-X in PBS) for 24 h at 4°C. After permeabilization and washes, cells were incubated in a goat anti-rabbit IgG (whole molecule)-TRITC secondary antibody (1:100; Sigma) in blocking solution for 3 h at 4°C. Immunofluorescence images were captured using a CoolSnapHQ2 camera (Actimetrics) and SimplePCI 6.0 imaging software (Compix). We estimated that 79.8 ± 5.5% of SCN2.2 cultures are astrocytic cells. Finally, it is estimated that the remaining 9.5% of SCN cells represent other cells types, of which some are presumably fibroblasts based on their large and flat morphology.
Experiment 1: Temporal profile of ATP production in SCN2.2 cultures.
SCN2.2 cultures were subcultured from 10% FBS medium onto poly-d-lysine- and laminin-coated, two well Nunc glass chamber slides (Thermo Fisher Scientific) in 5% FBS medium for Ca2+ imaging. Time point 0 (T0) denotes when this transfer occurred. Twenty-four hours later (T24), the 5% FBS medium was removed, and cultures were subjected to rinses and replacement with Neurobasal medium. Cells were loaded with Fura-2 AM, and imaging studies were conducted in Neurobasal medium (see Calcium imaging). Resting Ca2+ levels were determined at T40 and T50 time points, and media samples were collected immediately before Ca2+ imaging for chemiluminescent determination of extracellular ATP accumulation (see Extracellular ATP accumulation assay). The time course of extracellular ATP accumulation and intracellular Ca2+ changes were determined using Fluo-4-AM for Ca2+ imaging, and media samples were taken to obtain extracellular ATP levels. Cytoplasmic Ca2+ and extracellular ATP were monitored at 1 h time points for 12 h between T38 and T50, assuring capture of at least one peak and one trough of each.
Experiment 2: Analysis and manipulation of calcium signaling.
SCN2.2 cultures were subcultured to coated, glass chamber slides as described for experiment 1. Cells were loaded with either Fluo-4 AM or rhodamine (Rhod)-2 AM at T40 and T50 time points for cytosolic and mitochondrial Ca2+ imaging, respectively (see Calcium imaging). Media samples were collected immediately before Ca2+ imaging for extracellular ATP chemiluminescence analysis. The Ca2+ chelator BAPTA-AM (8 μm; Invitrogen), the sarco/endoplasmic reticulum Ca2+ ATPase inhibitor thapsigargin (THAPS; 1 μm; Sigma), and the specific mitochondrial Ca2+ uptake inhibitor Ru360 (2 μm; Sigma) were each added to separate SCN2.2 cell cultures at T24 to manipulate Ca2+ signaling pathways. Extracellular ATP levels at T40 and T50 time points were determined by chemiluminescence assay.
Experiment 3: Analysis of ATP accumulation during cell cycle arrest.
SCN2.2 cultures were subcultured to laminin-coated 60 mm dishes as described above. Pharmacological disruption of the cell cycle was accomplished with the inhibitor AraC, an anticancer drug that prevents cell division (100 μm; Sigma). AraC was added to cell cultures at both T24 and T48 to assure continued block of cell division. Media samples were collected every 4 h for 72 h, and extracellular ATP levels were quantified using chemiluminescence assays. Further studies were conducted to confirm AraC disruption of cell division. SCN2.2 cultures were subcultured to coated glass chamber slides as described above (experiment 1). AraC was then added at T24, and medium samples were collected from separate cultures at T40 and T50. Cell cultures were stained with 300 nm DAPI for 5 min in Neurobasal medium at 37°C in 5% CO2. Microscopic analysis was conducted, and fluorescence images were captured using an Olympus IX70 inverted microscope (20× plan objective). Images were acquired using a CoolSnapHQ2 camera (Actimetrics), and random fields of cells were selected and designated as ROIs for analysis using SimplePCI 6.0 imaging software (Compix). Differential interference contrast and DAPI fluorescence microscopy were combined for quantitative analysis of cell counts (number of DAPI nuclei per random ROI) and qualitative analysis of cell size in AraC-treated and control cultures.
Experiment 4: Analysis of cell death in SCN2.2 cell cultures.
SCN2.2 cultures were subcultured to coated glass chamber slides as described above. To quantify caspase activity, a CaspaTag pan-caspase in situ assay kit (Millipore) was used to fluorescently label active caspase 7. SCN2.2 cells were treated with a fluorochrome inhibitor of caspase (FLICA), a cell-permeable, carboxyfluorescein-labeled inhibitor that covalently binds active caspase. ATP accumulation was analyzed via medium sample chemiluminescence assay, and caspase activity was assessed. In separate cultures at T40 and T50, media samples were collected for determination of ATP accumulation, and caspase activity was assessed after FLICA incubation for 1 h. After four to five washes with Neurobasal medium, SCN2.2 cultures were stained with DAPI, and a total cell count was established as described by experiment 3. Additionally, the number of caspase (FLICA)-positive cells was counted. The number of caspase-positive cells divided by the number of DAPI-positive cells was used to establish an index of apoptotic activity at both time points.
Extracellular ATP accumulation assay.
Extracellular ATP levels in media samples were quantified using a TopCount luminometer-based assay similar to that described previously (Womac et al., 2009). Media samples were snap-frozen in liquid nitrogen and stored at −80°C until subsequent analysis of ATP accumulation. Cell-free chemiluminescence assays of extracellular ATP levels were performed by incubating aliquots (100 μl) of thawed media samples with 1 μl of luciferase and 2 μl of luciferin in wells of a black 96 well plate (Thermo Fisher Scientific). ATP-dependent chemiluminescent activity produced by media samples was measured in constant darkness using a multiplate Packard TopCount scintillation counter. ATP-dependent chemiluminescence was calibrated relative to assay standards, ranging from 1 pm to 100 nm ATP. Internal controls consisting of medium without ATP, luciferase, or luciferin were included on all analyzed plates. Based on the repeated analysis of the same samples across multiple assays, interassay variation in the determination of ATP levels was <10%. ATP assays containing FBS exhibited a serum-derived suppression of chemiluminescence (data not shown). Therefore, all ATP analyses were conducted on cultures maintained in serum-free medium. For analysis and representation of rhythmicity between the trough (T40) and peak (T50) time points of the extracellular ATP accumulation rhythm, a chemiluminescence peak-to-trough ratio (CP/T) was calculated as the chemiluminescence intensity at the ATP peak time point divided by the intensity at the ATP trough time point.
Calcium imaging.
SCN2.2 cell cultures were loaded with cell-permeant acetoxymethyl esters of cytosolic Ca2+-sensitive dyes, either 4 μm Fluo-4 AM or 8 μm Fura-2 AM (Invitrogen), in Neurobasal medium for 1 h at 37°C in 5% CO2. After the cells were rinsed six to seven times with Neurobasal medium, Ca2+ imaging was conducted at room temperature with an Olympus IX70 inverted microscope (20× Fura-UV objective). Images of fields of cells were acquired using a CoolSnapHQ2 camera (Actimetrics). ROIs with cells (not including the nucleus) were selected for analysis using SimplePCI 6.0 imaging software (Compix). All cells in an image were analyzed for resting calcium level. For monochromatic imaging with Fluo-4 AM, an excitation wavelength of 490 nm was used, and single fluorescence images were captured. For ratiometric Fura-2 AM imaging, image pairs were captured after 340 and 380 nm excitation, and background-subtracted fluorescence ratios were calculated. Estimated intracellular Ca2+ concentrations ([Ca2+]i) were calculated using conventional methods. Pseudo-colored images were created using spectral color values assigned to fluorescence ratios of each image by the SimplePCI software (Peters et al., 2005).
For mitochondrial Ca2+ imaging, SCN2.2 cells were loaded with 8 μm Rhod-2 AM (Invitrogen) in Neurobasal medium for 1 h at 37°C in 5% CO2. After the cells were rinsed with Neurobasal medium, mitochondrial Ca2+ imaging was conducted at room temperature with an excitation wavelength of 550 nm. Calcium-dependent (Rhod-2) fluorescent emission imaging was conducted and analyzed as described above for cytosolic Ca2+ using SimplePCI 6.0 imaging software (Compix).
Mitochondrial calcium localization studies were performed using MitoTracker (MitoT) and Rhod-2 AM. SCN2.2 cells were plated to glass chamber slides as described above and grown to confluence. Cells were loaded with 100 nm MitoT Green FM (Invitrogen), a specific mitochondrial marker, and 8 μm Rhod-2 AM (Invitrogen) in Neurobasal media at 37°C in 5% CO2. Cells were incubated with both probes for 30 min, and then cultures were washed with Neurobasal media and imaged using fluorescence microscopy and image analysis techniques as described above.
Statistical analysis.
Paired and pooled t tests were performed to determine whether peak levels of calcium or ATP were significantly different from trough values. The α value was set at 0.05 for all statistical analyses. In graphical representations of time-series experiments, either specific ATP or calcium data points were plotted or data were presented as smoothed lines after conversion using the SPSS statistical smoothing algorithm.
Results
Rhythms in cytosolic calcium and ATP accumulation
ATP rhythmically accumulates in the medium of SCN2.2 cell cultures and in the extracellular fluid of the rat SCN in vivo, each with periodicities of ∼24 h that persist in constant conditions (Womac et al., 2009). In the current studies, SCN2.2 cell cultures also exhibited robust rhythms in ATP accumulation, with trough and peak time points occurring at ∼12 h intervals as determined from medium samples (Fig. 1A). Although the phase relationships of these peak and trough ATP levels were variable from experiment to experiment, they occurred at consistent time points when using parallel cultures derived from a single passage and handled identically. Under these conditions, ATP chemiluminescence in SCN cultures (n = 6 cultures per time point) was significantly different (p < 0.05) between trough (T40) and peak (T50) time points (Fig. 1B), with extracellular ATP concentration estimated at 1–5 pm and 5–10 nm at the trough and peak time points, respectively. A chemiluminescence peak-to-trough ratio (CP/T) calculated from this dataset indicated an ATP accumulation amplitude difference of 2.3-fold.

Rhythms in cytosolic calcium and ATP accumulation are antiphasic. A, An ATP chemiluminescence rhythm is illustrated for a representative SCN2.2 culture. Medium was sampled every 2 h for luciferin/luciferase assays. Labels indicate trough and peak time points of T40 and T50 in these cultures. B, Parallel cultures from the same cell passage had phase-locked ATP rhythms with a significant difference in ATP-dependent chemiluminescence between T40 (Trough ATP) and T50 (Peak ATP) time points (*p < 0.05; n = 6 cultures per time point). The magnitude of the chemiluminescence peak-to-trough ratio (CP/T) was calculated as 2.3 ± 0.7 across these six cultures, indicating a robust ATP rhythm. Error bars represent 95% confidence intervals. C, D, Representative pseudocolor images of resting [Ca2+]i in cultures loaded with 8 μm Fura-2 AM at ATP trough and ATP peak time points. The scale bar in D equals 10 μm. E, Cytosolic Ca2+ levels were significantly different at the ATP trough and the ATP peak time point across an experimental set of SCN2.2 cultures (*p < 0.05; n = 4 cultures per time point; CP/T = 2.2 ± 0.5). Error bars represent 95% confidence intervals. F, The time course of extracellular ATP (as determined by chemiluminescence assay) and intracellular calcium (as determined by calcium-sensitive dye) illustrates the antiphase relationship. Cytosolic Ca2+ intensities were determined every hour using Fluo-4 Ca2+ imaging (calcium, green line). Media samples were taken at each corresponding time point to obtain extracellular ATP levels (ATP, blue line). A tight inverse relationship exists between these two cellular rhythms.
Stimulus-evoked ATP release from astrocytes is thought to be vesicular and calcium-mediated (Fumagalli et al., 2003; Pascual et al., 2005). Because 80% of the cultured SCN2.2 cells are astrocytic cells, we investigated whether [Ca2+]i is highest during peaks in circadian-regulated, extracellular ATP accumulation. Confluent SCN2.2 cell cultures, loaded with the ratiometric Ca2+ indicator dye Fura-2 AM, were imaged at the trough and peak time points of ATP accumulation (Fig. 1C,D) as determined by chemiluminometry. Cytosolic Ca2+ levels at the ATP accumulation trough (n = 4) were significantly higher (p < 0.05) than at the ATP peak (n = 4; CP/T = 2.2) (Fig. 1E), suggesting that [Ca2+]i was inversely related to the circadian variation in ATP accumulation. The amplitude of the rhythm in [Ca2+]i was estimated to range between 100 and 150 nm at troughs to 250–300 nm at peaks. To further demonstrate this antiphase relationship between intracellular Ca2+ and extracellular ATP, assays for both molecules were simultaneously conducted at 1 h intervals for 12 h. The peaks and troughs in Ca2+ indicator fluorescence and the gradual transitions between these maximal and minimal states were virtually an inverted replica of the levels detected for ATP-dependent chemiluminescence (Fig. 1F), demonstrating an antiphasic relationship between rhythmic extracellular ATP accumulation and cytosolic Ca2+ concentration.
Rhythms in mitochondrial calcium signaling
Because ATP is produced in mitochondria and calcium signaling is a critical regulator of mitochondrial function (Santo-Domingo and Demaurex, 2010), we quantified mitochondrial Ca2+ levels with Rhod-2 AM, a fluorescent indicator of mitochondrial Ca2+, while monitoring cytoplasmic Ca2+ levels at peak and trough times of ATP accumulation in parallel cultures with Fluo-4 AM (Fig. 2A–D). In SCN2.2 cultures, cytoplasmic Ca2+ was again significantly reduced at the ATP peak (p < 0.05; n = 4) compared with the trough (n = 4; CP/T = 3.0) (Fig. 2E). However, mitochondrial Ca2+ at the ATP peak time point was significantly greater than at the trough in ATP accumulation (p < 0.05; n = 4 cultures per time point; CP/T = 2.6) (Fig. 2F). To confirm that the calcium changes being detected with Rhod-2 AM were specific to mitochondria we conducted dual-labeling studies with the mitochondrial marker dye MitoT (Fig. 2H,I). The location of intense Rhod-2 fluorescence colabeled with the MitoT marker, thus Rhod-2 reporting of calcium changes was primarily mitochondrial.

Rhythms in mitochondrial calcium and ATP accumulation are in phase. A–D, Representative images of SCN2.2 cell cultures loaded with Fluo-4 AM (FLUO) and Rhod-2 AM (RHOD) at ATP trough (A, C) and ATP peak (B, D) time points. Cytoplasmic Ca2+, indicated by Fluo-4, was high when extracellular ATP accumulation was low, whereas mitochondrial Ca2+, as indicated by Rhod-2 AM, was high when extracellular ATP accumulation was high. The scale bar in D equals 40 μm. E, At the ATP trough, Fluo-4 fluorescence was significantly greater (FLUO TROUGH; *p < 0.05; n = 4) than at the ATP peak (FLUO PEAK; n = 4), with a CP/T ratio of 3.0. F, Mitochondrial Ca2+ levels were precisely opposed (antiphase) to those of cytoplasmic calcium, because mitochondrial Ca2+ was significantly reduced at the ATP trough (RHOD TROUGH; *p < 0.05; n = 4), compared with the ATP peak (RHOD PEAK; n = 4; CP/T = 2.6). G–I, Colocalization fluorescence imaging was performed with MitoT, a mitochondrial marker, demonstrating that Rhod-2 AM is primarily an indicator of mitochondrial Ca2+ levels in these SCN2.2 cultures. The scale bar in I equals 5 μm.
To determine whether cytoplasmic Ca2+ is linked to the rhythmic accumulation of extracellular ATP, SCN2.2 cell cultures were treated with 8 μm BAPTA, a cell-permeable chelator of cytosolic calcium. BAPTA treatment significantly reduced cytosolic free Ca2+ levels at the peak resting Ca2+ (trough ATP) time point, compared with untreated control cultures (n = 4 cultures per time point; p < 0.02), and abolished differences in resting Ca2+ concentration between peak and trough ATP time points (Fig. 3A) (p = 0.19). BAPTA treatment also attenuated the rhythmic accumulation of ATP, such that the ATP-dependent chemiluminescence ratio (CP/T) of 2.9 ± 0.3 in control cultures was reduced to 1.5 ± 0.1 in BAPTA-treated cultures (p < 0.03) (Fig. 3B). Furthermore, rhythms in mitochondrial Ca2+ levels were no longer present after BAPTA treatment (p = 0.56), as indicated by Rhod-2 intensity levels of 26.2 ± 7.1 at the ATP peak and 20.2 ± 3.8 at the ATP trough. Compared with control cultures (Fig. 2F), BAPTA treatment profoundly reduced mitochondrial Ca2+ elevation at the peak ATP accumulation time point. Because ER calcium stores are important in the regulation of Ca2+ signaling in neural cells, we quantified ATP accumulation in SCN2.2 cell cultures during treatment with 1 μm THAPS, an inhibitor of the sarco/endoplasmic reticulum Ca2+ ATPase (SERCA). Depletion of ER calcium stores with THAPS significantly elevated levels of intracellular Ca2+ at the trough ATP time point (Fig. 3A), compared with the untreated controls (n = 4 cultures per time point; p < 0.002). However, the rhythm in intracellular Ca2+ was not altered by this treatment; that is, resting Ca2+ concentration was still different between peak and trough ATP time points (p < 0.005) (Fig. 3A). Unlike BAPTA treatment, THAPS had no detectable effect on the extracellular ATP accumulation rhythm, because THAPS-treated cultures exhibited a robust peak-to-trough difference in ATP chemiluminescence with a CP/T of 2.6 ± 0.3 that was not significantly different from the CP/T value of untreated controls (p = 0.39) (Fig. 3B). Thus, BAPTA treatment diminished both resting calcium and extracellular ATP accumulation rhythms, but THAPS treatment did neither, even though 1 μm THAPS potently disrupted mechanically evoked calcium waves in these SCN2.2 cultures (data not shown).

BAPTA, but not THAPS, alters extracellular ATP accumulation rhythms. A, Resting cytosolic Ca2+ concentration was significantly different between peak (P) and trough (T) ATP time points (n = 4 cultures per time point; *p < 0.03). After treatment with a Ca2+ chelator, 8 μm BAPTA-AM, cytosolic Ca2+ level was significantly reduced at the trough ATP time point (T), compared with untreated control cultures (n = 4 cultures per time point; #, p < 0.02), and abolished differences in resting Ca2+ concentration between peak and trough ATP time points (p = 0.19). Treatment with 1 μm THAPS, an inhibitor of SERCA, significantly elevated levels of intracellular Ca2+ at the trough ATP time point (T), compared with the untreated controls (n = 4 cultures per time point; ##, p < 0.002). However, the rhythm in intracellular Ca2+, i.e., the difference between peak and trough ATP time points, was not altered by this treatment (**p < 0.005). B, BAPTA treatment attenuated the rhythmic accumulation of ATP. The ATP-dependent chemiluminescence ratio (Peak/Trough) of 2.9 ± 0.3 in controls was significantly reduced to 1.5 ± 0.1 in BAPTA-treated cultures (n = 4; *p < 0.03). THAPS-treated cultures exhibited a robust peak-to-trough difference in ATP chemiluminescence that was not significantly different from untreated controls (p = 0.39). Error bars represent 95% confidence intervals.
Because mitochondrial Ca2+ elevation increases ATP production and the major conduit for Ca2+ entry is the mitochondrial uniporter channel (Santo-Domingo and Demaurex, 2010), we determined whether mitochondrial Ca2+ signaling is coupled to extracellular ATP accumulation by pharmacologically disrupting uniporter function. SCN2.2 cell cultures were treated with Ru360, a specific inhibitor of the mitochondrial Ca2+ uniporter. Because Ru360 does not affect changes in other Ca2+ transport processes (Kirichok et al., 2004), the specific involvement of mitochondrial Ca2+ signaling in clock-controlled ATP accumulation was directly tested. In comparison with untreated SCN2.2 cultures (n = 8), treatment with Ru360 caused a significant decrease (p < 0.05) in ATP-dependent chemiluminescence at both the predicted trough and peak times of ATP accumulation (n = 8) (Fig. 4).
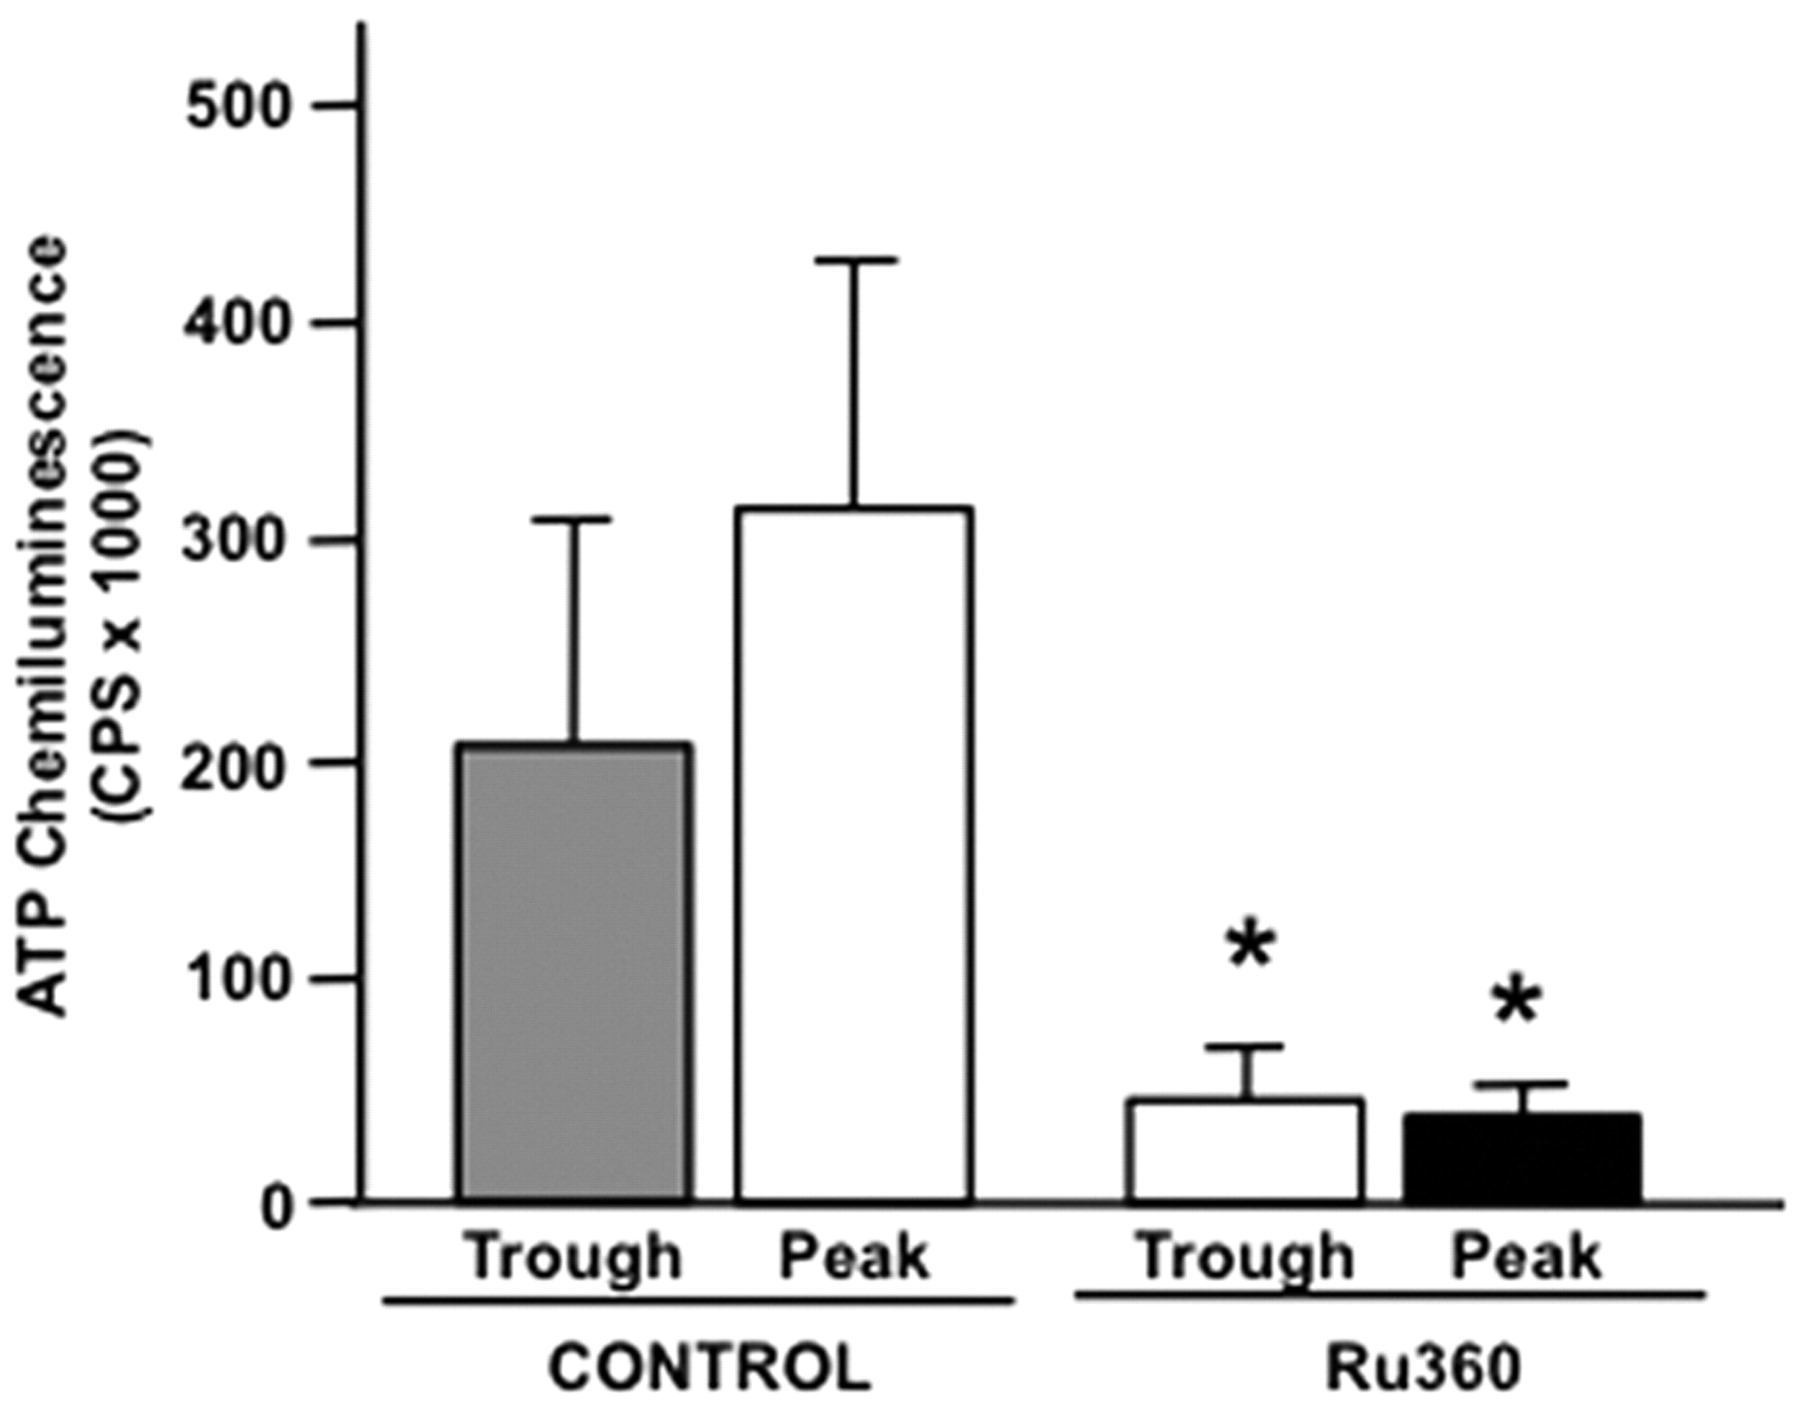
Mitochondrial calcium signaling is necessary for extracellular ATP accumulation. Ru360, a specific mitochondrial calcium uniporter inhibitor, significantly reduced extracellular ATP accumulation in treated SCN2.2 cultures (n = 8 cultures per time point) compared with untreated cultures at both trough and peak time points (*p < 0.05; n = 8 cultures per time point). Error bars represent 95% confidence intervals.
ATP accumulation during cell cycle arrest
ATP (Marcussen and Larsen, 1996), calcium (Baran, 1996), and the biological clock (Gery et al., 2006) can independently regulate cell division. Additionally, synchronous cytokinesis events could occur at near 24 h intervals and therefore provide a potential source of rhythmic ATP accumulation in the medium of cell cultures. Consequently, we tested the possibility that rhythmic ATP accumulation is a byproduct of rhythmic cell division by determining whether chemical antagonism of cell division abrogated rhythmic ATP accumulation. Consistent with our previous observations (Womac et al., 2009), untreated control cultures (n = 5) exhibited rhythmic patterns of ATP accumulation in which peak levels recurred at ∼24 h intervals (Fig. 5A). Pharmacological disruption of the cell cycle with 100 μm AraC had a minor effect in decreasing the amplitude of the rhythm in extracellular ATP accumulation when cultures were continuously exposed to the drug from 24 to 76 h, but did not produce detectable alterations in the period of this rhythm, because ATP levels continued to peak at ∼24 h intervals in all AraC-treated cultures (n = 8) (Fig. 5B).

ATP accumulation rhythms persist during cell cycle arrest. Pharmacological disruption of the cell cycle with AraC did not affect rhythmic extracellular ATP accumulation. A, Chemiluminescence data from a representative control SCN2.2 cell culture shows peaks in ATP accumulation with ∼24 h periodicity. B, After the addition of an anticancer drug (t = 24) used to inhibit cell division (ARA), extracellular ATP rhythms persisted with peaks in accumulation at ∼24 h intervals. Disruption of the cell cycle caused a reduction in the amplitude of the ATP accumulation rhythm. AraC was present in the treated cultures from 24 h to the end of data collection. C–H, Pharmacological disruption of the cell cycle with AraC affected SCN2.2 cell numbers. Differential interference contrast microscopy (DIC; C and F) was combined with DAPI nuclear staining fluorescence microscopy (DAPI; D and G). The density of control cells was greater than that in AraC-treated cultures, and the apparent cell size of control astrocytic cells was smaller than treated cells. The scale bars in D and G equal 20 μm. Additionally, multiple mitotically dividing cells were visible in each field of control cells visualized (arrows in E); whereas no cell division was detected in AraC-treated cultures. AraC treatment began at 24 h and continued through the experiment. I, AraC inhibition of cell division led to significantly reduced cell counts (number of DAPI nuclei per random ROI) in treated cultures compared with controls (*p < 0.05; n = 8 cultures per group). J, ATP trough and peak differences were confirmed in these cultures by ATP-dependent chemiluminescence. ATP chemiluminescence ratios were >2.0 in both control (CON) and AraC-treated (ARA) SCN2.2 cultures, and these average CP/T values were not significantly different (n = 8 cultures per group; p = 0.78). Error bars in I and J represent 95% confidence intervals.
To confirm that the cell cycle was indeed disrupted by AraC treatment, SCN2.2 cell cultures were imaged and analyzed for cell number and chromatin analysis using DAPI nuclear staining (Fig. 5C–H). AraC treatment caused a significant decrease (p < 0.05) in total cell count (number of DAPI-stained nuclei; n = 8) (Fig. 5G,I), compared with untreated control cultures (n = 8) (Fig. 5D,I). In addition to its effects in reducing the number of cells present in the cultures, AraC treatment, which began at 24 h and was then present throughout the experiment, caused a concomitant increase in the size of individual astrocytic cells and the complete disappearance of chromatin structural arrangements representative of mitotic division (Fig. 5E,H). Although cell division was suppressed for 48 h in the AraC-treated cultures, rhythmic changes in extracellular ATP levels were not significantly different from those found in untreated controls (Fig. 5J), with both groups exhibiting peak-to-trough differences in chemiluminescence of ∼2-fold. Thus, the finding that the rhythm in extracellular ATP accumulation is not altered by AraC-induced disruption of the cell cycle indicates that variation in extracellular ATP levels is not associated with the cell biology of mitotic division.
Cell death in SCN2.2 cell cultures
Both purinergic receptor activation (Locovei et al., 2007) and mitochondrial calcium signaling (Hajnoczky et al., 2006) have been implicated in cell death processes. Increases in mitochondrial calcium elicit cytochrome c release that, in turn, activates caspases (Kuwana and Newmeyer, 2003). Furthermore, cytochrome c gene expression is circadian in rat SCN cells (Menger et al., 2005). Therefore, we determined whether cell death was rhythmic in SCN2.2 cells and correlated with the temporal pattern of ATP accumulation. To provide an indicator of cell death, caspase activity was analyzed using a fluorescent pan-caspase assay (Fig. 6A–D). No correlation between caspase activity and extracellular ATP accumulation was detected, because the relative number of caspase-positive cells at the trough time of ATP accumulation was not significantly different (p = 0.89) from that observed at the peak in ATP levels (n = 8 cultures per time point) (Fig. 6E). Furthermore, ATP rhythms were robust and marked by a chemiluminescence peak-to-trough ratio of 2.5-fold. However, the percentage of caspase-positive cells remained low (i.e., less selective staining of dead SCN2.2 cells with Trypan blue indicated a similar percentage of dead or dying cells in these cultures; <5% of total cell counts) (data not shown). Therefore, clock-controlled extracellular ATP accumulation is not a byproduct of rhythmic cell death in SCN2.2 cultures.

Cell death is not rhythmic in SCN2.2 cell cultures. Caspase activity assays did not detect differences in cell death between trough and peak ATP accumulation time points. A–D, Representative images from an SCN2.2 culture at the ATP trough are illustrated using DIC (A), DAPI (B), and FLICA (caspase activity assay; C) microscopy. The corresponding arrows in each panel indicate three neurons that have a spherical cell shape, but are not FLICA-positive. The scale bar in D equals 20 μm. E, There was no difference in caspase activity, calculated as FLICA-positive cells per total cell count, between the ATP trough and the ATP peak time points (p = 0.89; n = 8 cultures per time point), although a robust difference in ATP accumulation was present (CP/T = 2.5). Error bars represent 95% confidence intervals.
Discussion
The SCN, the circadian master clock in mammals, contains a high density of astrocytes (Morin et al., 1989). Astrocytes exhibit circadian rhythms in clock gene expression (Prolo et al., 2005), are entrained by SCN neurotransmission (Marpegan et al., 2009), and are capable of calcium-dependent release of gliotransmitters (Volterra and Meldolesi, 2005; Panatier and Oliet, 2006). ATP is released from astrocytes after transient Ca2+ elevation (Guthrie et al., 1999) and is rhythmically accumulated in extracellular fluid of the rat SCN in vivo (Womac et al., 2009). Similarly, extracellular ATP accumulates with a periodicity of ∼24 h in rat SCN2.2 cells and in purified mouse cortical astrocytes in culture, indicating that oscillations in ATP release are intrinsic properties of astrocytes and do not depend on neuronal cell populations for rhythmicity (Womac et al., 2009). The present results delineate the role of calcium and calcium-dependent processes, including cell cycle and cell death, in the circadian regulation of extracellular ATP accumulation in SCN2.2 cultures.
Calcium signaling and extracellular ATP accumulation
The present finding of a 24 h intracellular Ca2+ rhythm in SCN2.2 astrocytic cells is both novel and intriguing because most calcium signals in astrocytes are brief, lasting from milliseconds to minutes. Nevertheless, long-lasting oscillations in cytosolic Ca2+ in plant cells and mammalian neurons exist (Johnson et al., 1995; Colwell, 2000; Ikeda et al., 2003; Love et al., 2004). Circadian rhythms in calcium channels (Nahm et al., 2005), calcium influx (Lundkvist et al., 2005), and calcium-activated currents (Pitts et al., 2006) regulate the oscillatory physiology of pacemaker neurons of the SCN, and cytosolic Ca2+-dependent signaling pathways are regulated by excitatory and inhibitory networks (Irwin and Allen, 2009) and can reset clock gene expression cycles (Honma and Honma, 2003; Ikeda, 2004). However, unlike neurons that use voltage-gated Ca2+ channels as the primary trigger for neurotransmitter release, astrocytes predominantly use release of Ca2+ from ER stores (Deitmer et al., 1998; Verkhratsky et al., 1998). The observed antiphase relationship between cytosolic Ca2+ and ATP accumulation rhythms (Fig. 1) is somewhat surprising because stimulus-evoked ATP release from astrocytes is thought to be vesicular and calcium-mediated (Fumagalli et al., 2003; Pascual et al., 2005; Fellin et al., 2006). This inverse phase relationship seems inconsistent with a role for these low-amplitude calcium oscillations as a trigger for circadian-regulated ATP release. Our estimation of peak [Ca+2]i (∼250 nm) is much lower than that typically required for calcium-dependent transmitter release and ATP-dependent intercellular Ca2+ waves (Scemes and Giaume, 2006). Still, Ca2+ chelation with BAPTA produced a significant attenuation of the ATP accumulation rhythm and abolished rhythms in mitochondria Ca2+, suggesting a role for intracellular Ca2+ homeostasis in the mechanism underlying circadian ATP production and accumulation. The Atp2a3 gene, which encodes an ATP-dependent ER calcium (SERCA) pump, is rhythmically expressed in the rat SCN (Menger et al., 2005). Still, THAPS, a SERCA inhibitor, although significantly altering cytosolic Ca2+ levels, did not alter either the rhythm in cytosolic Ca2+ or the rhythm in ATP accumulation. This is a somewhat surprising result, because astrocytic calcium transients are often THAPS-sensitive (Deitmer et al., 2009), and it suggests that ER stores of Ca2+ are not necessary for the clock-controlled rhythm in intracellular Ca2+ and cytosolic Ca2+-dependent rhythm in ATP accumulation may be a fundamentally different mechanism than that regulating more rapid astrocytic calcium signals.
Calcium signaling is a critical regulator of mitochondrial function and energy metabolism (Santo-Domingo and Demaurex, 2010), and increases in mitochondrial calcium activate dehydrogenases that facilitate ATP production (McCormack et al., 1990). In SCN2.2 astrocytic cells, mitochondrial Ca2+ was elevated 5-fold at peak ATP accumulation, compared with trough levels (Fig. 2). Calcium is sequestered from the cytosol by a mitochondrial Ca2+ uniporter, and mitochondrial calcium buffering can modulate gliotransmitter exocytosis (Reyes and Parpura, 2008). Disruption of this Ca2+ transporter in SCN2.2 cells abolished circadian oscillations in extracellular ATP accumulation (Fig. 2). A circadian rhythm in mitochondrial Ca2+ signaling, together with its connection to ATP accumulation, is consistent with the observation that genes involved in mitochondrial physiology are rhythmically expressed in the SCN (Panda et al., 2002; Menger et al., 2005). For example, two mitochondrial ATP synthases (mt-Atp8 and Atp5l) and hexokinase 2 (Hk2), crucial regulators of ATP synthesis and glycolysis, respectively, are circadian in their expression. The peak in extracellular ATP accumulation in the rat SCN occurs late at night (Womac et al., 2009). Therefore, rhythmic ATP release might lag slightly behind ATP production, where cellular ATP content peaks at midsubjective night (Yamazaki et al., 1994), placing rhythmic mitochondrial Ca2+ signaling at a critical linkage point between the clock-control mechanisms and the regulation of rhythmic ATP release.
Cell death, cell cycle, and extracellular ATP
Mitochondria are dynamic regulators of cellular Ca2+ homeostasis (Griffiths and Rutter, 2009), providing for the uptake of significant cytosolic calcium to protect cells from damage or death. Nonetheless, calcium uptake into mitochondria is typically transient (Rizzuto et al., 1993), because excess mitochondrial calcium can trigger apoptosis (Hajnoczky et al., 2006). Our findings indicate that rhythmic elevations in mitochondrial calcium are not associated with cell death, nor do extracellular ATP accumulation rhythms correlate with caspase activity (Fig. 5). Although normally quiescent, astrocytes have the ability to proliferate, and high extracellular ATP can enhance mitogenesis (Neary et al., 2005). Chemical antagonism of cell division with AraC did not affect rhythmic ATP accumulation in these immortalized SCN astrocytic cells (Fig. 4). Thus, clock-controlled ATP accumulation rhythms are not caused by rhythmic cell division or death in SCN2.2 cells.
Potential roles of rhythmic ATP signaling
SCN cells intrinsically produce circadian rhythms of cellular physiology and gene expression (Lee et al., 2003; Allen et al., 2004), and coordinated SCN rhythms are a product of the synchronization of individual neuronal oscillations (Welsh et al., 1995, 2010; Hastings and Herzog, 2004). Our observation that SCN2.2 cells express rhythmic extracellular ATP accumulation (Fig. 1) (Womac et al., 2009) raises the possibility that ATP gliotransmission may function as a paracrine signal among SCN astrocytes. Perisynaptic astrocytes contribute to the control of synaptic transmission (Araque et al., 1999), and their release of ATP, via its breakdown to adenosine, modulates synaptic plasticity (Pascual et al., 2005) and sleep homeostasis (Halassa et al., 2009). Furthermore, ATP levels in various brain regions fluctuate between sleep and wake states (Dworak et al., 2010). The release of ATP from astrocytes of the rat paraventricular nucleus is required for norepinephrine-dependent synaptic potentiation (Gordon et al., 2005). In the rat supraoptic nucleus, astrocytes alter their anatomical association with glutamatergic synapses during reproductive transitions, thereby affecting synaptic strength (Panatier et al., 2006). Although a process of clock-controlled gliotransmission might have implications for each of these systems, its role in the SCN remains to be determined.
The antiphase relationship between extracellular ATP accumulation and intracellular Ca2+ in SCN2.2 cells (Fig. 1) suggests that peak astrocytic [Ca2+]i may parallel the daytime peak in SCN neuronal Ca2+ (Colwell, 2000; Ikeda et al., 2003; Irwin and Allen, 2009), a time when excitatory synaptic inputs from the eye and neuronal activity in these hypothalamic nuclei are greatest. The predicted daytime maxima in astrocyte Ca2+ levels would also correlate with the peak in rhythmic astrocytic process elongation (Lavialle and Serviere, 1993). Diurnal elevation in cytosolic Ca2+ has adaptive implications in the activation of Ca2+-activated potassium channels by assisting in the clearance of K+ ions that accumulate in the extracellular space during periods of high neuronal activity (Härtel et al., 2007). Furthermore, astrocyte-derived neural signaling can modulate cerebrovascular function (Deitmer et al., 2009) and brain metabolism (Bernardinelli et al., 2004; Magistretti, 2006). Thus, clock control of astrocyte signaling may represent a highly adaptive mechanism for coordinating temporal changes in neural and metabolic demands. Because astrocytes have been shown to regulate expression of certain clock genes in a circadian rhythm (Prolo et al., 2005), it will be important to determine whether or not disruption of the canonical molecular clock alters ATP and calcium signaling rhythms in astrocytes.
Biological clocks regulate the physiology of virtually all life forms on Earth such that cells, tissues, and organisms anticipate rhythmic challenges and opportunities associated with day-night cycles (Bell-Pedersen et al., 2005). Eukaryotic cells invest much of their energy (ATP) in regulating levels of intracellular Ca2+, in part because Ca2+ binds to thousands of proteins regulating a vast array of cellular processes, including gene expression (Chapman, 2007). Furthermore, uncontrolled intracellular Ca2+ can lead to cytotoxicity and cell death. Thus, it is likely that rhythmic calcium oscillations in the cytosol and mitochondria of astrocytes are coregulated by both circadian and homeostatic mechanisms, because brain physiology and animal behavior shift between active and inactive states.
Footnotes
This research was supported by National Institutes of Health Program Project Grant P01 NS39546 (to D.J.E., M.J.Z.). We acknowledge the work of Kimberly Cox, Andrew Smith, Stephen Dooley, and Saida Osman, whose research assistance contributed to this project. We thank Lily Bartoszek for valuable comments on the manuscript.
- Correspondence should be addressed to Dr. Mark J. Zoran, Department of Biology, Texas A&M University, College Station, TX 77843-3258. zoran{at}mail.bio.tamu.edu


