

Abstract
Long-lasting forms of neuronal plasticity require de novo gene expression, but relatively little is known about the events that occur genome-wide in response to activity in a neuronal network. Here, we unveil the gene expression programs initiated in mouse hippocampal neurons in response to different stimuli and explore the contribution of four prominent plasticity-related transcription factors (CREB, SRF, EGR1, and FOS) to these programs. Our study provides a comprehensive view of the intricate genetic networks and interactions elicited by neuronal stimulation identifying hundreds of novel downstream targets, including novel stimulus-associated miRNAs and candidate genes that may be differentially regulated at the exon/promoter level. Our analyses indicate that these four transcription factors impinge on similar biological processes through primarily non-overlapping gene-expression programs. Meta-analysis of the datasets generated in our study and comparison with publicly available transcriptomics data revealed the individual and collective contribution of these transcription factors to different activity-driven genetic programs. In addition, both gain- and loss-of-function experiments support a pivotal role for CREB in membrane-to-nucleus signal transduction in neurons. Our data provide a novel resource for researchers wanting to explore the genetic pathways associated with activity-regulated neuronal functions.
Introduction
External stimuli trigger highly specific transcriptional responses in neurons through the activation of several dozens of plasticity-related transcription factors (PRTFs) by different mechanisms, such as phosphorylation, nuclear translocation, or transcriptional induction (Herdegen and Leah, 1998). This activity-driven gene expression mediates structural and functional changes that affect the manner in which neurons process information and respond to future stimuli, modifying the overall activity of neuronal circuits (Flavell and Greenberg, 2008; Loebrich and Nedivi, 2009). Previous attempts to characterize neuronal activity-driven transcription and the regulon of specific PRTFs were limited by the then available mouse genome annotation, the shortcomings of in silico approaches for identifying target genes, and comparability issues associated with the rapid development of microarray technology. Furthermore, most studies have undertaken the “candidate gene” approach, in which one or a few candidates from a genome-wide screen are selected for additional study. Although this is an effective manner of linking specific gene products with the investigated process and has allowed rapid progress in the field of molecular neuroscience, it neglects the power and potential of genome-wide approaches.
Here, we present data from transcriptomic experiments that aim to provide understanding of neuronal function at a systems-level scale (Dougherty and Geschwind, 2005; Geschwind and Konopka, 2009; Valor and Barco, 2010). We first tackled the transcriptional programs initiated in hippocampal neurons in response to different kinds of stimuli through microarray-based gene profiling. Next, we examined the gene programs downstream of four prominent PRTFs in the same system: (1) CREB, a well-studied transcription factor (TF) that plays critical roles in neuronal plasticity (Benito and Barco, 2010), survival, and differentiation (Lonze and Ginty, 2002) and whose activity depends on phosphorylation at specific serine residues by activity-regulated protein kinases; (2) SRF, a TF also regulated by phosphorylation that contributes to neuronal plasticity through the regulation of cytoskeletal dynamics (Knöll and Nordheim, 2009); (3) FOS, an inducible TF widely used as a marker of neuronal activation, although its specific function as well as its downstream gene program are still poorly understood (Durchdewald et al., 2009); and (4) EGR1, another TF whose expression is induced by neuronal stimulation and by specific behavioral experiences (Bozon et al., 2003). For CREB, this gain-of-function strategy was complemented by gene profiling experiments with the strong inhibitor of the CREB family of TFs A-CREB (Ahn et al., 1998). Meta-analysis techniques revealed the relative contribution of these four PRTFs to different activity-driven gene-expression programs, including those obtained in our gene profiling analysis of stimuli response, and supported a key role for CREB as a signaling hub in the membrane-to-nucleus transduction pathway in neurons. Overall, our study identifies hundreds of novel activity-regulated genes in neurons and unveils important features of activity-driven gene expression. The information can be accessed through the searchable database NADtranscriptomics (http://in.umh-csic.es/NADtranscriptomics/).
Materials and Methods
Lentiviral production.
The DNA binding domain (DBD) of TFs CREB, SRF, EGR1, and FOS was fused with the acidic transactivation domain of viral protein 16 (VP16) of herpes simplex virus (Flint and Shenk, 1997). These chimeric constructs, as well as the coding sequence of A-CREB (Ahn et al., 1998), were cloned into the Synapsin promoter-bearing lentiviral vector LenLox 3.7 (Gascón et al., 2008). Production of lentiviral pseudovirions was performed as described by Gascón et al. (2008) with minor modifications. Briefly, ∼107 HEK293T cells were plated in 25 cm dishes, incubated overnight, and transfected using the calcium phosphate method with a mixture of 20 μg of transgene-bearing plasmid, 15 μg of pCMV–∂8.9 plasmid containing the gag and pol viral genes and 10 μg of pCAG–VSV-G plasmid encoding the protein G from vesicular stomatitis virus (VSV-G) for pseudotyping. Media was replaced 4–6 h after transfection to prevent cell toxicity. At 36–48 h after transfection, cell supernatants were centrifuged at low speed (5 min, 2000 rpm) and filtered to obtain a clear viral-containing solution. This solution was ultracentrifuged at 25,000 rpm for 90 min to pellet viral particles. Viral stocks were tittered by qRT-PCR (a standard curve was prepared in parallel using the lentiviral plasmid at known concentrations to estimate the absolute number of viral genomes) and aliquoted for long-term storage at −80°C. Unconcentrated viral preparations regularly fell in the order of 108-109 particles/ml, from which it was estimated that the final titer in viral stocks was ∼1011 viral particles/ml. Given the possibility of contaminating genomic DNA and defective viral particles in the preparation (Sastry et al., 2002), the effective titer is more likely at the 109 viral particles/ml range.
Hippocampal neuron culture, infection, and chemical treatment.
Primary hippocampal neurons were cultured in 24-well plates (Becton Dickinson 353047) on 12 mm glass coverslips (VWR) coated with poly-d-lysine (Sigma-Aldrich). Experimental animals were Swiss albino mouse embryos at E17.5–E18.5 of either sex. Hippocampi were dissected in ice-cold HBSS and pooled for trypsinization and homogenization. Approximately 20–24 hippocampi from 10–12 embryos were pooled in a 15 ml tube per culture. After tissue homogenization, cells were counted in a Neubauer chamber and seeded at a density of ∼130,000 cells per well. Cells were incubated at 37°C and 0.5% CO2, and, after 2–3 h, plating medium (DMEM supplemented with 10% FBS, 0.45% glucose, 2 mm glutamine, and 100 U/ml to 100 μg/ml penicillin/streptomycin) was replaced with defined maintenance medium (Neurobasal medium supplemented with B27, 2 mm glutamine, and 100 U/ml to 100 μg/ml penicillin/streptomycin). The day of plating was considered day in vitro 1 (1DIV). Neurons were incubated for at least 3 additional days (4DIV) before they were used in any experiment. Primary hippocampal neurons were infected at the times indicated by adding the necessary volume of the concentrated viral preparation to achieve an effective multiplicity of infection of 1–10, which provided a percentage of neuronal infection close to 100%. The following concentrations were used for stimulation experiments: bicuculline (bic) (Tocris Bioscience; 50 μm in DMSO) plus 4-AP (2.5 mm in H2O), forskolin (fsk) (Tocris Bioscience; 50 μm in DMSO), and BDNF (Sigma; 100 ng/ml in H2O). To make the stimulation experiments more comparable with the constitutively active (ca) PRTF experiments, all stimulations were performed on GFP-infected neurons.
Luciferase assays, Western blots, and immunohistochemistry.
HEK293 cells were transfected with Lipofectamine (Invitrogen) according to the instructions of the manufacturer. At 24 h after transfection, luciferase activity was measured using the Dual Luciferase Assay kit (Promega). Firefly luciferase was used as an activity indicator, and Renilla luciferase was used as a normalizer. For Western blot, extraction buffer (50 mm Tris-HCl, 150 mm NaCl, 1 mm EDTA, and 1% NP-40) containing protein inhibitor mix (Roche) was added to the cells, and extracts were sonicated using a BioRuptor apparatus (Diagenode) with a 30 s ON–30 s OFF cycle during 15 min. Equal amounts of extracted proteins were separated by SDS-PAGE and transferred to a nitrocellulose membrane. Western blot analyses were performed using ECL (PerkinElmer Life and Analytical Sciences). The intensity of the protein bands was measured using Fujifilm LAS-100 equipment and quantified using Quantity One 4.6 software (Bio-Rad). For immunocytochemistry, cells were fixed in 4% paraformaldehyde for 15 min at room temperature, washed with PBS, and permeabilized with PBS containing 0.25% Triton X-100 for 10 min at room temperature. Cells were incubated in the primary antibody solution overnight at 4°C, and the secondary antibody incubation was performed at room temperature during 1–3 h. Finally, nuclei were counterstained with a 1 nm DAPI solution (Invitrogen). The primary antibodies used in this study included α-GFP (Aves Labs), α-NeuN (Millipore Bioscience Research Reagents), α-GFAP (Sigma-Aldrich), α-VP16 from mouse (Santa Cruz Biotechnology; used in immunostainings) and rabbit (Sigma-Aldrich; used for immunoblotting), and α-Flag–M2 (Sigma-Aldrich).
RNA extraction and qRT-PCR.
Total RNA from hippocampal cultures was extracted with the RNeasy mini kit (Qiagen) and reverse transcribed to cDNA using the RevertAid First-Strand cDNA Synthesis kit (Fermentas). qPCR was performed in an Applied Biosystems 7300 real-time PCR unit using SYBR GreenER qPCR reagent mix (Invitrogen). Each independent sample was assayed in duplicate and normalized using GAPDH levels. All primer pairs were tested for efficiency, and their sequence is available on request.
Microarray analysis.
In microarrays experiments, a minimum of 106 cells (∼12 wells) were pooled per sample. RNA was extracted and purified as described and hybridized to Mouse Gene 1.0 ST gene chips from Affymetrix. Five biological replicates were prepared for neurons infected with the control VP16-only expressing lentivirus (LV), and three biological replicates were prepared for all other conditions. Microarray data were background corrected, normalized, summarized, and statistically analyzed using R (http://www.r-project.org/; The R Development Core Team) and Bioconductor (Gentleman et al., 2004). Quality control analysis was performed with the arrayQualityMetrics package (Kauffmann et al., 2009). Vsn (variance stabilization normalization) (Huber et al., 2002) was used for normalization and median polish from the affy package (Gautier et al., 2004) for probe summarization. Moderated t tests from the limma package (Smyth, 2005) were used for extracting statistically significant genes by comparing with the appropriate control (VP16 for lentiviral infection experiments and GFP-mock or GFP–DMSO for stimulation experiments).
Bioinformatical analyses.
Pearson's correlations were calculated within R with the “cor” function. We identified differentially expressed probeset identifications (representing groups of probes mapping to different exons of the same gene) by applying the probeset-level annotation package in Bioconductor for this particular platform (http://www.bioconductor.org/packages/2.6/data/annotation/html/mogene10stprobeset.db.html; Arthur Li). Probeset-level analysis of gene expression was performed by reading in CEL files with the oligo package (Carvalho and Irizarry, 2010); normalization and moderated t test calculations were performed using the same packages mentioned above (VSN and limma packages). Candidate genes with an interesting probeset-level regulation profile were shortlisted on the basis of Z-test significance (see below, Statistical analysis), probeset fold change, and probeset significance. Probeset fold change representations and alignments to the genome and known transcripts were done with biomaRt (Durinck et al., 2009b) and Genome Graphs (Durinck et al., 2009a). Heat maps and hierarchical clustering were computed with the gplots package (http://cran.r-project.org/web/packages/gplots/index.html; Gregory R. Warnes). TopGO (http://www.bioconductor.org/packages/release/bioc/html/topGO.html; Adrian Alexa and Jörg Rahnenfuhrer) and GOstats (Falcon and Gentleman, 2007) were used for Gene Ontology (GO) analysis. Because of the inherent redundancy in the GO hierarchy, terms were manually collapsed into more general expressions. Only terms with a p ≤ 0.01 were considered for additional manual curation in all cases except in the TF comparison. To facilitate direct comparisons in this case, the total number of GO terms to be manually curated per condition was fixed based on the number of significant terms (p ≤ 0.05) in the most restrictive condition (SRF-downregulated genes), and the same number of terms was used for all the other gene lists. The Mammalian Phenotype Ontology (Smith et al., 2005) annotation was downloaded from the Mouse Genome Informatics (MGI). For miRNA target prediction analysis, target predictions with good mirSVR score (≤ −0.1) for conserved and nonconserved miRNAs were downloaded from microRNA.org. The mirSVR is defined as an empirical measure of the probability of a given mRNA to be downregulated by a given miRNA. As a complementary approach, the web-based tool Webgestalt (Zhang et al., 2005a) was used to search for overrepresentation of miRNA targets within CREB-downregulated genes. Microarray identifiers (transcript cluster identification numbers) were used as input, and four was selected as the minimum number of genes per category. PSCAN (Zambelli et al., 2009) was used for predictions of TF binding sites in the promoter region (−950/+50) of selected genes with the public TRANSFAC database as a source for TF consensus binding sites. Venny was used for representations of four-way Venn diagrams (http://bioinfogp.cnb.csic.es/tools/venny/index.html; Juan Carlos Oliveros). Gene set enrichment analysis (GSEA) (Subramanian et al., 2005) was performed with the stand-alone Java application and the Molecular Signature Database from the BROAD Institute (Xie et al., 2005). Gene sets were taken from the MSigDB or generated from the indicated literature. This dataset has been submitted to ArrayExpress database and has received the accession number E-MEXP-3167. In addition, our laboratory website provides access to the gene lists described in the text and figures and to an online searchable database that allows the interrogation of the dataset generated in this study (http://in.umh-csic.es/NADtranscriptomics/).
Statistical analysis.
Significance testing for qRT-PCR and luciferase assays was done using t tests with the exception of VP16/GFP ratio expression analysis, in which a one-way ANOVA was performed to compare the different groups. A two-way ANOVA was used to test main and interaction effects of genotype and treatment in luciferase experiments with A-CREB. All data are presented as mean ± SEM. These statistical analyses were performed with the SPSS software package. Significance testing for probeset-level analysis of gene expression was performed by first calculating Z-scores [defined as (x − m)/SE, where x represents the individual probeset fold change, m represents the average probeset fold change for a given gene, and SE is the SE of the mean probeset fold change of a given gene] and using them to evaluate the probability of finding this particular deviation from a normal distribution. Multiple testing adjustments were performed by the method of Benjamini–Hochberg (Benjamini and Hochberg, 1995). For GO, MGI functional term, and miRNA target prediction significance analysis, we calculated an enrichment score based on the observed and expected number of genes per functional category/number of predicted and observed targets per miRNA, and statistical significance was assessed with Fisher's exact test. In all cases, only genes present in the array platform were considered as background. For GSEA, statistical significance was assessed by permuting gene-set labels according to the authors' recommendation.
Results
Gene profiling of hippocampal cultures during different kinds of neuronal stimulation
We used Mouse Gene ST version 1.0 Affymetrix microarrays to identify genes induced in primary hippocampal cultures after exposure to three different sorts of stimuli at a time in which the neurons have extended an intricate network of processes and synaptogenesis is ongoing (Papa et al., 1995): (1) bic complemented with 4-AP, an established model of network disinhibition that enhances network activity (Hardingham et al., 2002); (2) fsk, an agonist of adenylyl cyclase that activates the cAMP pathway; and (3) BDNF, a neurotrophin that triggers synaptic growth and neuroprotection through activation of TrkB receptors. These stimulations caused the regulation of hundreds of transcripts (Fig. 1A,B; Table 1). Despite these protocols of chemical stimulation being commonly used to induce synaptic plasticity in vitro (e.g., fsk-induced LTP and BDNF-induced LTP), their comparison revealed a relatively low overlap between the genetic responses with ∼70–80% unique genes per condition (Fig. 1C). Most overlapping genes between any pair of conditions were regulated in the same direction (Fig. 1D). The largest overlap was found between fsk- and bic-dependent gene expression changes, with 58 genes in common. Correlation analyses (Fig. 1E) revealed a modest correlation between the BDNF and the fsk-induced programs (Pearson's correlation = 0.19) but a stronger correlation between fsk- and bic-dependent programs (Pearson's correlation = 0.56), indicating that the transcriptional response could be mediated in both cases by the same PRTFs. Remarkably, most bic-downregulated genes were noncoding RNAs, including 12 miRNAs, 11 of which mapped into a large cluster on the distal portion of chromosome 12 (Seitz et al., 2004; Kircher et al., 2008), suggesting that they are jointly regulated (Fig. 1F). Downregulated miRNAs were also part of the transcriptional response to BDNF stimulation, suggesting a key contribution of miRNAs-mediated mechanisms to activity-driven gene expression.

Comparison of stimulus-driven profiles. A, The heat map illustrates the differential expression of hundreds of genes during neuronal stimulation with different compounds. We stimulated the cultures with bic, fsk, and BDNF for 1, 18, and 48 h, respectively, based on previous literature and on preliminary qRT-PCR analyses (data not shown). B, Panels illustrate the distribution of gene expression changes induced by different treatments. Genes are separately ordered for upregulation and downregulation from most to least changed based on their absolute fold change, and each gene is plotted as a separate entity on the x-axis with the corresponding fold change represented on the y-axis. Upregulations dominated in the response to bic and fsk, whereas in the case of BDNF, downregulations and upregulations were balanced. The total number of genes affected is also indicated in the graphs. C, Venn diagram showing the number of genes in the intersection between the different gene lists. The numbers in parentheses show the percentage of unique genes per condition. D, Bar charts representing the specific percentage of overlapping genes between each pair of conditions, specifying whether common genes change in the same (“Coherent”) or opposite (“Reversed”) directions. E, The correlation heat map shows a significant correlation between bic- and fsk-dependent gene expression programs (p ≤ 0.001). F, Activity-regulated miRNAs. Note that both BDNF and bic cause a number of miRNA downregulations. # indicates that the specified miRNA belongs to the cluster of miRNAs located on chromosome 12.
Most affected genes (first decile) in each condition
Dissecting activity-driven gene expression: gene regulation by caCREB, caSRF, caEGR1, and caFOS
To investigate the contribution of specific TFs to these activity-driven gene programs, we used a gain-of-function approach based on lentiviral gene delivery of constitutively active variants of four prominent PRTFs: CREB, SRF, EGR1, and FOS. With this approach, we did not intend to reproduce the natural transcriptional programs regulated by these TFs but to identify the gene sets capable of responding to these TF in hippocampal neurons. The caPRTFs were constructed by fusing the DBD of each TF to the acidic transactivation domain VP16 (Fig. 2A). The activity of these chimeric proteins was first assessed in HEK293 cells using luciferase reporter plasmids specific for each TF (Fig. 2B). Pseudoviruses infected primary hippocampal cultures from E17.5 mouse embryos very efficiently. Six days after infection (DINF), transgenic expression was maximal without apparent effect on cell viability (Fig. 2C). The chimeric PRTFs were coexpressed with EGFP in >98% of the neurons, whereas the less abundant glial cells (GFAP+) did not express the transgenic proteins (Fig. 2D). qRT-PCR assays using primers for VP16 (Fig. 2E) and Western blots (Fig. 2F) and immunocytochemistry analyses (Fig. 2G) using a VP16-specific antibody confirmed the expression and nuclear localization of the chimeric constructs.

Infection of hippocampal cultures by caPRTFs-expressing LV. A, Scheme of lentiviral backbone, cloning sites, and caPRTF constructs. LTR, Long-termination repeats; SynP, synapsin promoter; WPRE, woodchunk hepatitis virus post-transcriptional regulatory element. B, The different caPRTFs activate the corresponding luciferase reporter plasmids in HEK293 cells. The number of reporter sites in each plasmid is indicated. **p ≤ 0.01, ***p ≤ 0.001, t test (n = 7–10 per condition). C, Immunocytochemistry of hippocampal neurons infected with the different caPRTF-expressing and control LV (10DIV/6DINF) using anti-GFP antibody. GFP expression was detectable at 3DINF by direct fluorescence and became progressively stronger, reaching a plateau by 6DINF (results not shown). D, Hippocampal neurons infected with VP16-only lentiviral particles were stained for GFP, NeuN, and GFAP. Green fluorescence shows the colocalization of EGFP with the neuronal marker NeuN and no colocalization with the astrocytic marker GFAP. The same result was obtained with all the caPRTF-expressing LVs (results not shown). E, qRT-PCR demonstrates comparable VP16/GFP expression ratios for all caPRTF viruses with the exception of FOS, which is expressed slightly less efficiently (n = 6 per condition). ***p < 0.01, one-way ANOVA (F(5,30) = 25.692) plus Tukey's post hoc test in the comparison with GFP-only control; &p < 0.01, Tukey's post hoc test in the comparison with VP16-only control. F, Western blot with samples from infected cultured hippocampal neurons and transfected HEK293 cultures. Bars on the left indicate the molecular weight in kilodaltons. Asterisks and arrowheads label the transgenic bands. G, Anti-VP16 immunocytochemistry demonstrates the nuclear expression of chimeric TFs, as exemplified by VP16–CREB. Colocalized pixels are shown in white (right). Bars represent average ± SEM. Scale bar, 10 μm.
For gene profiling, total RNA was extracted from cultures infected with the four caPRTF-expressing LV and with two control viruses expressing only EGFP or coexpressing EGFP and the VP16 domain alone, and hybridized with Mouse Gene ST version 1.0 microarrays. Expression of caCREB caused a dramatic change, affecting ∼10% of the transcriptome (2940 differentially expressed transcripts corresponding to 2680 annotated genes), whereas the other caPRTFs had a more modest effect on gene expression, with 192, 85, and 276 differentially expressed genes for caSRF, caEGR1, and caFOS, respectively (Fig. 3A,B; Table 1). We observed a strong bias toward upregulation for each of the four caPRTFs when only the most affected genes were considered (Fig. 3B), as it may be expected from the expression of constitutively active transcriptional activators. These lists contain both previously identified target genes (e.g., Fos, Bdnf, Vgf, Pdyn, Sst, and several members of the MHC class I for CREB; Arc, Tgln, and all members of the Egr family for SRF; Rrad, Nab1, and Nab2 for EGR1; and Npy and Bdnf for FOS) and a large number of novel target genes. We validated some of these changes by qRT-PCR in independent samples (Fig. 3C). Importantly, there was no single gene differentially expressed by these criteria between the two control conditions (EGFP and VP16 viruses), indicating that VP16 expression by itself had no effect on transcription.

Overview of the CREB, SRF, EGR1, and FOS regulons. A, Hierarchical cluster of PRTF-dependent gene expression changes. B, The distribution of all PRTF-responsive genes as described for Figure 1B. Bars below the distribution plots refer to the percentage of upregulations and downregulations considering only the top 100 genes per condition. Note that, because caEGR1 only controls 85 genes, the analysis is limited to this number. C, Some known and novel candidates were selected for validation on an independent set of samples by qRT-PCR. *p ≤ 0.05, **p ≤ 0.01, ***p ≤ 0.001, t test (n = 3 per condition). Error bars represent average ± SEM.
In addition to the conventional gene-level analysis, we performed an exon-level differential expression analysis (for details, see Materials and Methods) that identified a large number of differentially expressed probeset identifications. These included a strong increase for the probeset mapping into the DBD sequences present in the lentiviral constructs (Fig. 4A), which represents a valuable positive control. Among the candidate genes for differential promoter/exon usage, we found Bdnf, a gene with multiple internal promoters (Aid et al., 2007) for which we confirmed the preferential usage of promoter I over promoter IV by caCREB (Barco et al., 2005; Viosca et al., 2009) (Fig. 4B). In contrast, but in agreement with previous reports of activity-dependent usage of Bdnf promoters (Metsis et al., 1993; Tao et al., 1998), bic and, to a lesser extent, fsk regulate Bdnf expression through both promoters (Fig. 4B). Other relevant examples are Crem, whose analysis at the probeset level demonstrated the specific activation by caCREB and fsk of the internal CRE-bearing promoter that drives the expression of the inducible cAMP early repressor (ICER) protein (Borlikova and Endo, 2009) (Fig. 4C) and Homer1, whose short isoform Homer1a that functions as an inducible dominant-negative form (Brakeman et al., 1997), is specifically regulated by bic and more modestly by caCREB and fsk (Fig. 4D).

Probeset-level analysis of caPRTF-dependent gene expression. A, Increased signal for the specific probeset mapping into the lentiviral construct. EGR1 is not shown because the DBD of this TF is represented by only 2 of 13 probes in a single probe set, precluding this type of analysis. B, BDNF is regulated by CREB preferentially via its promoter I (Pr. I, Prom I), whereas bic and fsk can also regulate its expression through promoter IV (Pr. IV, Prom IV). Left, Yellow boxes represent the exon structure of the gene provided by Ensembl. The location of promoters I and IV, as well as CRE sites, are indicated. Each measurement on the array is separated in the graph by a gray vertical line. Blue lines point to the corresponding mapping. The arrow above indicates the sense of transcription. Right, qRT-PCR validation of differential promoter usage by CREB. *p ≤ 0.05, t test (n = 3 per condition) C, Stimulation with fsk and caCREB expression causes a specific upregulation of ICER transcripts (indicated as a gray box). The location of internal promoter CRE sites is also indicated. The regulation of ICER by caCREB was validated by qRT-PCR with ICER-specific primers in independent samples (n = 3 per condition) and with an ICER-promoter luciferase reporter in cotransfected HEK293 cells (n = 6 per condition). ***p ≤ 0.001, t test. D, bic and fsk stimulations and caCREB expression cause the specific upregulation of the short isoform Homer1a (indicated as a gray box).
Given that the transcriptional changes downstream of caCREB are much broader than those for the other caPRTFs, we analyzed samples from caCREB-expressing neurons at an earlier time after infection (10DIV, but only 3DINF). We might expect a reduction in the number of changes after a shorter expression of the transgene. However, we found that the gene profiles at 3 and 6 DINF were similar (Fig. 5A) and highly correlated (Fig. 5B; 2405 and 2970 differentially expressed genes at, respectively, 3DINF and 6DINF; 82.3% of genes regulated in the same direction at both time points; Pearson's correlation = 0.71, p < 10−16). k-means clustering indicates that, on average, the transcriptional changes have reached a plateau 3DINF (Fig. 5C). The major functional categories represented by genes differentially expressed at 3DINF and 6DINF (∼10% of total) corresponded to general biological processes, including “metabolism,” “development,” “transport,” and “cell communication” (result not shown), likely reflecting the modulatory homeostatic cell response triggered by sustained caCREB expression. These results indicate that the larger gene expression program elicited by caCREB expression genuinely reflects its larger potential to alter the transcriptional status of the neuron and support a central role for CREB in the molecular pathways linking activity and transcription.

Time course of caCREB-dependent gene expression. A, The heat map illustrates the differential expression of hundreds of genes during caCREB expression, both 3 and 6 d after lentiviral infection (Inf.). The top scheme illustrates the experimental design. B, Scatter plot of the fold change correlation between transcriptional changes induced by caCREB after 3 and 6 of infection. C, Box plot representation of average changes in the different set of caCREB regulated genes obtained by k-means clustering. On average, the expression of caCREB for 3 additional days caused a very modest increase of the changes (both upregulations and downregulations) already observed at 3 d of infection.
Direct and indirect targets of caPRTFs
Three computational analyses indicated that the lists of caPRTF-upregulated genes were highly and specifically enriched for direct targets. First, the in silico prediction tool PSCAN (Zambelli et al., 2009), which searches for TF consensus binding sequences in promoter regions, revealed a significant enrichment for CRE, SRE (serum response element), KRE (Krox/Egr regulatory element), and AP-1 sites within the promoter region of caCREB, caSRF, caEGR1, and caFOS-upregulated genes, respectively, but not for downregulated genes (Fig. 6A). KRE sites, similar to GC boxes, were found associated with both upregulations and downregulations in the caCREB, caSRF, and caFOS regulons but specifically and more strongly enriched in the promoter region of EGR1-upregulated genes. Second, GSEA (Subramanian et al., 2005) revealed a very highly significant accumulation of genes bearing the corresponding DNA motif at the top of each gene list (data not shown). Third, we took advantage of the available genome-wide occupancy data generated in cortical neurons for CREB and SRF (Kim et al., 2010) to compare TF binding with our TF-regulated gene lists. We found a greater overlap between the occupancy data and caCREB/caSRF-upregulated genes than for downregulated genes (Fig. 6B).
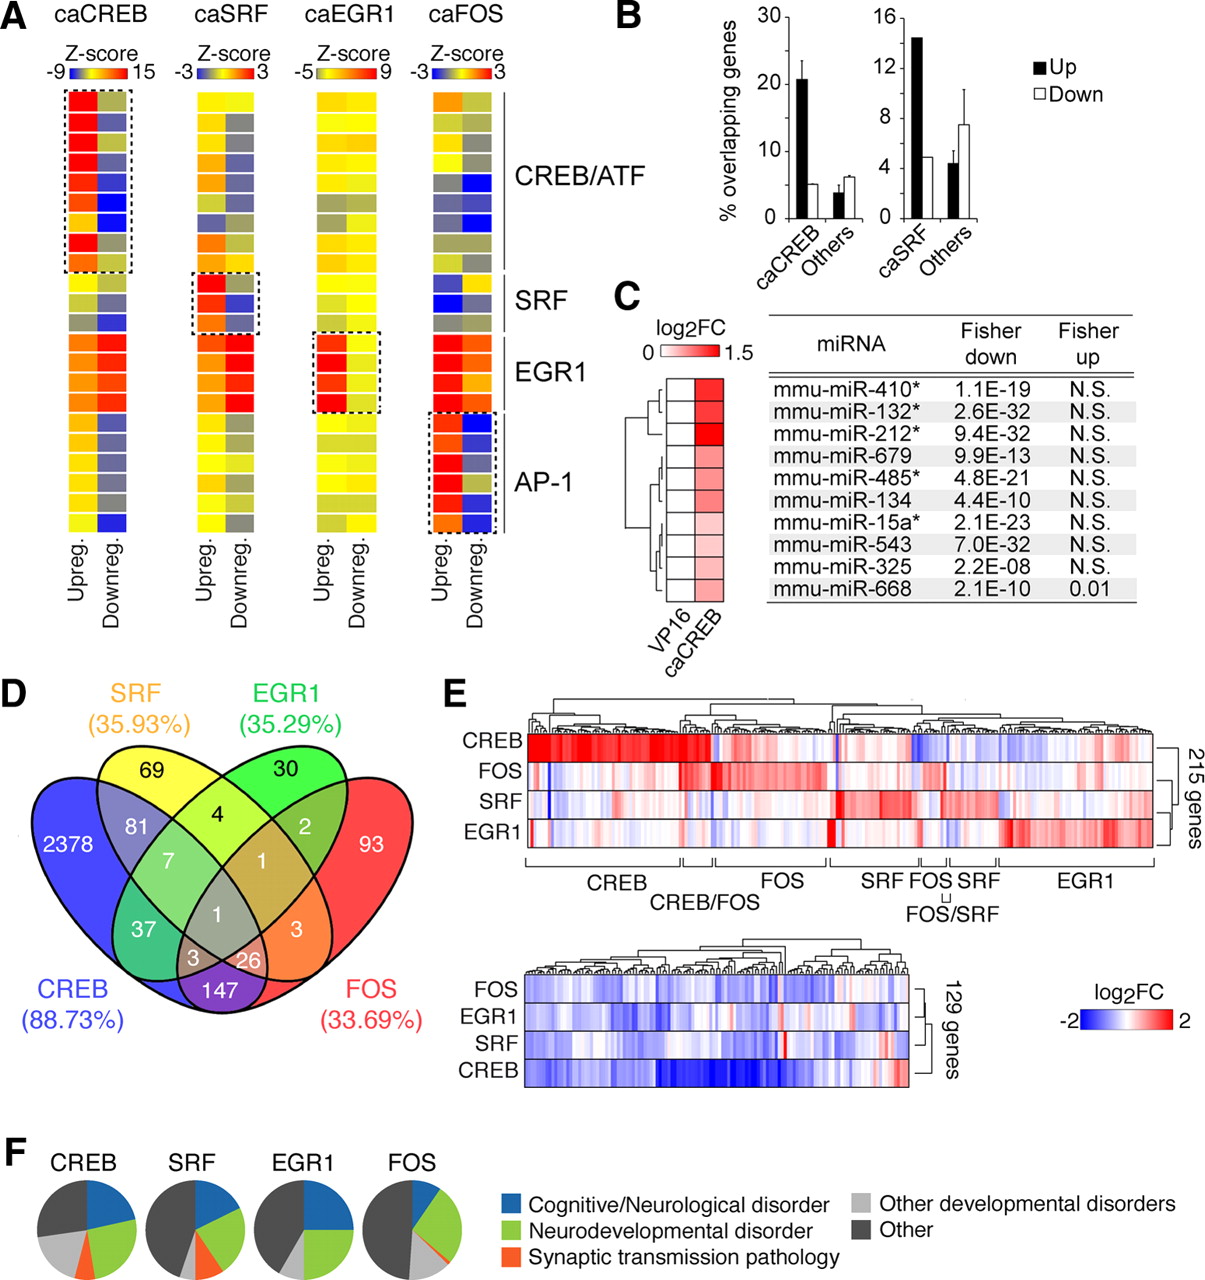
Analysis of the CREB, SRF, EGR1, and FOS regulons. A, TF binding site prediction analysis based on the TRANSFAC database reveals a specific enrichment of the corresponding canonical TF binding site for each TF within upregulated genes. Matrices are grouped by TF (from top to bottom: CREB_02, CREB_Q4, CREBP1_Q2, CREB_Q2, CREB_01, CREBP1CJUN_01, CREBP1_01, ATF_01, ATF6_01, SRF_Q6, SRF_C,SRF_01, EGR3_01, EGR1_01, EGR2_01, NGFIC_01, AP1FJ_Q2, AP1_Q2, AP1_Q6. AP1_01, AP1_Q4, AP1_C). Downregulated genes do not show this enrichment. B, Genes found upregulated by caCREB and caSRF in our study are more likely to bind CREB and SRF, respectively, at their promoters according to a recent chromatin immunoprecipitation sequencing experiment by Kim et al. (2010). For caCREB, we present the average of overlap for the 3DINF and 6DINF gene profiles. “Others” refers to the other three caPRTFs, except caCREB or caSRF, respectively. C, The left heat map illustrates CREB-mediated upregulation of a number of miRNAs. A Fisher's exact test was used to calculate statistical significance of the enrichment of predicted targets within CREB-upregulated and -downregulated genes using the Miranda algorithm from microRNA.org (for details, see Materials and Methods). * indicates statistical significance based on an alternative database for miRNA target predictions (Webgestalt). D, Venn diagram illustrating the overlapping genes between any given pair of conditions. The numbers in parentheses indicate the percentage of unique genes per condition. E, The heat map of genes upregulated in at least one of the conditions show unique clusters of PRTF-induced genes (top), whereas PRTF-repressed genes are less segregated (bottom). F, The Mammalian Phenotype Ontology was used to explore the involvement of PRTF-responsive genes in disease. Enriched categories (p ≤ 0.01) were manually collapsed into more general terms to avoid redundancy (see Materials and Methods). This analysis shows a general implication of the TFs CREB, SRF, EGR1, and FOS in nervous system development and cognitive disorders.
These results also suggest that the genes downregulated in our lists are more likely to be indirect targets of PRTF overactivation. Transcript-level repression is particularly extensive in the case of caCREB (Fig. 3A,B). Interestingly, we noticed the presence of a number of upregulated miRNAs among caCREB-regulated transcripts, including miR134 and miR132/212, which have been recently associated with CREB and neuronal plasticity (Vo et al., 2005; Mazière and Enright, 2007; Wayman et al., 2008; Gao et al., 2010; Hansen et al., 2010; Impey et al., 2010; Lambert et al., 2010; Remenyi et al., 2010). Notably, the bioinformatic tool for miRNA target prediction MiRanda (Enright et al., 2003; Betel et al., 2008) detected a significant enrichment of predicted miRNA targets within CREB-downregulated genes (Fig. 6C), suggesting that CREB-dependent miRNA induction may constitute an important regulatory mechanism of the genetic response to this TF. Similar results were obtained with WebGestalt (Zhang et al., 2005a). Because a single miRNA can potentially target many different transcripts through degradation/stability mechanisms (Guo et al., 2010), a substantial part of the broad transcriptional repression program observed during caCREB expression could be mediated through this mechanism.
Comparison of caPRTF-dependent gene programs and functional analysis
An important aspect of our study in contrast with previously available datasets is the comparability between the different conditions, which allowed us to quantitatively juxtapose the caCREB, caSRF, caEGR1, and caFOS-dependent changes. Direct comparisons between the programs revealed a large percentage of caCREB-regulated genes unique to this TF (∼90%), whereas ∼65% of the caSRF-, caEGR1-, and caFOS-regulated genes were responsive to more than one TF (Fig. 6D). The largest overlap was found between the caCREB and caFOS lists, in agreement with FOS being downstream of CREB. In all cases, most coincident genes were regulated in the same direction in any pair of conditions (60–85%; data not shown). To facilitate comparisons between the different profiles even while the number of caCREB-responsive genes is much larger than for the other caPRTFs, we limited the comparison to the top 100 changes per TF. This revealed a similar percentage of exclusive changes (∼75%) for each TF and limited overlap between the CREB and FOS regulon and between the SRF and both the EGR1 and FOS regulons, consistent with the whole transcriptome comparison level (data not shown). The idiosyncrasy of TF-specific signatures is clearly illustrated by a clustering heat map of genes upregulated in at least one condition (Fig. 6E, top). In contrast, the same representation for downregulated genes showed less divergence, suggesting that some downregulations may be part of a common homeostatic genetic program (Fig. 6E, bottom).
In addition to the comparison of transcriptional profiles, we also performed a comparative analysis of functional terms associated with the different caPRTF-responsive profiles. We first examined the Mammalian Phenotype Ontology, a database that provides disease-related phenotypic annotations for mouse and rat genes in a hierarchical format (Smith et al., 2005). Notably, we found a prominent representation of nervous system development terms and a striking enrichment of cognitive/neurological disorder terms associated with all four PRTFs, with a particular representation of learning-disorder-associated terms (Fig. 6F). We also analyzed functional enrichment based on the GO database. This analysis revealed that, although some general terms were enriched for all caPRTFs, they were represented by different molecular entities/pathways for each TF (Table 2). Thus, for example, the category “signaling pathways and transduction” was enriched for all TFs, but it was represented by “BMP-mediated signaling” in the case of caSRF and “neuropeptide-mediated signaling” for caCREB. Despite the commonalities, we also found certain specific terms associated with each TF [e.g., “cytoskeletal process” within SRF-upregulated genes (Knöll and Nordheim, 2009), “antigen presentation/immune response” within CREB-upregulated genes (Barco et al., 2005), and “learning and memory” and “cell death regulation” within FOS-regulated genes (Shaulian and Karin, 2002)]. This, together with the TF-specific signatures illustrated in Figure 6E, suggests that, whereas all four PRTFs impinge on similar cellular functions, they do so through distinct molecular pathways.
Comparative GO analysis of caPRTF-responsive gene sets
Meta-analysis of activity-driven and caPRTF-dependent gene profiles
We next explored the differential contribution of the four caPRTFs investigated here to the stimulation-driven programs. The combination of the transcription programs associated with each of the four caPRTFs accounted for ∼40–50% of the different stimulation paradigms (Fig. 7A), with CREB being the major contributor to the three activity-dependent programs (Fig. 7B). This was not entirely unexpected considering the larger size of the CREB regulon. To more precisely define the contribution of the different TFs to activity-driven gene expression, we generated “coverage plots” in which we represent the percentage of genes covered by each caPRTF considering stimulus-responsive genes above a certain fold change within upregulations of the stimulus-driven transcriptional programs (Fig. 7C). This representation clearly illustrates the hegemony of CREB in fsk-associated changes, especially when only the strongest changes (right part of the curve) are considered. This analysis also revealed an unexpected relevance of FOS in BDNF-dependent transcription and the substantial contribution of both CREB and SRF to bic-dependent transcription (Fig. 7C). Pairwise correlation analyses, although modest, are in agreement with these observations (Fig. 7D).

Contribution of PRTF-regulated gene expression to activity-dependent transcription. A, Percentages of common genes between the stimulation-driven and caPRTF-dependent gene profiles. B, Specific coverage of activity-driven gene expression profiles by each PRTF. C, Coverage plots illustrate the dominance of CREB-mediated transcription in fsk-dependent gene expression and the remarkable contribution of FOS to BDNF-dependent gene expression. To generate these plots, activity-upregulated genes were ordered by fold change, and the percentage of overlapping genes with each caPRTF-dependent gene list was calculated in a cumulative manner. The lines therefore represent the percentage of the activity-dependent gene expression program “covered” by each TF at any given fold change cutoff. D, Pairwise correlation analysis of stimulation- and PRTF-dependent gene expression further supports the role of CREB in fsk-mediated transcription, as well as the role of FOS in BDNF-mediated transcription. E, Meta-analysis of different stimulation profiles with PRTF-dependent gene expression programs reveals a dominant effect of CREB in neuronal activity-dependent transcription, closely paralleled by FOS. SRF and EGR1, in contrast, appear to be more specific. Normalized enrichment scores (NES) were calculated using GSEA. *p ≤ 0.05 after false discovery rate correction. F, A graphical summary of the main relationships between CREB, SRF, EGR1, and FOS and the different paradigms of activity-driven gene expression analyzed in this study. The line width represents the strength of the association found for the indicated interactions.
To gain additional insight into the role of these four PRTFs in activity-dependent transcription, we reanalyzed previous neuronal activity profiling experiments using GSEA. This computational method can effectively address comparability issues between different platforms and filtering criteria by making use of the information of the complete dataset (Ioannidis et al., 2009; Kauffmann et al., 2009). In addition to the gene profiles in response to different chemical stimuli presented above, we collected five studies in which different types of stimulations were used, including LTP and chemical stimulation paradigms, for comparison with our data (Hansen et al., 2008; Lemberger et al., 2008; Jancic et al., 2009; Ploski et al., 2010; Ryan et al., 2011). We found that SRF was associated with LTP, kainate, and cocaine-mediated stimulation, whereas EGR1 was solely linked with cocaine-mediated induction of gene expression. In contrast, CREB was associated with most forms of activity-dependent gene expression (Fig. 7E), consistent with the view that it acts as a central neuronal signaling hub. FOS also appeared associated to a variety of stimuli, although the enrichment was consistently lower than for CREB, in agreement with the notion that it is a general marker of neuronal activity downstream of CREB (Fig. 7F).
CREB contribution to fsk-dependent gene expression
To define additional causal relationships between specific PRTFs and activity-driven transcriptional programs, we focused on the role of CREB in fsk-mediated transcription. This choice was based on the biological relevance of CREB and cAMP signaling in neuronal function and the very good coverage revealed in our meta-analysis. To gain additional insight into the role of CREB in fsk-dependent transcription, we extended the gain-of-function analysis using caCREB with experiments using an LV that expresses the inhibitor of CREB transcription, A-CREB (Ahn et al., 1998).
A-CREB activity was assessed in HEK293 cells through cotransfection with specific CRE-luciferase reporter plasmids (Fig. 8A). We then proceeded to the production of the recombinant pseudovirus using the same lentiviral vector used to express the caPRTF variants (Fig. 8B). As in previous experiments, 6DINF transgenic expression was maximal without apparently compromising cell viability (Fig. 8C). Western blots using a Flag–M2-specific antibody confirmed the expression of the recombinant protein (Fig. 8D).

Attenuation of fsk-dependent transcription by A-CREB. A, Luciferase reporter assay in HEK293 cells revealed the inhibitory effect of A-CREB expression on fsk-induced, CRE-dependent transcription. #p ≤ 0.001, virus × treatment effect, two-way ANOVA, F(1,26) = 24.211; **p ≤ 0.01, ***p ≤ 0.001, t test. B, Lentiviral construct used for the expression of A-CREB in neurons. LTR, Long-termination repeats; SynP, synapsin promoter; WPRE, woodchunk hepatitis virus post-transcriptional regulatory element. C, Example of GFP/A-CREB-expressing cultured hippocampal neurons. D, Western blot showing A-CREB expression in infected neurons (10DIV, 6DINF). E, Distribution of gene expression changes induced by A-CREB expression under basal conditions (left) and during fsk stimulation (right). F, Hierarchical cluster of GFP/A-CREB DMSO/fsk differential gene expression. G, Scatter plot showing that A-CREB expression causes an attenuation of fsk-dependent changes. More than 70% of genes upregulated in the presence of fsk (right of the red dotted line) are below the diagonal, whereas >80% of genes downregulated in the presence of fsk (left of the red dotted line) are above the diagonal. H, k-means clustering of fsk-responsive genes revealed the existence of different profiles of fsk inducibility and A-CREB attenuation. The bold line indicates the average profile per cluster, and the dashed line indicates the basal level (GFP DMSO); AC, A-CREB. I, A-CREB attenuated genes overlap significantly with caCREB-upregulated genes. The 81 genes in this intersection (red line) are listed in Table 3. There is no gene in the intersection between A-CREB attenuated genes and caCREB-downregulated genes (data not shown). J, The percentage of CREB-responsive genes overlapping with A-CREB attenuated genes (clusters 3; for details, see Results) grows steadily as the stronger CREB-associated changes are considered. K, The genes in the intersection between cluster 3 and caCREB-upregulated genes show a positive correlation between caCREB- and fsk-induced changes that decays in the presence of A-CREB. L, Genes in the intersection between CREB-upregulated and A-CREB attenuated sets are likely to contain a CRE site in their promoter.
To evaluate the effect of CREB inhibition on fsk-induced gene expression, we added samples from A-CREB-infected neurons treated with DMSO or fsk to the fsk profiling experiment and analyzed the data with a 2 × 2 factorial design (two-way ANOVA). Notably, we found that A-CREB by itself caused primarily gene downregulations (Fig. 8E), whereas fsk, regardless of A-CREB presence, mainly resulted in upregulations (Figs. 1B, 8E). Only one gene (Dusp1) was found in the interaction between stimulation and infection. However, the induction profiles clearly showed a global attenuation of fsk-induced changes in A-CREB-expressing cultures (Fig. 8F). This effect was evident for both upregulations and downregulations, as illustrated in the scatter plot for fold changes in fsk-treated cultures (Fig. 8G). In fact, 322 genes met statistical significance in the GFP–fsk versus A-CREB–fsk comparison, most of which (∼74%) were downregulated.
To further characterize this pattern, we performed k-means clustering on fsk-regulated genes. We defined three clusters based on their pattern of fsk inducibility and attenuation by A-CREB (Fig. 8H). Cluster 1, comprising fsk-repressed genes, was essentially unaffected by A-CREB in the basal condition, but the repression by fsk was attenuated in the presence of A-CREB, indicating that fsk-mediated downregulations are also (possibly indirectly) mediated by CREB. The other two clusters corresponded to fsk-induced genes. Whereas cluster 2 was not or very modestly affected by A-CREB expression, cluster 3 defined a group of “A-CREB attenuated” genes. We reasoned that the genes more affected by A-CREB were more likely to be directly downstream of CREB. In agreement with this view, we found a specific and highly significant overlap (p < 10−16) between A-CREB-attenuated and caCREB-upregulated genes (Fig. 8I). This intersection (81 genes) represents 63% of A-CREB attenuated genes and 9% of caCREB-upregulated genes, although this percentage grew steadily as we considered stronger upregulations (Fig. 8J). Indeed, the expression of these 81 genes showed a good correlation between caCREB and fsk samples, which was greatly diminished with fsk/A-CREB samples (Fig. 8K), indicating that these genes are bona fide target genes of CREB likely to play a role in the neuronal response to cAMP increase (Table 3). In agreement with this view, this group of genes scored very high in their probability to contain a CRE site within their promoter region as predicted by PSCAN (Fig. 8L). Overall, our results indicate that fsk-dependent transcription in hippocampal neurons is globally dependent on CREB. However, this TF is not absolutely required for this transcriptional program because A-CREB attenuated but did not block the changes in expression.
Short list of CREB target genes
Discussion
This study provides a genome-wide screen of neuronal activity-driven gene expression in response to different chemical stimuli and downstream of four important PRTFs (CREB, SRF, EGR1, and FOS). The use of a common approach to manipulate the activity of different PRTFs, making their transactivation activity independent of the upstream signaling cascades that normally would regulate it, provides an alternative and innovative way to explore the neuronal gene programs downstream of these TFs under highly comparable conditions. Furthermore, the integration of PRTF- and stimulation-dependent patterns through meta-analysis has allowed us to gain novel insight into the transcriptional networks underlying neuronal activity-dependent gene expression, which is usually disregarded in single-molecule reductionist approaches.
Our screen identified hundreds of novel stimulus-specific activity-regulated transcripts, including novel stimulus-associated miRNAs and candidate genes that may be differentially regulated at the exon/promoter level (e.g., promoter I of the Bdnf gene and the internal promoter within the Crem gene for CREB), uncovering TF-specific signatures and highlighting the uniqueness of the different profiles at the functional level. We found that the changes triggered by caCREB expression were remarkably larger, in both number and magnitude, than for the other caPRTF. This finding together with the meta-analyses of activity-driven gene programs presented in Figure 7 support a key role for CREB as a central signaling hub in the synapse-to-nucleus transduction pathway in neurons. Our data also suggest an important role for CREB-regulated miRNAs in activity-dependent gene expression. Another interesting finding refers to the effect of A-CREB on fsk-dependent gene expression. Although we found a clear attenuation effect that demonstrates the essential role of this TF in the transcriptional response to fsk, the lack of a complete blockade of fsk-dependent gene expression by A-CREB suggests that this TF is sufficient but not absolutely necessary for the induction of this transcriptional program. Overall, our results suggest that, when CREB is available, it is preferentially recruited and mediates an important component of activity-driven gene expression with other TFs, providing additional specificity and combinatorial power. However, when CREB is knocked down or absent, other TFs can compensate for this deficiency, granting a close to normal transcriptional response. Previous gene profiling experiments with CREB knock-outs and A-CREB transgenic mice also support this view (Lemberger et al., 2008; Jancic et al., 2009).
Our study also unveiled significant contributions by SRF, EGR1, and FOS to diverse neuronal-activity driven gene expression programs, as summarized in Figure 7F. Despite their functional convergence, the activity-regulated TFs CREB, SRF, FOS, and EGR1 seem to control distinct gene expression programs with little overlap. Regarding the transcriptional response to different sorts of stimuli, our analyses show that the gene programs triggered by bic and fsk were moderately similar, probably because of common regulation through CREB-dependent transcription, whereas BDNF-driven changes were more related to caFOS-responsive genes.
Previous transcriptomics studies aimed to define the “regulon” of these TFs show great disparity in their conceptual and technical approaches, which significantly constrained comparability and integration of datasets and therefore limited our insight at the molecular systems biology level. CREB is arguably the most intensely studied of these TFs, and great efforts have been made to define its role in transcriptional regulation in neurons (McClung and Nestler, 2003; Impey et al., 2004; Barco et al., 2005; Zhang et al., 2005b; Lemberger et al., 2008; Jancic et al., 2009; Valor et al., 2010). In comparison, the analysis of the neuronal regulon of other PRTFs has received less attention. The few available studies exploring SRF-dependent (Etkin et al., 2006; Stritt et al., 2009; Parkitna et al., 2010) and FOS-dependent (Wu et al., 2004; Paletzki et al., 2008) neuronal gene expression show disparate results and limited overlap, likely because of the technical reasons stated above. A remarkable difference between our screen and those previous studies is the possibility to quantitatively compare the changes triggered by the expression of each one of these PRTFs. In addition, this study is the first one tackling the EGR1 neuronal regulon at the genome-wide level. We are, however, aware of conceptual and technical limitations of our approach. Although our bioinformatic analysis indicates that our gene lists are highly enriched for true direct targets of the different PRTFs, we cannot exclude that unidentified downstream genes escaped our screen because of the requirement of cofactors (e.g., JUN for FOS or the components of SRF ternary complex). In fact, our analyses exploring the relative contribution of each PRTF to the different stimulation programs indicate that there must be additional TFs involved in the regulation of bic-, fsk-, and BDNF-dependent gene expression, because we covered only ∼40–50% of each program with the caPRTF datasets. In addition, there may be additive or synergistic effects that our experimental approach does not address. The analysis of additional PRTFs would likely further increase this coverage.
The larger size of the CREB regulon suggests more abundance of functional binding sites for this TF in the mouse genome. In silico studies have estimated the number of CRE binding sites in the order of tens of thousands (Euskirchen et al., 2004; Zhang et al., 2005b), whereas for other PRTFs, binding site frequency estimation ranges from thousands in the case of EGR1 and FOS (Zhou et al., 2005; Pfenning et al., 2007) to hundreds in the case of SRF (Sun et al., 2006). However, these differences may be attributable to the use of different spans of the region upstream of the TSS (transcription start site) in the scanning for potential binding sites. The cisRED database for conserved regulatory elements (Robertson et al., 2006) indicates that the number of regions in the mouse genome containing the motifs corresponding to these four PRTFs is similar, ranging from 3360 for CREB to 1703 for AP-1 (FOS). Chromatin immunoprecipitation experiments suggest that the effective number of CREB-occupied sites may be lower than predicted by in silico approaches (Impey et al., 2004; Zhang et al., 2005b). A recent study comparing occupancy in the neuronal genome for two of the PRTF investigated here indicates that CREB is bound to approximately twice as many promoters as SRF (Kim et al., 2010). Our expression data indicate that not only may CREB have more binding sites in the genome, but it also triggers a much broader downstream program. The common VP16 tag included in our constitutively active chimeric proteins enables future studies comparing the distribution and occupancy in the neuronal genome of these four PRTFs using chromatin immunoprecipitation sequencing technology, which would identify their direct targets.
Overall, our study provides novel insight into the composition of the regulon of four relevant PRTFs and their relative contribution to different activity-dependent gene expression programs. These datasets can therefore be of great interest to researchers working on different aspects of activity-dependent neuronal function.
Notes
Supplemental material for this article is available at http://in.umh-csic.es/NADtranscriptomics/. This material has not been peer reviewed.
Footnotes
Research at the Barco laboratory is supported by Spanish Ministry of Science and Innovation Grants BFU2008-00611, CSD2007-00023, and SAF2008-03194-E (part of the coordinated ERA-Net NEURON project Epitherapy). E.B. had a Gobierno Vasco fellowship, and L.M.V. has a Ramón y Cajal contract given by the Spanish Ministry of Science and Innovation. We thank members of the Barco laboratory and the Huber laboratory for helpful discussion, Dr. Gómez-Scholl for his help in lentivirus production, and Dr. Oliver Schlüter and Dr. Javier de las Rivas for the critical reading of this manuscript.
- Correspondence should be addressed to Angel Barco, Instituto de Neurociencias de Alicante, Universidad Miguel Hernández/Consejo Superior de Investigaciones Científicas,, Campus de Sant Joan, Apartado 18, Sant Joan d'Alacant 03550, Alicante, Spain. abarco{at}umh.es


