Article Text

Abstract
Background & objectives Hepatocellular carcinoma (HCC) is the second leading cause of cancer death worldwide. Several types of chronic liver disease predispose to HCC, and several different signalling pathways have been implicated in its pathogenesis, but no common molecular event has been identified. Ca2+ signalling regulates the proliferation of both normal hepatocytes and liver cancer cells, so we investigated the role of intracellular Ca2+ release channels in HCC.
Design Expression analyses of the type 3 isoform of the inositol 1, 4, 5-trisphosphate receptor (ITPR3) in human liver samples, liver cancer cells and mouse liver were combined with an evaluation of DNA methylation profiles of ITPR3 promoter in HCC and characterisation of the effects of ITPR3 expression on cellular proliferation and apoptosis. The effects of de novo ITPR3 expression on hepatocyte calcium signalling and liver growth were evaluated in mice.
Results ITPR3 was absent or expressed in low amounts in hepatocytes from normal liver, but was expressed in HCC specimens from three independent patient cohorts, regardless of the underlying cause of chronic liver disease, and its increased expression level was associated with poorer survival. The ITPR3 gene was heavily methylated in control liver specimens but was demethylated at multiple sites in specimens of patient with HCC. Administration of a demethylating agent in a mouse model resulted in ITPR3 expression in discrete areas of the liver, and Ca2+ signalling was enhanced in these regions. In addition, cell proliferation and liver regeneration were enhanced in the mouse model, and deletion of ITPR3 from human HCC cells enhanced apoptosis.
Conclusions These results provide evidence that de novo expression of ITPR3 typically occurs in HCC and may play a role in its pathogenesis.
- liver cancer
- calcium signaling
- methylation
- cell growth
- apoptosis
Statistics from Altmetric.com
Significance of this study
What is already known on this subject?
Liver cancer is the second most common cause of cancer death worldwide. Although a few non-overlapping signalling pathways contribute to its pathogenesis, no final common pathway to the development of this cancer is known. Calcium signalling mediated by intracellular calcium channels of the inositol 1, 4, 5-trisphosphate receptor (ITPR) family controls the balance between cellular proliferation and cell death in other types of malignancies but its role in liver cancer has not been explored.
What are the new findings?
The intracellular calcium channel type 3 isoform of the ITPR (ITPR3), which is nearly absent in healthy liver, becomes expressed during the development of liver cancer in multiple cohorts of patients with liver cancer and in a mouse model.
This new expression of ITPR3 is due to demethylation of its promoter and results in enhanced calcium signalling and less apoptosis, as well as impaired patient survival.
How might it impact on clinical practice in the foreseeable future?
These findings suggest that expression of ITPR3 in hepatocytes may be part of a final common pathway in the development of liver cancer and its expression and downstream subcellular calcium signals may be novel targets for therapeutic intervention.
Introduction
Hepatocellular carcinoma (HCC) is distinguished from most types of malignancy in several ways. First, its incidence is rising,1 which has been attributed in part to the widespread occurrence of hepatitis B and C worldwide, plus the increasing frequency of non-alcoholic fatty liver disease (NAFLD). Second, the 5-year survival rate has not increased significantly during the past 30 years and remains in the 12%–15% range. Third, tissue biopsy generally is neither required nor obtained to diagnose HCC,2 so molecular profiling of this type of malignancy is not part of most standard treatment strategies. However, there is growing recognition of the fact that there is the variability of behaviour among HCCs and that a better understanding of what governs this behaviour could lead to more effective targeted treatment strategies.3 Ca2+ signalling regulates processes important for tumour growth, including cell proliferation4 5 and apoptosis,6 7 and several studies have implicated Ca2+ signalling pathways in HCC in particular. Inositol 1, 4, 5-trisphosphate receptors (ITPRs) are the intracellular Ca2+ channels expressed in hepatocytes.8 ITPR2 is the dominant isoform and localises to the apical region where it regulates secretion,9 10 whereas ITPR1 is localised to the endoplasmic reticulum (ER)–mitochondrial interface where it regulates lipid metabolism.11 ITPR3 is absent or expressed at low levels in normal hepatocytes,8 but alterations in its expression are thought to play a causal role in a number of other types of malignancies including colon cancer,12 melanoma,7 mesothelioma and prostate cancer.6 Here we investigated whether and how ITPR3 is involved in the pathogenesis of HCC.
Methods
DNA methylation profile analysis
Publicly available data banks were used for bioinformatics analysis of DNA methylation levels in the promoter region of human ITPR genes. Control individuals were selected from the Gene Expression Omnibus and comprised individuals between 33 and 57 years of age, 47% women and 53% men (n=23) with no history of liver inflammation or fibrosis. For patients with liver cancer, a subset of 40 patients were chosen at random from The Cancer Genome Atlas (TCGA) database. Their demographics (mean age 59 years, 65% men, 48% stage I disease) were similar to that of the entire database. In both data banks, the levels of DNA methylation (beta value) were accessed using genomic DNA from the total liver and the Illumina Human Methylation 450 method. CpG islands within the promoter of each ITPR gene were selected based on the following ID_REF sequences: ITPR1 (cg24699271; cg03918306; cg04251662; cg06716686; cg09407429; cg14643330; cg21024916; cg21858376), ITPR2 (cg02569086; cg03966406; cg16175911; cg18238734; cg24082826; cg25960567) and ITPR3 (cg02066343; cg02084729; cg02478409; cg03489495; cg05234888; cg08355863; cg09209803; cg12650926; cg12913957; cg14639225; cg16400825; cg19889152; cg20706766; cg22065976; cg24603235; cg27193704). The percentage of CpG islands in the ITPR3 promoter region was obtained using the Ensembl genome browser.
Analysis of survival data of patients with HCC
Data generated from the TCGA Research Network (http://cancergenome.nih.gov/) were used to divide patients into two groups based on ITPR3 mRNA expression levels. The first group consisted of 39 out of 370 patients (10.5%) with elevated ITPR3 expression (z>1.0 as the cut-off). The remaining 331 patients (z<1.0) were grouped as normal ITPR3 expression. Overall and disease-free 5-year survival curves for each group were plotted in GraphPad Prism.
Animal studies
Swiss male mice (8–10 weeks old) were used for the treatments with the DNA methylation inhibitor 5′azacitidine (5′-aza). Animals were housed under a 12-hour light–dark cycle, with ad libitum access to standard diet and water. The treatment group received daily i.p. injection of 5′-aza (2 mg/kg of body weight) for 7 days. Control mice were injected with sterile saline. Body weight was monitored daily and animals were sacrificed on day 8 for collection of liver tissue and blood samples. Similarly, male Floxed ITPR3 (FloxR3), kindly provided by Dr Ju Chen (University of California, San Diego, California, USA)13 and liver-specific ITPR3 knock out (LSKO3) mice on C57/BL6 background were subjected to the same 5′-aza treatment prior to partial hepatectomy (PH). LSKO3 were generated by crossing FloxR3 mice with Albumin Cre (Jackson Laboratories, Bar Harbor, Maine, USA) as reported previously.11 For the induction of HCC, 2-week-old male C57/BL6 mice (Jackson Laboratories) were injected with a single intraperitoneal dose of diethylnitrosamine (50 mg/kg of body weight). Control animals were injected with sterile saline. Animals were killed at 6, 9 and 12 months after the injection for tissue collection and analysis.
Four-week-old NCR nude female mice (average body weight, 20 g) were obtained from Charles River (Worcester, Massachusetts, USA) and acclimated to laboratory conditions 1 week before tumour implantation. Nude mice were maintained in accordance with the Institutional Animal Care and Use Committee procedures and guidelines. HepG2 tumour xenografts were established by subcutaneous injection of 5×10⁶ HepG2 cells/site (wild type (WT) or ITPR3KO) in each mouse. Starting at 14 days postinjection, HepG2 tumours were measured daily using a calliper and the body weights of the mice were monitored as well.
Culture of primary hepatocytes
Mouse hepatocytes were isolated from livers of male Swiss mice after 5′-aza treatment. Briefly, livers were perfused with Hanks A and then Hanks B medium containing 0.05% collagenase (Roche Applied Science) and passed through a 40 µm nylon mesh filter to yield primary hepatocytes in suspension. Hepatocytes were then plated on collagen-I-coated coverslips at 37°C in 5% CO2/95% O2 in Williams’ medium E (Thermo Fisher Scientific) containing 10% fetal bovine serum, 50 units/mL penicillin and 50 g/mL streptomycin. Hepatocytes were used 4–6 hours after isolation, as previously described.14
Serum chemistries
Mouse serum was obtained by centrifugation of total blood and used to assess liver function through the following panel of serological tests: alkaline phosphatase (Bioclin, Brazil), alanine aminotransferase (Labtest, Brazil), aspartate aminotransferase (Labtest, Brazil) and gamma-glutamyl transferase (Labtest, Brazil), as previously described.15
Immunoblotting
Western blots of hepatocyte and liver cancer cell lysates were performed as previously described.16
DNA methylation of the mouse ITPR3 promoter region
Genomic DNA was extracted from isolated hepatocytes using DNeasy Blood & Tissue Kit (QUIAGEN) according to the manufacturer’s instruction. A total of 1 µg of genomic DNA was treated with bisulfite using the EZ DNA Methylation Kit (Zymo Research), as reported,17 which converts unmethylated cytosines into uracil. The promoter region of ITPR3 was amplified by conventional PCR using the forward primer 5′-AAGCCGTCTAGAGAACGCCC-3′ and reverse primer 5′-CCACACACATGCAAATCCCG-3′. The efficiency of DNA amplification was monitored using a 1% agarose gel electrophoresis followed by capillary electrophoresis sequencing in an ABI3730 apparatus using POP7 polymer and BigDye V.3.1. Sequencing data were analysed using Sequence Scanner Software (Applied Biosystems).
Real-time PCR
Total mRNA of isolated hepatocytes was extracted using Trizol reagent (Sigma Aldrich) according to the instructions of the user manual. cDNAs were generated from 1 µg RNA using the High-Capacity cDNA Reverse Transcription Kit (Life Technologies). Real-time PCR analyses were carried out with SYBR Green PCR Supermix (Bio-Rad) using PCR primers on a CFX96 Real-Time PCR system (Bio-Rad). Mouse ITPR3 primers were used and the relative mRNA expression was determined by the comparative Ct method using Bio-Rad software (Bio-Rad) with beta-actin as the reference gene.
RNA sequencing and enrichment analysis
Total RNA was isolated from WT and ITPR3KO HepG2 cells (five biological replicates/each) using the RNeasy kit (Qiagen, Germantown, Mayland, USA). RNA integrity number was determined by Agilent Bioanalyzer 2100 (Agilent Technologies). On average, 30 million sequencing reads (100 bp paired-end) of each sample were obtained using an Illumina 6000 Sequencer and the reads were mapped to the University of California Santa Cruz hg19 human genome by STAR (2.5.4b-foss-2016b),18 87.77% of which were uniquely aligned to the reference. The raw read counts of genes were counted using subread (1.6.4)19 based on National Center for Biotechnology Information RefSeq annotation. Within R Bioconductor, edgeR package was applied to normalise raw read counts, and log2 transformed counts per million represent the relative expression level of individual genes.20 The limma package was used to detect differential expression between the groups;21 linear modelling was applied with subsequent empirical Bayesian analysis p-value adjustment for multiple testing. Pathways enrichment of significant differentially expressed genes (p≤0.05) in different gene subsets was determined by IPA (Ingenuity Pathway Analysis, QIAGEN). The apoptosis (GO:0006915, 2764 genes)-related genes were defined by QuickGO (https://www.ebi.ac.uk/QuickGO/).
Immunofluorescence
Isolated hepatocytes were plated onto six-well plates containing glass coverslips treated with collagen type I solution (Sigma) and 4–6 hours later cells were fixed with 4% paraformaldehyde (Electron Microscopy Science) and permeabilised with 0.5% Triton X-100 (Sigma). After washing in phosphate buffered saline (PBS), unspecific binding was blocked using PBS, 10% BSA, Triton X-100 0.05% and 5% goat serum for 1 hour at room temperature. Immunolabelling with primary ITPR3 monoclonal antibody (1:100; Millipore) was performed for 1 hour at room temperature, followed by 1-hour incubation at room temperature with goat antimouse secondary antibody conjugated with Alexa Fluor 488 (1:200; Life Technologies) and TO-PRO3 (1:1000; Thermo Fisher Scientific) as nuclear staining. Controls in which primary antibodies were omitted showed no specific staining. Images were collected on a Zeiss LSM 510 confocal microscope, as previously described.16
Immunohistochemistry
Formalin-fixed and paraffin-embedded mouse and human liver tissue sections were de-waxed and antigen retrieval was performed in citrate buffer (10 mM) containing 0.6% hydrogen peroxide. The Novolink Polymer Detection System (Leica Biosystems, Germany) was used in the subsequent steps as described previously.15 Primary antibodies against ITPR3 (1:100; Sigma), proliferating cell nuclear antigen (PCNA) (1:100; Abcam) and 5′-methylcytosine (5mC) (1:400; Zymo Research) were incubated overnight at room temperature followed by incubation with detection polymer for 40 min at room temperature. DAB was used for signal detection. Images were obtained using an optical microscope (Zeiss, Germany) at with a 20× objective. Human liver tissue samples were from three independent cohorts of liver specimens obtained from: (1) Hospital das Clínicas, UFMG; (2) Department of Pathology – Yale New Haven Hospital on approval by the respective human investigation committees; (3) a 40-patient tissue array purchased from US Biomax (Derwood, MD). For quantification purposes of all histological staining, fields of view were chosen by a blinded investigator and the quantification was performed by a different investigator to minimise bias.
In vivo calcium measurements
Animals were anaesthetised with a mixture of ketamine (10%) and xylazine (5%). Livers were loaded with the Ca2+ indicator dye Fluo-4/AM (Thermo Fisher Scientific) for 10 min at room temperature and placed onto the stage of a Nikon A1 confocal microscope, as described previously.15 Arginine vasopressin (AVP), a known InsP3-dependent Ca2+ release agonist,22 23 was injected IV at a concentration of 100 ng/mL to trigger InsP3-dependent Ca2+ release. Data are expressed as fluorescence/baseline fluorescence×100%. Hepatocytes surrounding the central vein and within a radius of two times the average size of individual hepatocytes were defined as pericentral (PC). The remaining hepatocytes were classified as belonging to the periportal (PP) region.
Partial hepatectomy
PH was carried out as described.24 At 48 hours postsurgery, livers were removed and fixed in 10% neutral buffered formalin and embedded in paraffin for PCNA staining. For quantification of the zonal distribution of PCNA staining, PP and PC zones were defined as areas of twice the radius of the nearby portal and central veins, respectively.
Knockout of ITPR3 by CRISPR/Cas9 in human cells
A commercially available CRISPR/Cas9 system was used to knock out ITPR3 in HepG2 liver cancer cells (Santa Cruz Biotechnology). Briefly, cells were cotransfected with a plasmid containing the ITPR3-specific guide RNA and the sequence encoding the Cas9 nuclease alongside a plasmid which promotes the insertion of red fluorescent protein (RFP) and puromycin resistance sequences via homology-directed repair within the deleted loci in the ITPR3 gene. After 2 weeks, cells were subjected to fluorescence-activated cell sorting and red fluorescent cells were sorted and cultured under puromycin (1 µg/mL) selection following a limited dilution protocol. On expansion, RFP-positive clones were subjected to Western blot analysis of ITPR3 to verify successful knock out. Successful deletion of exon 3 of the ITPR3 gene and correct integration of the sequences coding for RFP and puromycin resistance were confirmed by PCR amplification followed by automated DNA sequencing. Control HepG2 cells are referred to as WT and correspond to non-transfected cells cultured in media without Puromycin. Cells depleted of ITPR3 are referred to as ITPR3KO. Cells were grown in Dulbecco Modified Eagles Media supplemented with L-glutamine (1 mM), fetal bovine serum (10% v/v) and penicillin/streptomycin (100 units/mL and 100 mg/mL) at 37°C in a humidified atmosphere containing 5% CO2.
Apoptosis
WT and ITPR3KO cells were treated with dimethyl sulfoxide (vehicle control), staurosporine (STA, 5 µM) or etoposide (10, 25 and 50 µM) for 16 hours followed by luminescence measurements of Caspase 3/7 activity using the Caspase-Glo 3/7 assay (Promega, Madison, Wisconsin, USA) according to the manufacturer’s instructions, in a BioTek Synergy 2 plate reader. Additionally, control and STA-treated cells were stained with Annexin V-FITC conjugated antibody and counted in fluorescence-activated cell sorter (FACS; BD LSRII). Results are expressed as percentage of Annexin V positive cells relative to total cell count. HepG2 cells were mock-transfected or transfected with a mCherry-tagged rat ITPR3 plasmid, a gift from David Yule (University of Rochester Medical Center, Rochester, New Yoyk, USA). One day after transfection, cells were treated with STA (5 M for 6 hours) followed by incubation with Yo-Pro-1 and imaged on a Zeiss Axio Observer Z1 epifluorescence microscope with a 20× objective to detect apoptotic cell death. The number of Yo-Pro-1-positive cells in 8–14 fields was counted in Image J and is expressed as the percentage of total cells. Primary hepatocytes isolated from control and 5′-aza-treated animals were exposed to vehicle or STA. Cleaved caspase 3 expression was then evaluated in total cell lysates as a marker of apoptosis.
Colocalisation of ITPR3 and mitochondria in HepG2 cells
HepG2 cells were cotransfected with enhanced green fluorescent protein (EGFP)-ITPR3 (a gift from Colin W. Taylor, University of Cambridge, UK)25 and the outer mitochondrial membrane marker mKO2-TOMM20 (a gift from Michael Davidson to Addgene—plasmid # 57899). The cells were imaged on a Zeiss LSM 880 AiryScan Fast Confocal (Zeiss Microscopy, Thornwood, New York, USA) with a 63X/1.4NA objective and excitation of 488 nm and 561 nm for EGFP and KO2, respectively. The emission signals were collected between 495 and 550 nm (EGFP) and >570 nm (KO2) on the AiryScan detector and processed for improved (~140 nm) resolution using the built-in super-resolution algorithm in ZEN Black software. Mander’s coefficient of colocalisation between EGFP and KO2 was calculated with the Coloc2 plug-in in ImageJ (National Institutes of Health) in a total of 25 cells from 3 independent transfections.
Statistical analysis
Data are presented as arithmetic mean ±SD unless otherwise indicated. For statistical analysis, means between two groups were compared by t-test or Mann-Whitney non-parametric test as specified in the online supplementary figure legends. Comparison of multiple groups was performed by one-way analysis of variance with Bonferroni post-tests. A p-value of ≤0.05 was taken to indicate statistical significance.
Supplemental material
Results
ITPR3 was absent in normal human hepatocytes (online supplementary figure 1), but was present in samples of patient with HCC (figure 1A) and cell lines (online supplementary figure 1). ITPR3 was present regardless of whether the underlying liver disease was hepatitis B virus, hepatitis C virus (HCV), NAFLD or alcoholic liver disease (ALD), which are the four most common predisposing factors to the development of HCC.26 Histological scoring of ITPR3 staining was significantly increased in HCC specimens from patients with non-alcoholic steatohepatitis and HCV relative to non-HCC controls (figure 1B). In the second cohort, ITPR3 staining was significantly increased in the tumour area, relative to non-tumour adjacent tissue (NAT; figure 1C,D). To begin to investigate the clinical relevance of this de novo expression, the relationship between ITPR3 expression in HCC and patient survival was examined using data from TCGA. ITPR3 expression was >1 z above the mean for patients with HCC in 11% (39 of 371) of the samples, and both 5-year overall and disease-free survival were significantly reduced in this patient group (figure 1E,F). Because normal hepatocytes express ITPR1 and ITPR2 and low to undetectable levels of ITPR3,8 the expressions of all three ITPRs were compared between normal and HCC samples from the TCGA repository. ITPR3 mRNA expression was significantly increased in HCC relative to control specimens, whereas ITPR1 and ITPR2 expressions were similar between the two groups (figure 1G). Also, the increased ITPR3 expression in HCC was more pronounced in disease stages II and III, according to the TNM criteria (figure 1H). To understand whether ITPR3 expression precedes HCC, expression was examined in liver specimens from the third cohort of patients, with chronic liver disease from HCV or ALD. With either disease, nearly half of the specimens from patients with cirrhosis without HCC expressed ITPR3, whereas nearly all specimens from patients with HCC expressed ITPR3. In contrast, ITPR3 was not expressed in patients with glycogen storage disease (GSD), a chronic liver disease that does not typically predispose to HCC in the absence of cirrhosis, such as the patients studied here27 (figure 1I and online supplementary figures 2A, B). Moreover, expression of ITPR3 increased with the degree of fibrosis (figure 1J), although it did not correlate with inflammatory activity in the same specimens (figure 1K). Additionally, ITPR3 expression preceded tumour formation in a mouse model of HCC (online supplementary figure 3A). These findings collectively suggest that de novo expression of ITPR3 is a common feature of human HCC, precedes its development, and is associated with the degree of fibrosis and with a poorer disease outcome.
Supplemental material
Supplemental material
Supplemental material

ITPR3 is expressed in human HCC and is associated with poorer survival. (A) ITPR3 expression in a histologically normal liver biopsy (top left) and an HCC specimen (top middle). Bottom row showing a magnified view of the regions marked with the black square in the top row. Bottom left showing ITPR3 expressed in the apical region of a bile duct in the normal liver specimen (arrow) but is minimal in surrounding hepatocytes. Bottom middle showing that there is diffuse cytosolic staining of ITPR3 in HCC hepatocytes. Top and bottom right showing a negative control (scale bar, 20 µm). (B) Quantification of ITPR3 staining showing that labelling is significantly increased in HCC specimens from patients with NASH and HCV (p<0.05, n=15 and p<0.01, n=6, respectively by ANOVA with Dunnett’s post-test) relative to control specimens (n=17). The remaining samples were: alcoholic liver disease (n=5) and HBV infection (n=2); additionally, two specimens were from patients in which two of these liver diseases were present. (C) ITPR3 staining in HCC (tumour) and NAT in a representative image from a commercially obtained tissue microarray (scale bar, 200 µm). (D) ITPR3 staining of HCC was significantly increased relative to the correspondent NATs. (n=40, p<0.01 by paired t test). (E) Five-year survival is reduced in patients with HCC with ITPR3 mRNA expression with z>1 above the mean (median=37.3 months, n=39) in comparison to all other patients with HCC (median=60.8 months, n=332; p<0.01 by log-rank test). (F) Disease-free survival is also decreased in patients with HCC with higher ITPR3 expression (median=10.4 months in high ITPR3 versus median=23.0 months in other patients with HCC; p<0.004 by log-rank test). (G) mRNA expression of ITPR1–3 in control (n=26) and patients with HCC (n=89). ITPR1 and ITPR2, which are physiologically expressed in hepatocytes, are not altered in HCC, but ITPR3 expression is significantly increased in HCC (p<0.05, Bonferroni post-tests). (H) mRNA expression of ITPR3 correlates with the clinical stage of HCC. mRNA levels of ITPR1 and ITPR2 are similar in clinical stages I-III. However, mRNA of ITPR3 is significantly increased in stage II and stage III compared with control (**p<0.05 and ***p<0.001, Bonferroni post-tests, respectively). (I) Representative images of ITPR3 staining in specimens collected from Universidade Federal de Minas Gerais diagnosed with GSD (n=10), and different stages of the of HCV infection, such as fibrosis (n=20), cirrhosis (n=20) and tumour (n=20). ITPR3 was not detected in GSD hepatocytes, even though it was expressed in cholangiocytes (inset) (scale bar, 50 µm). (J) Quantification of ITPR3 staining according to the degree of fibrosis showing that ITPR3 starts to be expressed as early as in moderate fibrosis and remains elevated until the tumour stage in specimens from HCV-infected patients (**p<0.05, ***p<0.01 and ****p<0.001). (K) ITPR3 expression is not correlated to inflammatory activity in HCV infection specimens. ALD, alcoholic liver disease; ANOVA, analysis of variance; GSD, glycogen storage disease; HBV, hepatitis B virus; HCC, hepatocellular carcinoma; HCV, hepatitis C virus; IPTR1, type 1 isoform of the inositol 1, 4, 5-trisphosphate receptor; IPTR2, type 2 isoform of the inositol 1, 4, 5-trisphosphate receptor; IPTR3, type 3 isoform of the inositol 1, 4, 5-trisphosphate receptor; NASH, non-alcoholic steatohepatitis; NAT, non-tumour adjacent tissue.
To study the role of ITPR3 on tumour growth in vivo, a HepG2 HCC cell line was developed in which the ITPR3 gene was deleted using CRISPR/Cas-9 (ITPR3KO). Loss of ITPR3 was confirmed by western blot and by expression of red fluorescent protein (RFP) that was inserted in the genome alongside the CRISPR targeting cassette on successful recombination. WT or ITPR3KO HepG2 cells were implanted subcutaneously in nude mice and tumour growth was assessed over time. Tumour growth was monitored over a 1-week period, once all implanted tumours became visible (42 days). During the week in which HCC growth was monitored, five of six WT tumours grew, whereas only three of eight ITPR3KO tumours grew. Total tumour volume was significantly lower in animals implanted with ITPR3KO cells when compared with mice bearing WT HepG2 cells (online supplementary figure 3B).
Both transcription factors and miRNAs that decrease ITPR3 expression have been identified,28–30 but factors that increase ITPR3 are not known. Bioinformatic analysis showed that the ITPR3 promoter region has a number of CpG islands (figure 2A), which are potential methylation sites capable of suppressing gene expression.31 In most of the 16 regions analysed (figure 2B), DNA methylation levels were lower in hepatocytes from patients with HCC than in normal controls (figure 2C). In contrast, the promoter regions of ITPR1 and ITPR2 were already demethylated in hepatocytes from normal control individuals (figure 2D and online supplementary figure 4), consistent with the observation that ITPR1 and ITPR2 are normally expressed in hepatocytes.8–10 To investigate more directly the role of DNA methylation in hepatic ITPR3 expression, 5′-aza was used to inhibit DNA methyltransferases in vivo (figure 3A).32 This protocol decreased DNA methylation levels, reflected by a decrease in 5mC staining (figure 3B,C) as well as demethylation of specific CpG islands in the ITPR3 promoter (Figure 3D; Figure 3E), and without evidence for non-specific liver damage (online supplementary figure 5). Similarly, 5mC levels were decreased in HCC specimens when compared with non-cirrhotic GSD controls (Figure 3F; Figure 3G). Together, these results indicated that inhibition of DNA methyltransferase efficiently demethylates ITPR3 promoter and that 5mC levels are decreased in HCC.
Supplemental material
Supplemental material

The promoter of human ITPR3 is demethylated in HCC. (A) CpG islands in the promoter region of the human ITPR3 gene. The lower line indicates 0% likelihood of a CpG island and the upper line indicates 100% likelihood. (B) Schematic representation of 16 methylated regions in the ITPR3 promoter, analysed by bioinformatics using GEO data for control patients and TCGA data for patients with HCC. (C) Methylation of the ITPR3 promoter from patients with HCC (n=40) is lower than in control patients (n=23) at 16 different sites (*p<0.05, Bonferroni post-tests). (D) Percentage methylation of the promoter region of the human ITPR1, ITPR2 and ITPR3 genes. HCC values are relative to that observed in controls. GEO, Gene Expression Omnibus; HCC, hepatocellualr cancer; TCGA, The Cancer Genome Atlas.

DNA methylation levels are decreased in HCC and in mice treated with 5′-aza. (A) Experimental protocol of 5′-aza treatment in mice. (B) Immunoblot of hepatocyte lysates demonstrating reduction of total methylated cytosine (5mC) after treatment with 5′-aza. (C) Densitometric analysis showing ~50% reduction in methylation after 5′-aza treatment (n=3, *p<0.05, Bonferroni post-test). (D) Demethylation sites of CpG islands in the mouse ITPR3 promoter region after 5′-aza treatment. Black dots represent methylated sites and white dots represent demethylated sites (n=3 animals for each condition). (E) Percentage of methylated CpG (mCpG, black) and demethylated CpG (white) in the promoter region of the mouse ITPR3 gene. (F) Representative images of immunostaining for 5mC in livers from patients with GSD (n=10), and different stages of HCV infection, including fibrosis (n=20), cirrhosis (n=20) and tumour (n=20) (scale bar, 50 µm). (G) Quantification of nuclear 5mC staining showing that methylation is markedly decreased in HCV-related cirrhosis and tumour compared with GSD and HCV-related fibrosis (***p<0.01 and #p<0.001, Bonferroni post-tests). 5′-aza, 5′-azacitine; GSD, glycogen storage disease; HCC, hepatocellular carcinoma; HCV, hepatitis C virus; ITPR3, type 3 isoform of the inositol 1, 4, 5-trisphosphate receptor.

Demethylation induces ITPR3 expression in hepatocytes in vivo. (A) ITPR3 mRNA expression in isolated hepatocytes is significantly increased after 5′-aza treatment, relative to controls (n=5 in each group, *p<0.05, Bonferroni post-tests). (B) ITPR3 staining (green) in isolated mouse hepatocytes from control liver and after 5′-aza treatment demonstrating the subcellular pattern of ITPR3 expression. Nuclei are shown in blue. (scale bar, 10 µm). (C) Immunoblot of liver lysates showing the presence of ITPR3 in the nuclei of hepatocytes after the demethylation treatment. (D) Densitometric analysis showing cytosolic and nuclear expression of ITPR3 in hepatocytes in 5′-aza-treated hepatocyte lysate (*p<0.05 and **p<0.01, Bonferroni post-tests). (E) Immunohistochemistry for ITPR3 in liver sections showing that expression after 5′-aza treatment is mostly concentrated in the region of the central venule (scale bar, 100 µm). (F) Representative immunoblot of hepatocyte lysates demonstrating that 5′-aza treatment increases ITPR3 expression relative to control. ITPR1 and ITPR2 expressions are unchanged by 5′-aza. (G) Densitometric analyses showing that ITPR3 is the only ITPR isoform with increased expression after 5′-aza treatment (n=3, **p<0.01, by Student t-test). 5′-aza, 5′-azacitine; ITPR1, type 1 isoform of the inositol 1, 4, 5-trisphosphate receptor; ITPR2, type 2 isoform of the inositol 1, 4, 5-trisphosphate receptor; ITPR3, type 3 isoform of the inositol 1, 4, 5-trisphosphate receptor; NSB, non-specific binding control.
Hepatocyte ITPR3 mRNA was increased in response to 5′-aza (figure 4A), and the newly expressed Ca2+ channel was localised in part in a perinuclear distribution (figure 4B). Moreover, ITPR3 was present in both nuclear and non-nuclear fractions of hepatocytes isolated from mice treated with 5′-aza (figure 4C,D). ITPR3 was furthermore concentrated in hepatocytes near the central venule (figure 4E), perhaps reflecting the higher capacity of PC hepatocytes to metabolise 5’-aza into its active metabolite.33 De novo expression of ITPR3 in this model was not associated with altered expression of ITPR1 or ITPR2 (figure 4F,G). The regional difference in ITPR3 expression in an animal model provided the opportunity to examine whether there were corresponding regional differences in Ca2+signalling. Livers were loaded with the Ca2+-sensitive fluorescent dye Fluo-4/AM, then time-lapse confocal imaging was used to monitor hepatocyte Ca2+ signalling in vivo. The peak response to the hepatocyte Ca2+ agonist AVP was higher in animals treated with 5′-aza (figure 5A,B). This increased response was primarily due to the PC, ITPR3-expressing hepatocytes (figure 5C–E), as a less pronounced increase in Ca2+ signalling was seen in PP hepatocytes relative to untreated controls (figure 5F). Also, the time to peak for Ca2+ signals was increased in PC, but not in PP hepatocytes, of 5′-aza-treated mice when compared with control, which may reflect the lower sensitivity of ITPR3 to InsP3(figure 5G). The amplitude of Ca2+ signals in the nucleus also was increased in the PC, ITPR3-expressing hepatocytes (figure 5H and online supplementary figure 6) and PP hepatocytes (figure 5H). However, these regional differences in Ca2+ signaling were not observed in hepatocytes isolated from control and 5'-aza-treated mice, likely due to the high concentration of AVP used to trigger Ca2+ release (online supplementary figure 7). Nonetheless, the changes in nuclear Ca2+ observed in vivo are of potential importance because both normal liver regeneration and growth of liver tumours depend on nuclear Ca2+ signals.4 5 34
Supplemental material
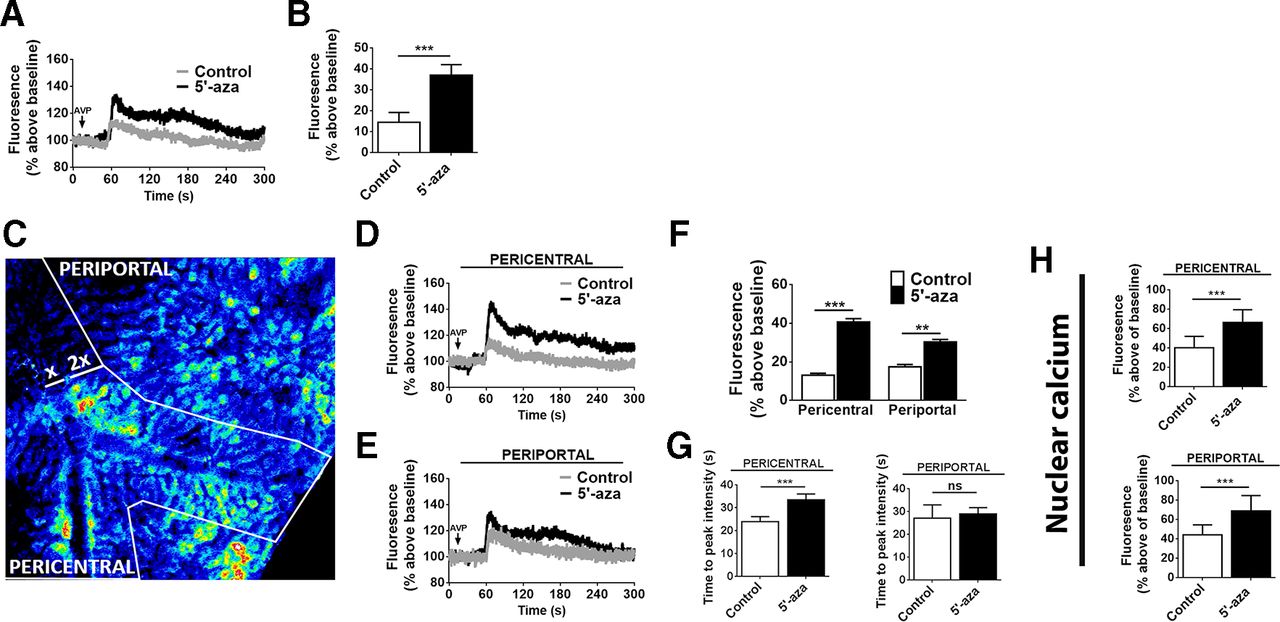
Demethylation enhances calcium signalling in hepatocytes in vivo. (A) Representative time course of hepatocyte Ca2+ signals following stimulation by intravenous infusion of AVP (100 ng/mL), monitored by in vivo time-lapse confocal imaging of livers in animals treated with 5′-aza and controls. Fluorescence of the Ca2+ dye Fluo-4 is expressed as a percentage of basal fluorescence. (B) Peak fluorescence after AVP stimulation is more than doubled in animals treated with 5′-aza (n=3 animals per group, ***p<0.001). (C) Representative pseudocoloured confocal fluorescence image showing identification of PC and PP regions. (D) Representative time course of Fluo-4 fluorescence levels in hepatocytes near the central venule (PC region), where ITPR3 expression is increased by 5′-aza. Note the increase is greater than is seen by imaging the whole liver. (E) Representative time course of Fluo-4 fluorescence levels in hepatocytes near the portal venule (PP region), where little to no ITPR3 expression is induced by 5′-aza. Note the increase is smaller than that observed in the whole liver. (F) Fluorescence peak after AVP stimulation is higher in PC hepatocytes from animals treated with 5′-aza (***p<0.001) than in PP hepatocytes from the same group (**p<0.01). (G) Time to the maximal peak of Ca2+ in PC hepatocytes is higher in PC hepatocytes from 5′-aza-treated animals (***p<0.01). (H) Fluorescence peaks in PC and PP hepatocyte nuclei are significantly increased in animals treated with 5′-aza compared with controls. Fluorescence is expressed as a percentage of basal fluorescence (n=20 nuclei were monitored per animal in 3 animals per group, ***p<0.001). AVP, arginine vasopressin; 5′-aza, 5′-azacitidine; ITPR3, type 3 isoform of the inositol 1, 4, 5-trisphosphate receptor; PC, pericentral; PP, periportal.

Demethylation accelerates liver regeneration in mice. (A) Liver-to-body weight ratio at 24, 48 and 72 hours after PH showing increased ratio in 5′-aza-treated group, relative to controls (n=5 animals per group, *p<0.05; **p<0.01; ***p<0.001, Bonferroni post-test). (B) Immunohistochemistry for PCNA in liver sections after PH (scale bar, 100 µm). (C) Quantification of PCNA-positive cells 24, 48 and 72 hours after PH, demonstrating that 5′-aza treatment increases hepatocyte proliferation (n=5 animals per group, **p<0.01; ***p<0.001). (D) Quantification of PCNA-positive cells in PC and PP regions 24, 48 and 72 hours after PH. Dotted regions on the micrograph illustrate PC and PP areas used for quantification as defined in the methods section. 5′-aza, 5′-azacitidine; PC, pericentral; PH; partial hepatectomy; PP, periportal.

![[gutjnl-2018-317811supp002.jpg]](https://gut.bmj.com/content/gutjnl/68/9/1676/DC2/embed/inline-supplementary-material-2.jpg?download=true)
![[gutjnl-2018-317811supp003.jpg]](https://gut.bmj.com/content/gutjnl/68/9/1676/DC3/embed/inline-supplementary-material-3.jpg?download=true)
![[gutjnl-2018-317811supp004.jpg]](https://gut.bmj.com/content/gutjnl/68/9/1676/DC4/embed/inline-supplementary-material-4.jpg?download=true)
![[gutjnl-2018-317811supp005.jpg]](https://gut.bmj.com/content/gutjnl/68/9/1676/DC5/embed/inline-supplementary-material-5.jpg?download=true)
![[gutjnl-2018-317811supp006.jpg]](https://gut.bmj.com/content/gutjnl/68/9/1676/DC6/embed/inline-supplementary-material-6.jpg?download=true)
![[gutjnl-2018-317811supp007.jpg]](https://gut.bmj.com/content/gutjnl/68/9/1676/DC7/embed/inline-supplementary-material-7.jpg?download=true)
Knockout of ITPR3 sensitises liver cancer cells to apoptosis (A) Representative western blot showing efficient elimination of ITPR3 expression in HepG2 cells by CRISPR-Cas9 in two separate clones. Expression of RFP as a marker for successful integration of the knockout cassette in the genome of HepG2 cells (scale bar, 20 µm). (B) Caspase 3/7 activity after treatment of HepG2 cells with STA is increased in ITPR3KO relative to WT cells (values are mean±SEM, n=9 in each group, *p<0.01). (C) Similarly, the percentage of Annexin 5-positive cells is increased in ITPR3KO cells when compared with WT cells on overnight treatment with STA (values are mean±SEM, n=4 in each group; *p<0.01). (D) ITPR3KO cells have increased Caspase 3/7 activity when treated with Etoposide (values are mean±SEM, n=3 in each group; p<0.001). (E) Super-resolution image of a representative HepG2 cell coexpressing EGFP-ITPR3 and mKO2-TOMM20 (mitochondrial marker). Top row: scale bar, 5 µm. Bottom row: scale bar, 1 µm. (F) Representative immunoblot for cleaved caspase 3 in hepatocyte lysates from control and 5′-aza-treated mice after STA treatment. (G) Densitometric analysis showing that 5′-aza treatment prevents the increase of cleaved caspase 3 in hepatocytes (***p<0.01). (H) Percentage of YO-PRO-1 - positive cells in HepG2 WT after STA treatment. The over expression of ITPR3 in HepG2 cells prevents apoptosis induced by STA . (I) Volcano plot showing the expression of apoptotic genes in HepG2 WT cells compared with HepG2 ITPR3KO cells. Genes to the left of zero are downregulated and the ones to the right of zero are upregulated in WT versus ITPR3KO. The genes represented by open symbols, SIAH2 and POU4F1, showed the highest adjusted p-value. Grey symbols show genes with adjusted p-value >1.0. Black symbols represent the remaining genes. 5 ′ -aza, 5 ′ -azacitine; DMSO, dimethyl sulfoxyde; GAPDH, glyceraldehyde 3-phosphate dehydrogenase; ITPR3, type 3 isoform of the inositol 1, 4, 5-trisphosphate receptor; KO, knockout; RFP, red fluorescent protein; RLU, relative light units; STA, staurosporine; WT, wild type.
Finally, several functional effects were examined to understand the pathophysiological significance of expression of ITPR3 in hepatocytes. Because nuclear Ca2+ regulates hepatocyte proliferation,4 34 liver regeneration following PH was studied. Both liver-to-body weight and nuclear PCNA staining were significantly increased in 5′-aza-treated animals relative to controls at 48 hours after PH (figure 6A–C). PCNA staining was uniformly distributed across the liver lobule (figure 6D). Also, expressions of ITPR1 and ITPR2, the two main ITPR isoforms in quiescent hepatocytes, did not change at all three time points (24, 48 and 72 hours) post-hepatectomy (online supplementary figure 8). This is in contrast to previous results showing a significant increase of ITPR2 protein expression 48 hours after PH, which may reflect species differences.35
To more directly evaluate the role of ITPR3 in hepatocyte proliferation in vivo, liver regeneration was compared between FloxedR3 (Control) and AlbCreR3KO (LSKO3) mice treated with 5′-aza. After 48 hours, liver-to-body weight ratios were significantly higher in LSKO3 mice when compared with controls (online supplementary figure 9A), but PCNA staining was significantly decreased in LSKO3 mice compared with control (online supplementary figure 9B). ITPR3 expression was detected in control mice around the central veins and occasionally elsewhere throughout the liver lobule, whereas ITPR3 was mostly absent in LSKO3 livers (online supplementary figure 9C). Therefore, hepatocyte proliferation after PH as measured by PCNA labelling is increased when ITPR3 expression is induced and decreased when it is knocked out. It is unclear why liver-to-body weight is increased despite lower PCNA labelling in LSKO3 mice. This may reflect hypertrophy to compensate for impaired proliferation, or else some other chronic compensatory effects, especially in light of previous reports that ITPR3 remains undetectable in hepatocytes after PH in rats.35
Supplemental material
Cell proliferation can also be regulated by apoptosis, both in liver regeneration24 and tumour growth.6 7 ITPR3-dependent Ca2+ release is involved in apoptotic cell death,36 so apoptosis was evaluated in WT and ITPR3KO cells (figure 7A) in several ways . Caspase 3/7 activity following STA treatment was significantly increased in ITPR3KO cells, relative to WT cells (figure 7B). No difference in baseline caspase activity was detected between the two groups. Similar results were obtained by FACS analysis of Annexin V positive cells (figure 7C). Caspase 3/7 activity also was greater in ITPR3KO cells than in WT when apoptosis was induced with etoposide rather than STA (figure 7D). These results are consistent with the idea that ITPR3 protects HCC cells from cell death via inhibition of apoptosis. Because the transfer of Ca2+ from the ER to mitochondria modulates apoptosis in multiple cell types6 7 and because ITPR3 preferentially transmits Ca2+ to mitochondria,36 colocalisation of a green fluorescent protein (GFP)-tagged ITPR3 and mKO2-TOMM20, a marker of the outer mitochondrial membrane, was evaluated in HepG2 cells using super-resolution microscopy. GFP-ITPR3 distributed throughout the cytosol in a reticular pattern, consistent with it being localised to the ER, and mKO2-TOMM20 was found in tubular structures resembling mitochondria. The colocalisation analysis revealed that a fraction of the GFP-ITPR3 (~15%) overlapped with mKO2-TOMM20 (figure 7E), suggesting that ITPR3 is partially located at the interface between ER and mitochondria. This is consistent with the idea that, when present in hepatocytes, ITPR3 might modulate apoptosis by controlling the transmission of Ca2+ between these two organelles.
Apoptosis was also analysed in primary hepatocytes isolated from control and 5′-aza-treated mice in the presence of STA. Cleaved caspase 3 expression was increased in cells treated with STA compared with non-treated controls. In contrast, there was a trend towards increased cleaved caspase 3 expression in cells from 5′-aza-treated mice, and this was not further increased by STA (figure 7F,G). Similarly, transient overexpression of mCherry-tagged ITPR3 induced apoptosis in HepG2 cells, whereas treatment of these cells with STA did not further increase apoptotic cell death (figure 7H). Together these results suggest that de novo expression of ITPR3 may induce apoptosis in either hepatocytes or HCC cells, but in both cases, the surviving cells become resistant to cell death induced by apoptotic stimuli.
Because ITPR-dependent Ca2+ signalling triggers store-operated Ca2+ entry (SOCE) that shapes the overall intracellular Ca2+ response, the expression of the main components of SOCE was investigated in WT and ITPR3KO cells. Expressions of all SOCE-related genes (ORA1, ORAI2, ORAI3, STIM1 and STIM2) were similar in WT and ITPR3KO, suggesting that alterations in SOCE do not contribute to the effects of ITPR3 on liver cancer development (online supplementary table 1).
Supplemental material
![[gutjnl-2018-317811supp009.jpg]](https://gut.bmj.com/content/gutjnl/68/9/1676/DC9/embed/inline-supplementary-material-9.jpg?download=true)
To understand the mechanism by which ITPR3 might protect rather than induce apoptotic cell death, RNA sequencing was performed to compare global gene expression between WT and ITPR3KO HepG2 cells. This analysis revealed that the presence of ITPR3 in a liver cancer cell is associated with changes in multiple apoptosis-related genes. Two of these genes, POU4F1 and SIAH2, were the most upregulated and downregulated genes, respectively, in WT cells relative to ITPR3KO (figure 7I). POU4F1 is a transcription factor that is upregulated in acute myeloid leukaemia37 and it triggers an antiapoptotic and prosurvival response in sensory neurons.38 SIAH2 is a ubiquitin E3-ligase that promotes breast cancer growth by remodelling of the tumour microenvironment.39 These results suggest that chronic ITPR3 expression might trigger an antiapoptotic response in liver cancer through modulation of gene expression and proteasome activity.
Discussion
The importance of ITPR3-mediated apoptosis is emerging as a common theme in cancer biology,6 7 40 although ITPR3 can either promote or inhibit apoptosis, depending on the type of tumour. ITPRs can link to VDAC in the outer mitochondrial membrane via grp75, which forms a ‘quasi-synapse’ that facilitates the transmission of calcium from the lumen of the ER directly into mitochondria.41 Excessive mitochondrial calcium, in turn, triggers the opening of the permeability transition pore,40 42 with leakage of mitochondrial contents into the cytosol and then induction of apoptosis via formation of the apoptosome.43 ITPR3 is particularly effective at modulating mitochondrial calcium and apoptosis.36 However, there is variability in the way that ITPR3 is modulated and affects apoptosis among different tumour types. For example, in both melanoma and mesothelioma, changes in ITPR3 expression have been attributed to the loss of the tumour suppressor BAP1, which binds to and stabilises ITPR3. Loss of BAP1, therefore, leads to loss of ITPR3, which in turn reduces apoptotic mitochondrial calcium signals.6 In prostate cancer, ITPR3 degradation has instead been linked to mutations in phosphatase and tensin homolog (PTEN), which normally competes with FBXL2 to prevent it from binding to and degrading ITPR3. In the absence of PTEN, or in the presence of certain mutant forms, degradation of ITPR3 is increased, which leads to decreased apoptosis.7 A role for ITPR3 in colon cancer has been demonstrated as well, and this also has been related to the effect of ITPR3 on apoptosis.12 In this case, increased ITPR3 expression in colon cancer resection specimens was associated with increased metastasis and decreased patient survival. Overexpression of ITPR3 also was associated with decreased apoptosis in a colon cancer cell line, whereas knockdown of ITPR3 led to increased apoptosis.12 The current work similarly found that increased ITPR3 expression in HCC is associated with decreased patient survival and that susceptibility to apoptosis is increased when ITPR3 is deleted.
Our work also provides evidence that promoter demethylation is responsible for controlling de novo expression of ITPR3 in HCC. Although DNA hypomethylation is a common feature of multiple cancers,44 our results suggest that promoter methylation of the ITPR3 gene is a more specific event, because the closely related genes ITPR1 and ITPR2 did not display changes in methylation or expression in HCC. Thus, ITPR3 expression might follow a similar pattern to that of oncogenes such as c-jun and c-myc, whose expression is similarly controlled by DNA methylation.45
It is unclear why ITPR3 promotes apoptosis in certain types of malignancies but protects against it in others. One possible explanation suggested by our findings is that overexpression of ITPR3 initially promotes cell death, likely due to increased transfer of calcium to nearby mitochondria, but surviving cells compensate by developing an antiapoptotic gene expression programme. Another possible explanation is that hepatocytes do not normally express ITPR3,8–10 so in these cells, mitochondrial calcium signals normally are due entirely to ITPR1.11 Because ITPR3 has a lower affinity than ITPR1 for InsP3,46 it is possible that de novo expression of ITPR3 enables this isoform to decrease the overall responsiveness to InsP3 in the ER–mitochondrial junction, leading to decreased mitochondrial calcium signalling and apoptosis. A final explanation relates to the recent observation that mitochondria in cancer cells become ‘addicted’ to calcium so that loss or inhibition of ITPR’s can lead to cell death,47 although this is thought to result in necrosis rather than apoptosis.
Of additional relevance to cancer biology is that calcium signals in the nucleoplasm are necessary for tumour growth.4 In the liver, nucleoplasmic calcium signals can be selectively generated by activation of receptor tyrosine kinases (RTKs). This occurs when specific growth factors bind to their cognate RTKs, which then translocate from the plasma membrane to the nucleus in order to locally activate PLC, which then increases nucleoplasmic InsP3 that binds to nuclear ITPRs. This signalling pathway has been demonstrated for the hepatocyte growth factor receptor c-met,5 the EGF receptor,48 and the insulin receptor,14 34 each of which may play a role in the development of HCC.49 50 Furthermore, ITPR3 is expressed not only in the ER but also in the nuclear fraction in liver cancer cell lines, and nuclear ITPRs are more sensitive than non-nuclear ITPRs to InsP3 in these cells.51 This raises the possibility that expression of ITPR3 in the liver leads to enhanced calcium signalling in the nucleus as a contributing factor to the development of HCC, consistent with what we observed in 5′-aza-treated livers stimulated with vasopressin, a known stimulator of liver growth.52 How our findings regarding ITPR3 expression and its contribution to normal liver regeneration translate to cancer biology remains to be determined. Although similar Ca2+-inducing agonists promote hepatocyte proliferation after PH and tumour growth in HCC, it is not known whether the underlying proliferative mechanisms involve ITPR3 in similar ways. Additional work will be needed to determine whether and why there is an absolute requirement for de novo expression of ITPR3 in the pathogenesis of HCC, as well as whether it is a rational target for therapy.
Supplemental material
![[gutjnl-2018-317811supp010.jpg]](https://gut.bmj.com/content/gutjnl/68/9/1676/DC10/embed/inline-supplementary-material-10.jpg?download=true)
Supplemental material
![[gutjnl-2018-317811supp011.jpg]](https://gut.bmj.com/content/gutjnl/68/9/1676/DC11/embed/inline-supplementary-material-11.jpg?download=true)
Acknowledgments
The authors thank Kathy Harry and Masahiro Takeuchi for help with mouse tissue isolation (Yale Liver Center). They also acknowledge the support of the UFMG Liver Center.
References
Footnotes
MTG and RMF contributed equally.
MHN and MFL contributed equally.
Contributors MTG and RMF: designed and performed experiments, analysed data and help to write the manuscript. AF, ACMLF, RCF, FOL and MCF: performed in vivo experiments and analyse data related to 5’-azacitidine treatments. MLS: performed immunohistochemistry in human tissues and analysed clinical data. EK: performed experiments and analysed data related to the ITPR3KO HepG2 cells. AM: processed DEN tissue samples and graded histological scores in HCC specimens. FG and YCC: designed and performed xenograft tumor assays in nude mice. MA: generated liver-specific ITPR3 knock out mice. JG, JJ and HZ: analysed RNA sequencing data. BN, JAG, CXL and PTV: identified and diagnosed human HCC specimens. AGO: performed in vivo calcium imaging experiments. MHN and MFL: supervised the project, formulated the hypothesis, designed experiments and edited the manuscript.
Funding This work was supported by grants from NIH (DK57751, DK34989, DK114041, DK112797 and OD20142 to MHN, and DK07356 to MHN and BN) and CNPq (300990/20147 to MFL). This work also was supported by the Gladys Phillips Crofoot Professorship.
Competing interests None declared.
Ethics approval All studies employing archived human liver specimens were approved by the local Human Investigation Committee at UFMG – Protocol # 71206617.8.0000.5149 and Yale University – Protocol # 1304011763). Animal studies were approved by the Institutional Animal Care and Use Committees at UFMG – Protocol #169/2014 and Yale University – Protocol # 2012-07602.
Provenance and peer review Not commissioned; externally peer reviewed.