Hello everyone,
My name is Raman Sharma and I am a PM on the VC++ IDE team. I want to talk about a new feature called Call Hierarchy in Visual Studio 10. As the name suggests, it is used for navigating all functions called from within a particular function and all functions that make calls to a particular function. Many of you would know of a feature called Call Browser which was present in VC6, VS2005 and VS2008, and provided similar functionality. The Call Hierarchy feature is the revamped version of Call Browser, better organized and easier to use.
In VS2010, Call Hierarchy has been designed such that it can be a shared feature for all languages i.e. the UI is common and different languages (like C#, C++ etc.) can fill the UI with their own data to address the semantic differences between the languages. For C#, this will be a new feature (See this post for more details). For C++, it is just about transitioning from the old Call Browser to Call Hierarchy to take advantage of the new design.
Let’s look at an example that will illustrate the differences between the old functionality and the new one. Let’s say you want to see the “calls from” and “calls to” information for two functions at the same time: CImagingView::OnRButtonUp and CImagingView::OnContextMenu
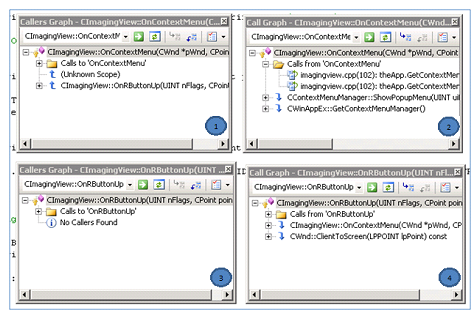
In the previous releases, this would have effectively meant you having to open the following four call browser tool windows:

C++ Call Browser in VS2008
The above model clearly suffers from the following limitations:
– The “Calls From” and “Calls To” are presented in separate tool windows. (windows 1&3 for Calls To and 2&4 for Calls From)
– Each tool window can hold the call information for only one function at a time.
– The manner in which results are presented is not very intuitive:
o In the window 2 above, the names of the functions called from CImagingView::OnContextMenu are listed at the bottom of the tree, whereas the actual calls to those functions are listed under the folder named Calls from ‘OnContextMenu’.
o There is no link between the above two making navigation harder.
Let me just add, those windows would not be so neatly stacked together as I make them appear in the above screenshot.
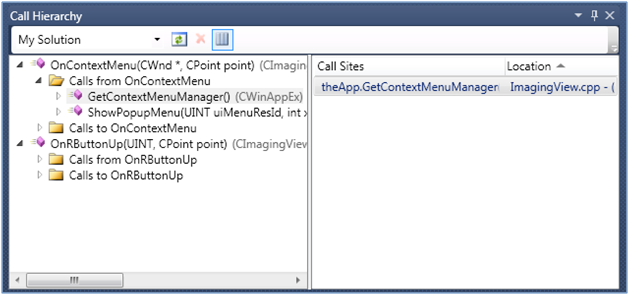
In VS2010 however, with the new Call Hierarchy feature, the same information is presented in one tool window in the following form:

C++ Call Hierarchy in VS2010
Notice the following salient features in the above window:
– “Calls From” and “Calls To” trees for any function appear in the same place in one window.
– There can be multiple root nodes, thus obviating the need to open a separate window for each function.
o The user can also right click on any non-root node in the tree and add it as a new root node to achieve better clarity.
– The results are much clearer to comprehend:
o The tree in the left pane of the window will just show the names of the function (callers or callees) recursively.
o When you click on a result in the left pane, the actual call site appears in the right pane.
o Upon double clicking the call-site in the right-pane, you are taken to that location in your source code in the Editor.
– The user can limit the search results to the current file, the current project or the entire solution for better filtering and performance.
– The user can copy the results from the call-sites pane and paste them elsewhere to perform some analysis.
There was no way to do any of the above using the old Call Browser.
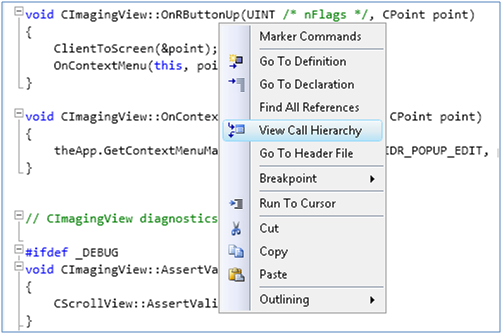
The Call Hierarchy window can be invoked from the Editor context menu by just right-clicking on the function for which you want to see the results:

Call Hierarchy Invocation
To build this feature, we have made use of the new C++ IDE infrastructure, the details of which were posted here recently. To populate the “calls from” information for a function say func, we simply need to parse the contents of func and find out all the functions being called from within it. “Calls To” performs a wider search. A query is made to the SQL based database (explained here again) to find out all the locations where func is referenced, and then for all the results, their enclosing blocks of code are parsed to find out whether this reference actually is a function call to func. We have tried to make sure that the results we provide to you are accurate and complete. However, we don’t claim to provide debugger-like accuracy. For example, you will not see implicit calls like destructors etc. being listed in the list of calls from a function (some day maybeJ). However, we have done enough to ensure that all the information relevant while designing, writing and reading code is available.
Overall, we believe that new intuitive user interface, greater flexibility, fewer navigation steps, and better accuracy make the new Call Hierarchy a very useful feature. We are excited about it and hope you will like it.
Thank you.

0 comments