Discover the power of Frustration Scoring
Frustration Scoring
Surface the worst points of friction
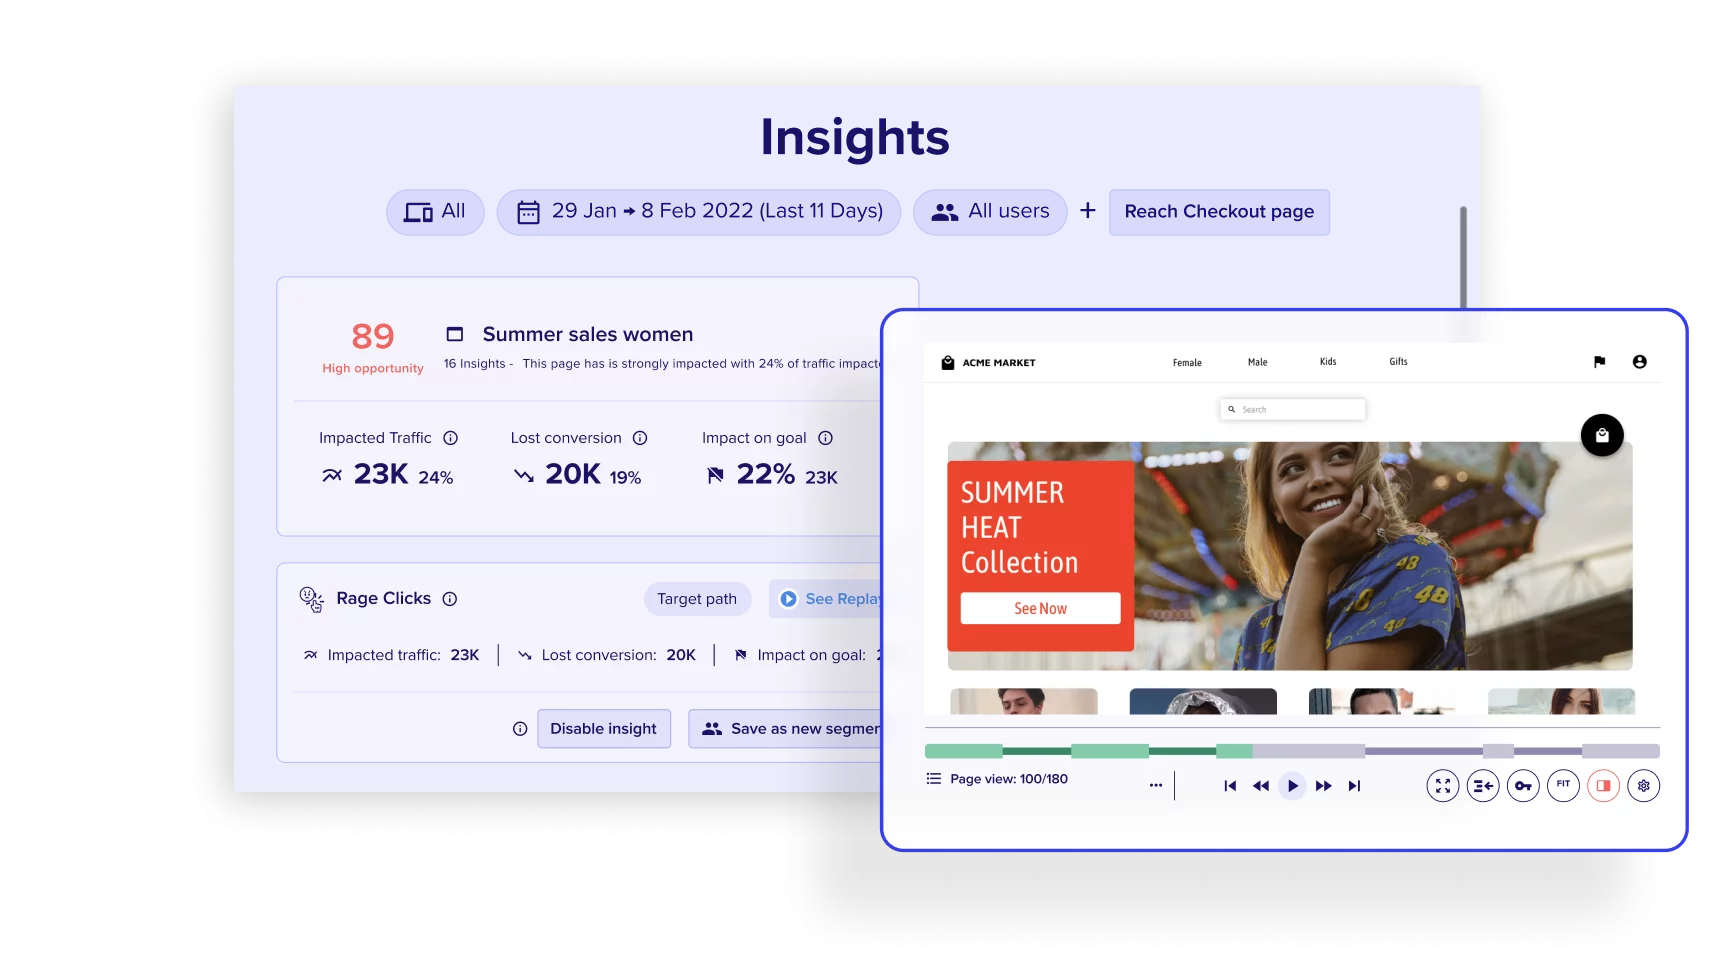
Automatically surface the biggest areas of struggle that make customers turn their back on your site. Rank the frustrations by impact and quickly dig deeper with connected use cases to understand the journeys leading up to these issues. Prioritize what to redesign based on business impact.
Key Features
- AI Insights
- Frustration Scoring
- Alerting and Trending
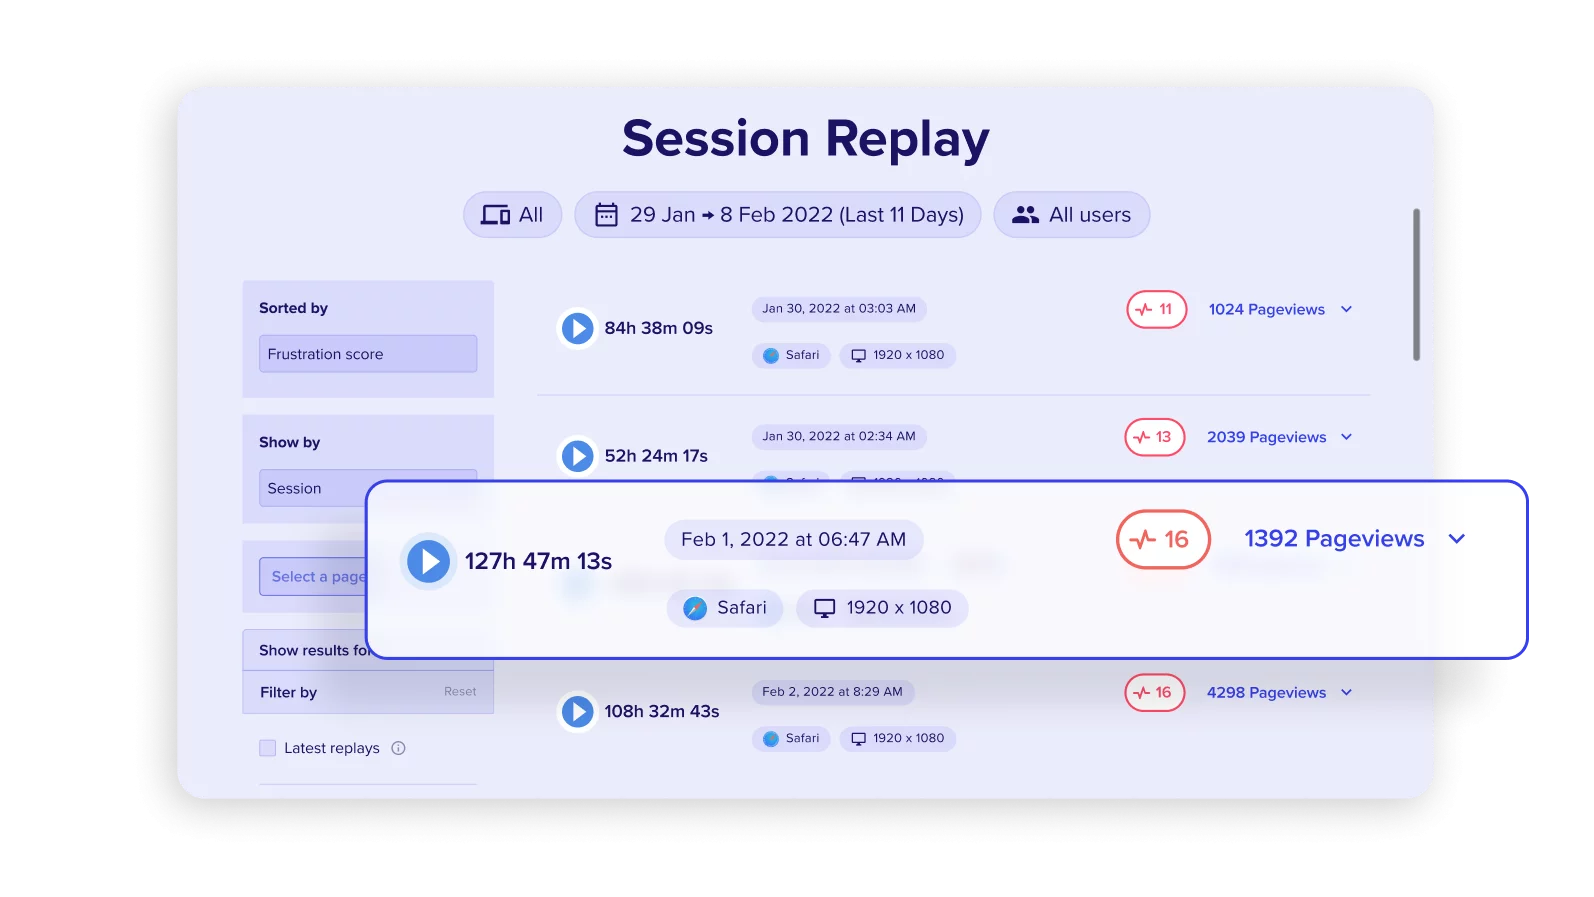
Automatically surface the areas of the site where users were most frustrated
Lacking time or resources? Let AI-driven insights do the heavy lifting for you to uncover issues you’d otherwise miss.
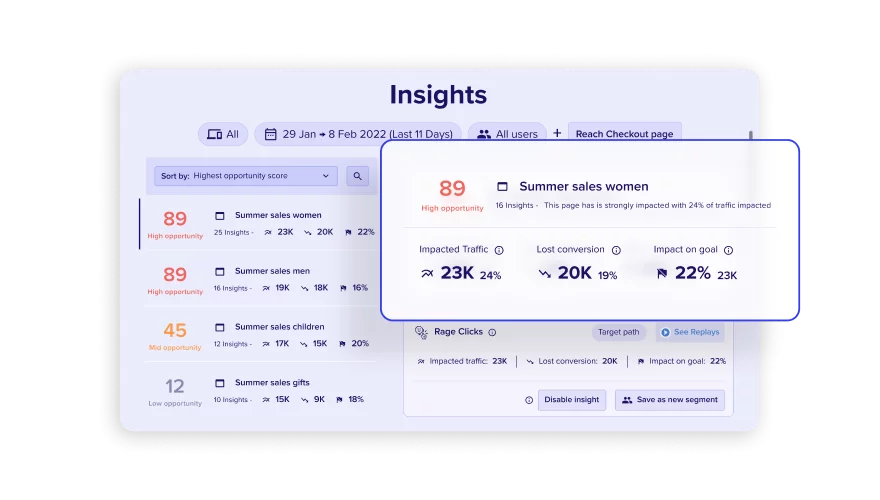
Our intelligent scoring lets you immediately pinpoint where exactly you should focus your energy by ranking issues based on their impact on experience, conversion, and revenue (e.g. rage clicks, repeated attempts at completing form fields and tasks, slow performance, etc.).
Spend less time analyzing and more time building better experiences
Nobody has time to watch replay after replay. Save time and prioritize the most insightful replays to watch.
Frustration scoring ranks the sessions where users experienced the most friction so you can cut to the chase and fix it once and for all.
Proactively monitor for frustrations
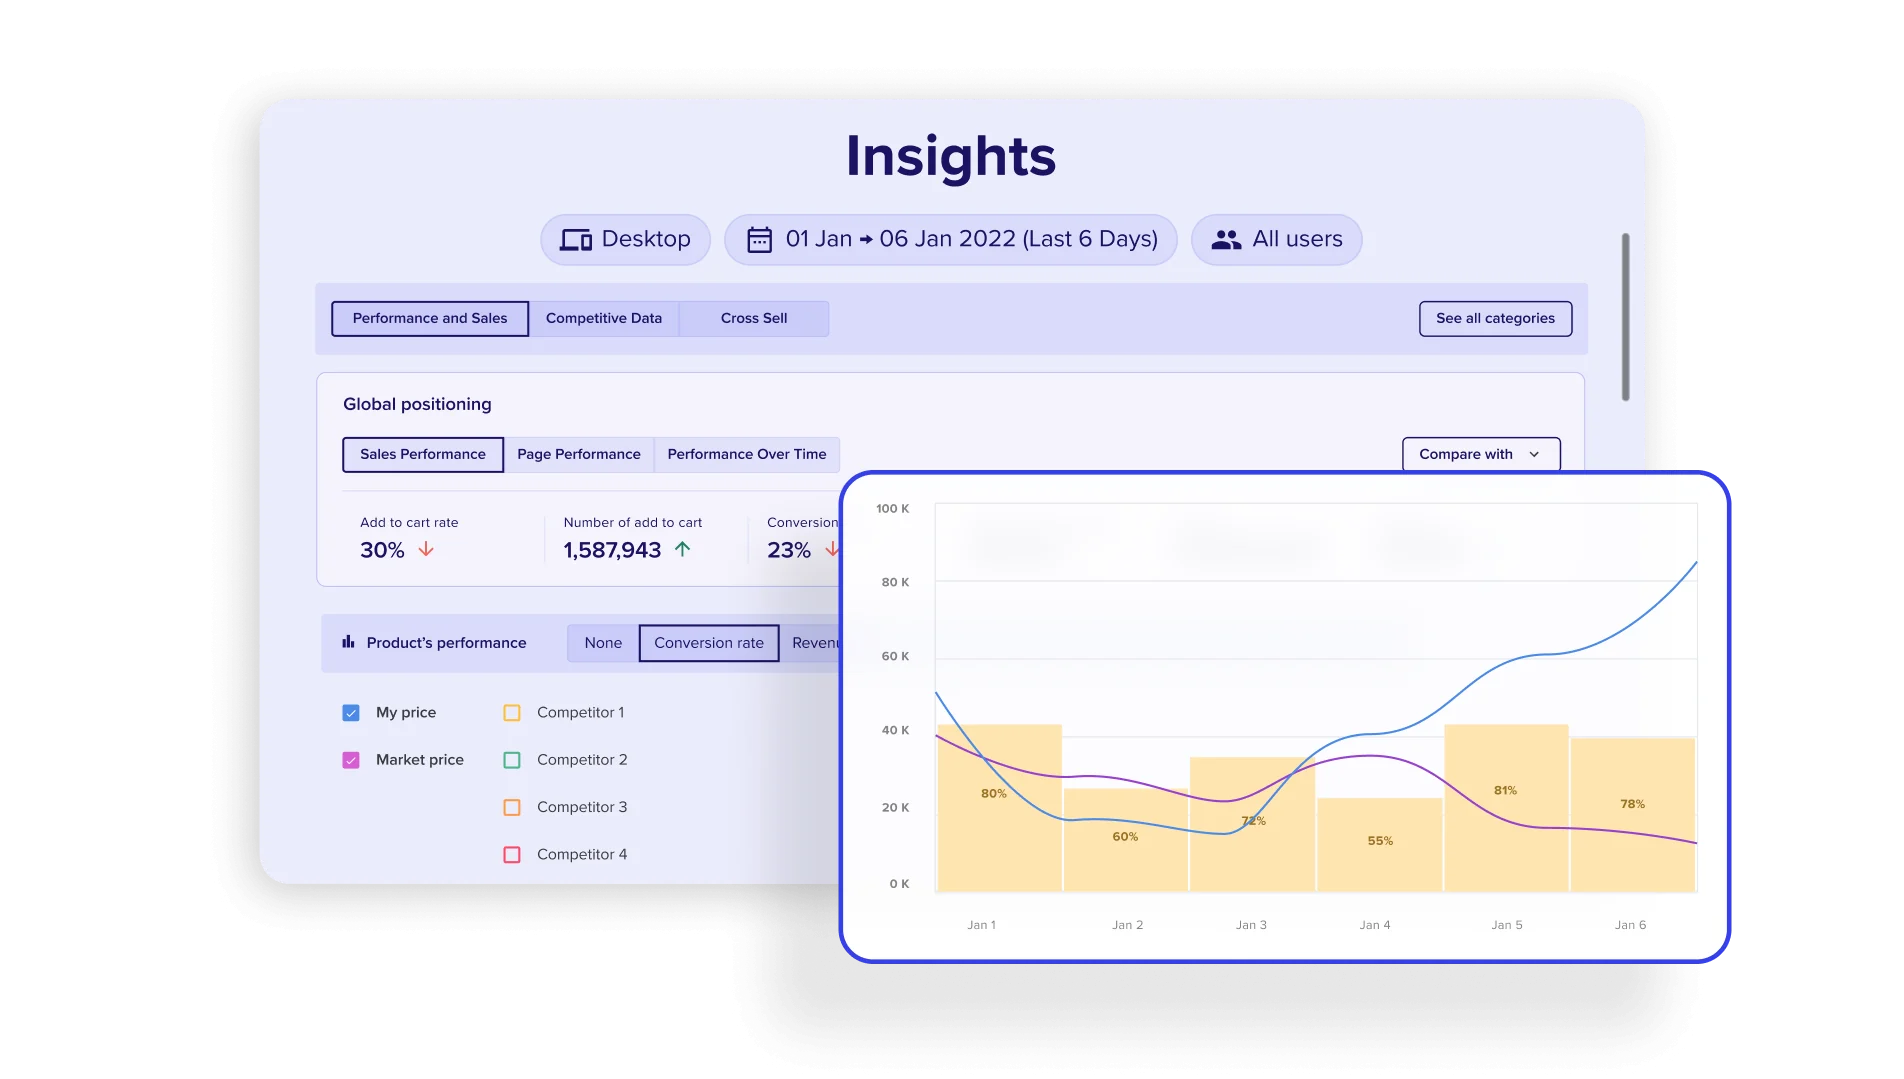
Monitor the trend of users that experience varying levels of frustrations to make sure that your optimization efforts are bearing fruit. Get alerted when frustrations spike.
Rally the team to understand why it’s happening with the help of connected use cases such as session replay, error analysis, and impact quantification.
Most common use cases
- 01 Focus on the most important issues
- 02 Validate A/B tests and new releases faster
- 03 Increase operational efficiency
Surface the worst frustrations that hurt your business top-down
No team has time to monitor every journey or customer. Let Contentsquare automatically surface the most critical points of friction as they happen.

Build higher quality products faster by finding usability issues quickly
Deliver more and higher quality releases with your team by detecting usability issues with new experiences as you launch them.
Scale your team with the power of AI
Save time and increase the impact of the team by eliminating false positives and prioritizing efforts where friction is hurting customer experience and conversion.

Frustration Scoring in action
How Harrods used advanced customer behavior data to reduce cart abandonment by 8%
Read the full story View all case studies >>
"
Contentsquare enables different teams and users at Harrods to build customer experience analysis into their day-to-day life. It's now a fundamental part of our site analysis and I can't imagine moving to a company that doesn't have a tool like Contentsquare. It’s a tool that I couldn’t live without anymore."

Nick Clews
Digital Analytics Manager
Harrods
Frequently Asked Questions
-
User friction refers to any obstacle or difficulty that users encounter while interacting with a digital product or service, hindering the smooth flow of their experience.
-
User friction can lead to increased bounce rates, lower user engagement, and ultimately, reduced conversion rates, negatively affecting the overall success of a digital platform.
-
Examples include complex navigation, lengthy forms, slow loading times, unclear calls-to-action, and any element that hinders users from easily accomplishing their goals.
-
User friction can be identified through user testing, analytics, and feedback. Key metrics such as bounce rates, session duration, and conversion rates can help measure the level of friction.
-
Streamlining navigation, optimizing page speed, simplifying forms, providing clear instructions, and addressing user feedback are effective strategies to minimize user friction.
-
Prioritizing user friction reduction enhances user satisfaction, boosts customer loyalty, and increases the likelihood of users completing desired actions, ultimately contributing to business success.
-
Contentsquare’s data science algorithms automatically detect and surface friction signals across a wide variety of behaviors:
- Rage clicks
- Multiple button interactions
- Multiple field interactions
- Multiple cart revisits without transacting
- Multiple home page revisits
- Slow load performance
- Fast backs -
User-centered design focuses on creating products that meet users' needs and expectations. By addressing user friction, designers ensure a more seamless and enjoyable experience, aligning with the principles of user-centered design.
-
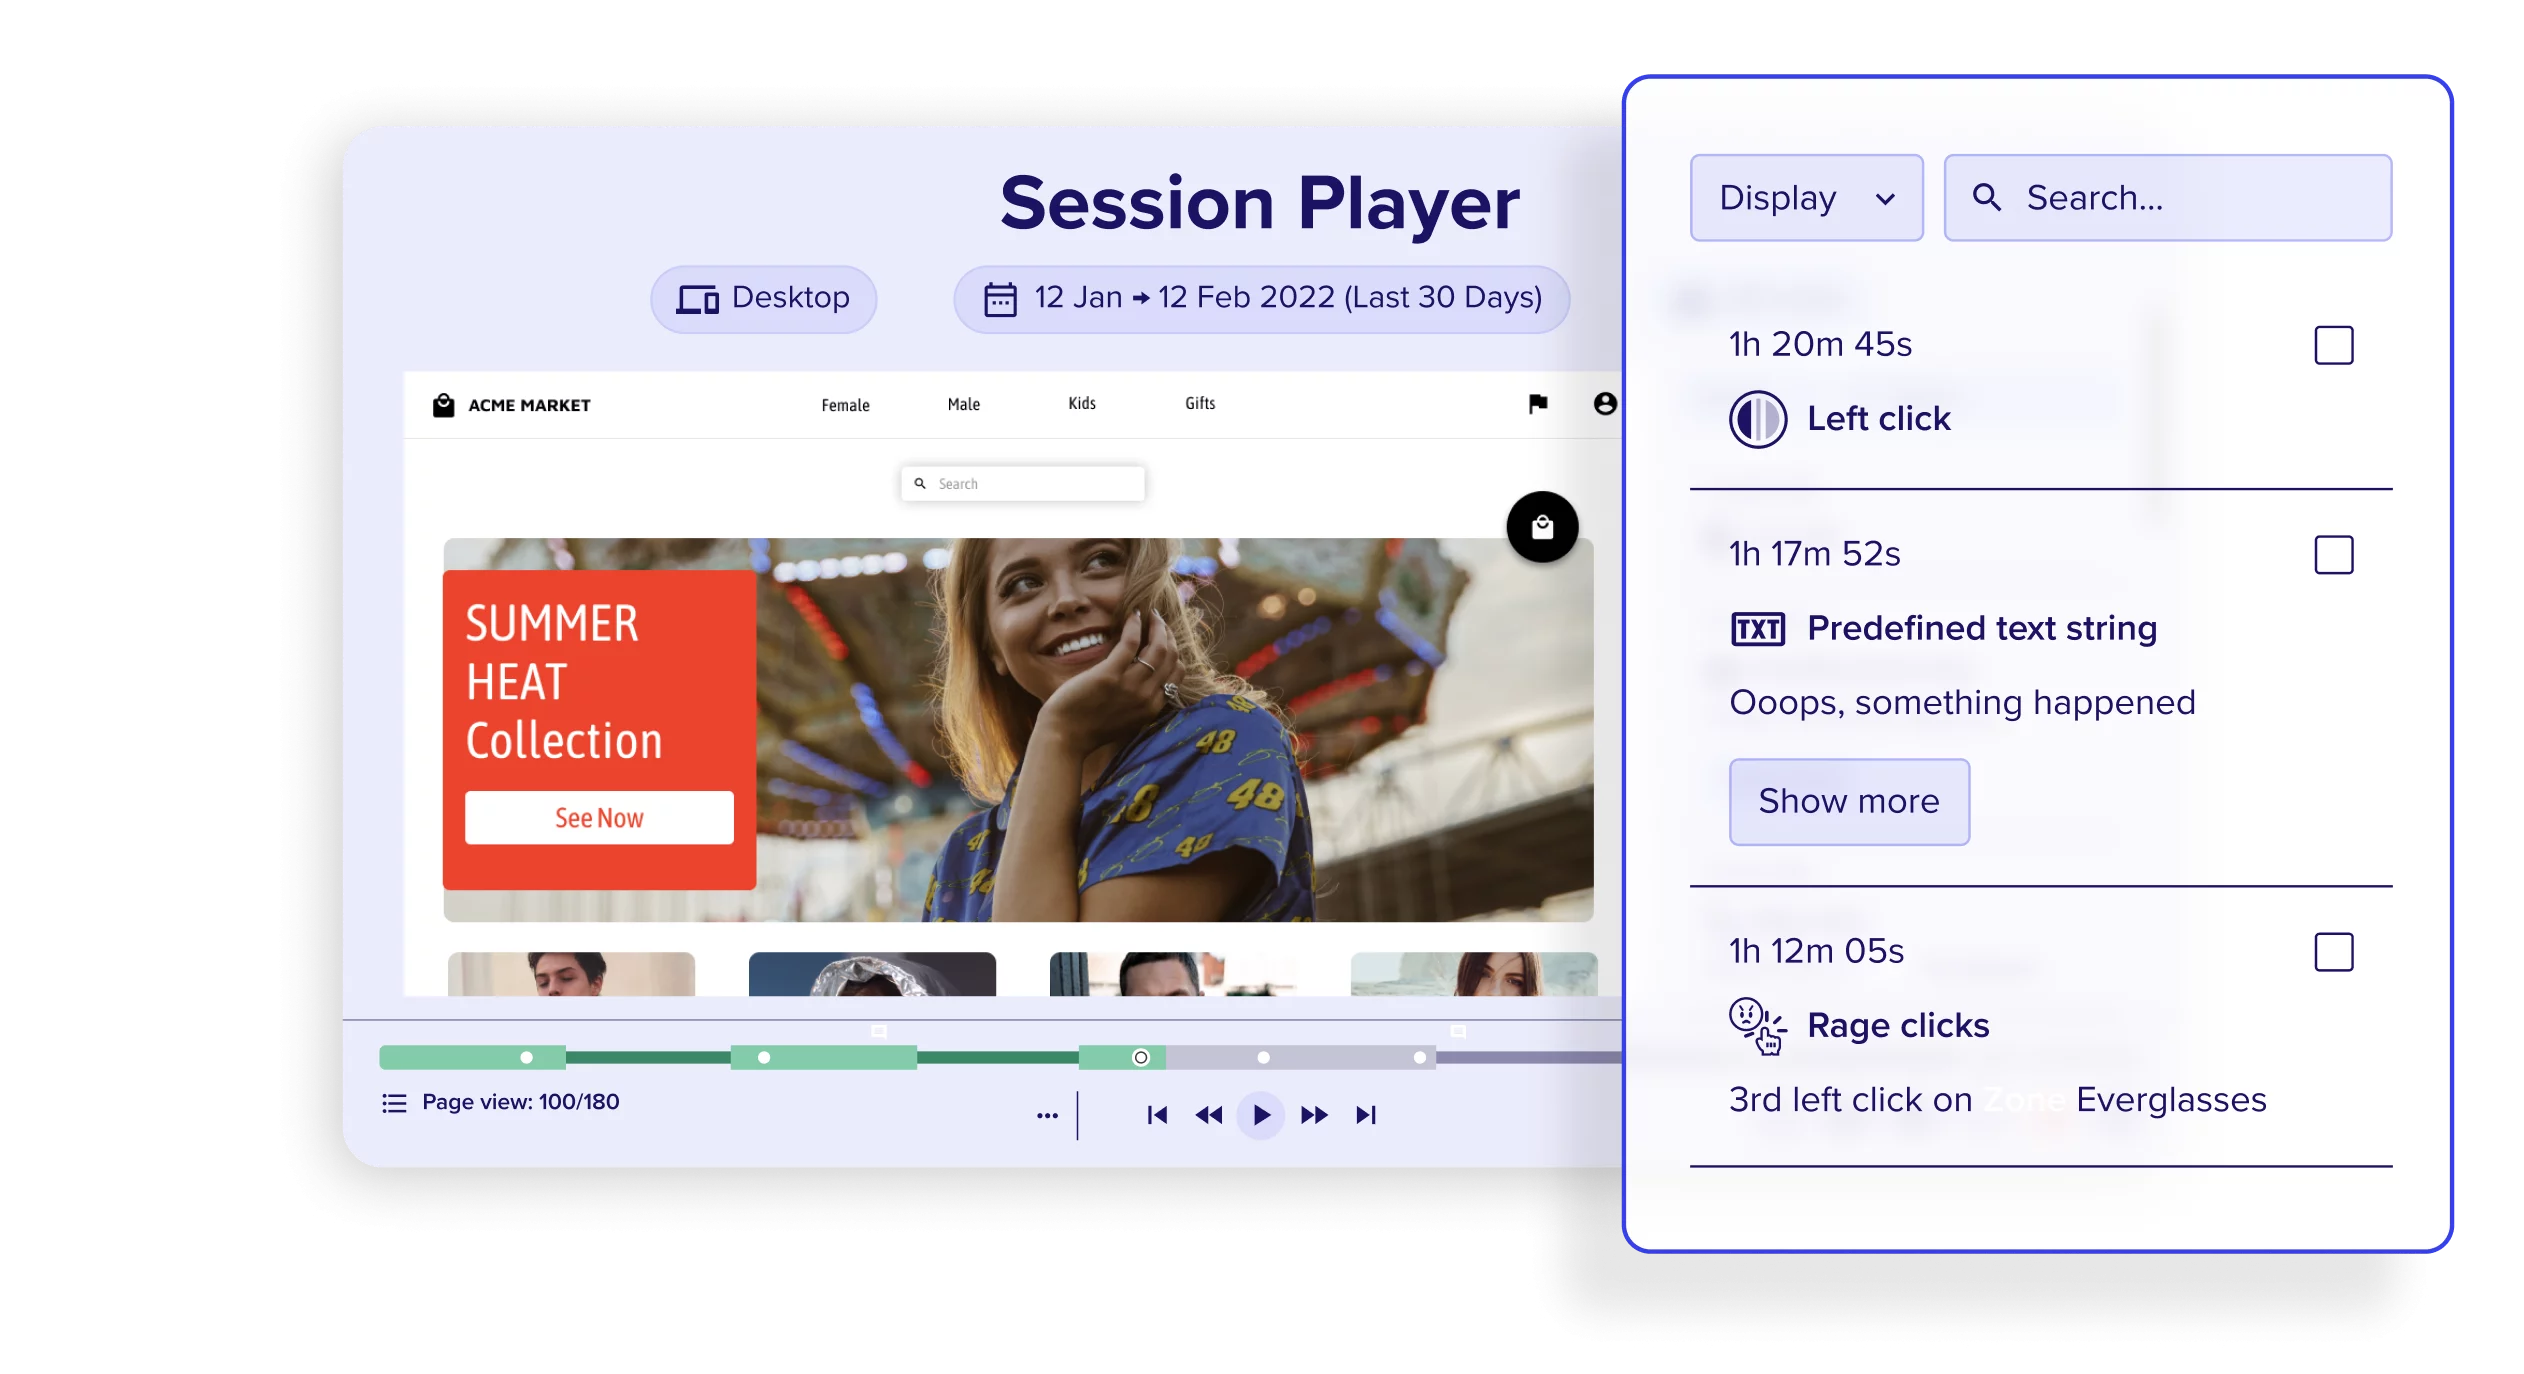
Contentsquare’s Frustration Score is not a black box. With a click, see exactly what frustrations were detected and how they contributed to the score . Opportunities are ranked by impact so you can prioritize. With a click you can replay the exact moments where the frustration occurred. The session replay event stream highlights the frustration as they occur.
-
Connected use cases enable all teams to make data driven decisions with a click to improve the whole funnel and customer lifecycle. That includes Digital Experience Monitoring for finding and fixing friction just as much as Digital Experience Analytics for improving brand engagement and conversion proactively, while also boosting retention and customer lifetime value with Product Analytics.
