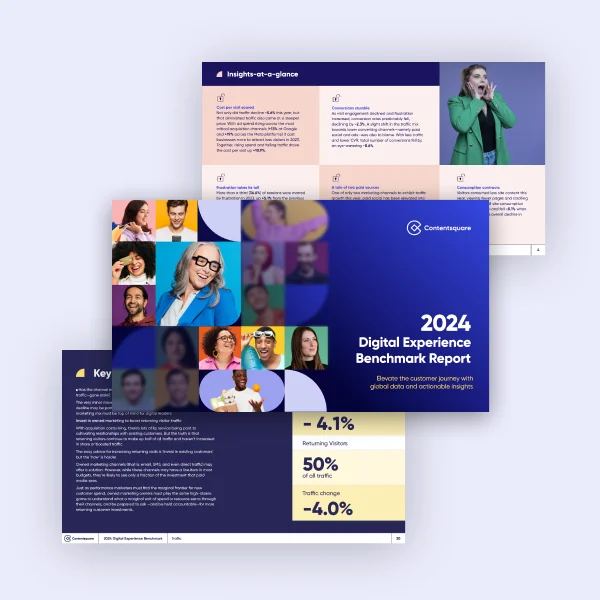
Preview customer experience (CX) metrics and insights
For the methodology behind these insights, see the Report and Interactive Explorer.
Report and Interactive Explorer
With cost per visit jumping an astonishing +9.4% last year (while conversion rates dropped), every visit is now more valuable than ever.
Uncover trends for crucial digital KPIs and learn how to maximize the value of each visit with actionable insights and best practices designed to elevate the entire customer journey.
0 BILLION
Page views
0 BILLION
Site visits
0
Websites
0
Countries
0
Industries
For the methodology behind these insights, see the Report and Interactive Explorer.
Traffic fell -3.6% in 2023, and by over -10% in several industries.
At the same time, there was a +5.5% shift in traffic share towards paid channels.
Not only was traffic spend higher in 2023, but a great proportion of that spend was wasted.
Overall, visitors engaged with less on-site content than in the previous year, with session consumption falling -3% YoY, and 58% of sites seeing a drop in consumption.
Retail, Consumer Packaged Goods (new for 2024), Travel & Hospitality, Telecommunications, Manufacturing, Financial Services, Energy, Utilities & Construction, Media, Software, and Services

Whether you’re an executive, a team lead or a CX pro, the report will help you pinpoint areas for optimization across the digital journey to increase efficiency, delight customers and unleash growth.

Get your copy of the Digital Experience Benchmark Report and access the Interactive Explorer for the most comprehensive and unique strategic data on digital CX available.

Discover the trends shaping digital customer experiences and what you can do to prepare your business for 2024—and beyond.
Access the benchmarks