. 2024 Oct 31;187(22):6200-6219.e23.
doi: 10.1016/j.cell.2024.08.036. Epub 2024 Sep 16.

Dynamic allostery drives autocrine and paracrine TGF-β signaling

Affiliations

Dynamic allostery drives autocrine and paracrine TGF-β signaling

Mingliang Jin et al. Cell. .

Abstract

TGF-β, essential for development and immunity, is expressed as a latent complex (L-TGF-β) non-covalently associated with its prodomain and presented on immune cell surfaces by covalent association with GARP. Binding to integrin αvβ8 activates L-TGF-β1/GARP. The dogma is that mature TGF-β must physically dissociate from L-TGF-β1 for signaling to occur. Our previous studies discovered that αvβ8-mediated TGF-β autocrine signaling can occur without TGF-β1 release from its latent form. Here, we show that mice engineered to express TGF-β1 that cannot release from L-TGF-β1 survive without early lethal tissue inflammation, unlike those with TGF-β1 deficiency. Combining cryogenic electron microscopy with cell-based assays, we reveal a dynamic allosteric mechanism of autocrine TGF-β1 signaling without release where αvβ8 binding redistributes the intrinsic flexibility of L-TGF-β1 to expose TGF-β1 to its receptors. Dynamic allostery explains the TGF-β3 latency/activation mechanism and why TGF-β3 functions distinctly from TGF-β1, suggesting that it broadly applies to other flexible cell surface receptor/ligand systems.

Keywords: TGF-b signaling; TGF-b1; TGF-b3; activation; autocrine signaling; avb8 integrin; dynamic allostery; entropy redistribution; furin; latency; paracrine signaling; regulatory T cells; single-particle cryo-EM.


Conflict of interest statement

Declaration of interests S.L.N. is on the scientific advisory board (SAB) of Corbus Pharmaceuticals, LLC. Y.C. is on the SABs of ShuiMu BioSciences Ltd. and Pamplona Therapeutics. A provisional patent has been filed by the Regents of the University of California.

Figures
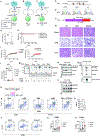
Figure 1.
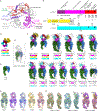
Figure 1.. Autocrine TGF-β1 signaling without release prevents lethal tissue inflammation caused by global TGF-β1 deficiency
(A-C) Cartoons of autocrine and paracrine TGF-β1 signaling in wild type (WT/WT, A), tgfb1−/− (KO/KO, B) and knock-in (KI/KI, C) mice with furin cleavage site mutation (tgfbR278A/R278A). Inset shows symbol key. KI/KI mice generated as in Figure S2A. (D) Schematic showing location of recombined targeted tgfb1 locus on chromosome 7 (GenBank: M13177.1). (E) Sequencing chromatograms of WT/WT, WT/KI and KI/KI mice with corresponding sequence shown above. (F) Schematic of one TGF-β1 protein monomer and position of LAP, furin cleavage site, mutated R278A sequence, and mature TGF-β1 peptide. (G) Body weights of KO/KO mice at post-natal day 18 compared to littermate WT/KO controls. Shown is the mean and standard error (s.e.m.). *p<0.05 Student’s t-test. (H) KI/KI, WT/KI and WT/WT mice survive to adulthood compared to KO/KO mice which die by 24 days of multiorgan inflammation. **** p<0.0001 of all groups compared to KO/KO by Mantel-Cox. (I) Body weights over time of KI/KI, WT/KI and WT/WT mice. (J) Body weights over time of KI/KI mice born from KI/KI or WT/KI dams. (K) Organ histology (heart, upper; lung, middle; liver, lower panels) showing hematoxylin and eosin staining of representative fields of tissue sections from WT/WT (left), KI/KI (middle), KO/KO (right) mice (n ≥ 5 mice). Bar = 30 μm. (L) Scatter plots of disease scores from mice KO/KO (n=6), WT/WT (n=6), WT/KI (n=5), KI/KI (n=6) mice, represented by filled circles, open circles, open squares, or red filled triangles respectively. Shown is mean, s.e.m.. ANOVA followed by Tukey’s multiple comparison test, ****p<0.0001. (M) Anti-mature TGF-β1 immunoblot using equal amounts of plasma, or organ lysates (kidney, liver, lung, or spleen), under reducing conditions, from WT/WT, KO/KO or KI/KI mice. + or − below indicate respective genotypes. Positions of molecular weight markers (MWM) on left. Expected positions of ~50kDa and 12.5kDa uncleaved and cleaved TGF-β1 bands on right. Below, immunoblot using anti-actin as a protein loading control. (N) CD4+ T-cells from WT/WT or KI/KI mice cultured on BSA or immobilized αvβ8tr, as indicated below image. Mature TGF-β1 detected by immunoblotting as in M. Upper: shorter exposure; middle: longer exposure to show mature TGF-β1 in WT CD4+ T-cells. Lower panel represents same membrane stripped and reprobed with anti-actin. Shown is a representative experiment (n=3). (O) Non-cleaved TGF-β1 is present on the surface of WT CD4+ T-cells. Activated WT mouse CD4+ T-cell surface biotinylation, capture on streptavidin agarose (SA), and detection as above. Below, membrane stripped and reprobed with anti-Na+/K+ ATPase, as a cell membrane marker. Shown is a representative experiment of 3 with similar results. (P) Same lysates from activated CD4+T-cells from N, demonstrating (upper panel) increased αvβ8-mediated TGF-β signaling detected by anti-phospho-SMAD2/3 (pSMAD2/3). Note pSMAD2 migrates slightly slower than pSMAD3; total SMAD2/3 (middle); actin (lower). Shown is a representative experiment (n=3). (Q) Cartoon showing generation of induced-Treg (iTreg). (R) CD4+ T-cells in activating conditions from KI/KI compared to controls, WT/WT (or WT/KI) mice plated on BSA (± recombinant TGF-β1 as a positive control) or immobilized αvβ8 ectodomain, as indicated. CD4+ T-cells stained with anti-FoxP3 and anti-CD25 and representative quadrant scatterplots shown. FoxP3+, CD25+ Treg in the upper right quadrant. (S) Graphs showing Treg as percentage of activated CD4+ T-cells. Shown is s.e.m. ns = not significant. (T) Representative scatterplots of peripheral blood mononuclear cells (PBMC) from KI/KI, and age and littermate matched controls (WT/WT or WT/KI), as indicated, and stained as in R. (U, V) Treg enumerated from adult mouse PBMC (n=9 WT/WT and WT/KI; n=8 KI/KI) (U); or spleen at post-natal day ~18–21, n=6 WT/WT and WT/KI; n=3 KI/KI)(V) show no decrease in Treg compared with reduced Treg percentages in KO/KO mice (Figure S2). Shown is s.e.m. ns = not significant. *p<0.05 See also Figure S2.
Figure 2.
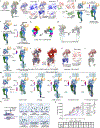
Figure 2.. Structures and conformational flexibility of L-TGF-β1/GARP alone and bound with αvβ8
(A) Atomic model of L-TGF-β1 dimer with domain in protomer A colored and marked. (B) Schematic of L-TGF-β1/GARP constructs. Numbering starts after signal peptide. Two protomers and their respective RGD motif or RGE mutations, resolved cysteines, TGF-βR2 binding sites, and GARP transmembrane truncation indicated. (C) Density maps of αvβ8/L-TGF-β1/GARP complex displayed with two thresholds, low in transparent grey, high in solid color. Color code: integrin αv-green, β8-blue. (D) and (E) Density maps of L-TGF-β1/GARP (D) and αvβ8 (E) determined from classification of (C). (F) Density maps of 13 sub-classes of αvβ8/L-TGF-β1/GARP, arranged from best to least resolved L-TGF-β1/GARP. Maps of class 3 −12 displayed at same two thresholds. Color scheme of L-TGF-β1 follows schematic in (A). Percentage below each map represents fraction of particles of the class. Bars are colored as in (A), with the unresolved regions shown in white. (G) Five selected classes from (F) illustrating L-TGF-β1 motion relative to αvβ8. Ribbon diagram of αvβ8 and L-TGF-β1 docked within maps, arbitrarily colored. (H) Comparison between sub-classes shown in (G) illustrate increased flexibility (class 3 vs. 7), degree and direction of motion (class 3 vs. 5, and 4 vs. 6). Structures aligned to each other using αv β-propeller domain showing L-TGF-β/GARP rocking on top of αvβ8. See also Figure S3.
Figure 3.
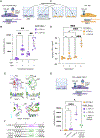
Figure 3.. Spatial entropy redistribution upon L-TGF-β1/GARP binding to αvβ8
(A) Density maps of L-TGF-β1/GARP (left) independently determined and αvβ8/L-TGF-β1/GARP (right, Class 1 from Figure 2F) docked with refined atomic model. (B) and (C) Ribbon diagram of L-TGF-β1/GARP (B), and αvβ8/L-TGF-β1/GARP (C). Residues colored by normalized B-factors with range indicated by scale bar. Two enlarged views show lasso loop (upper) and RGD containing arm domain (lower). Dashed loop, lower panel (B), indicates unresolved RGD loop. (D) Ribbon diagram of L-TGF-β1 colored with normalized B-factor changes before and after binding to αvβ8, decreased (green), increased (red). Arm domain binding to integrin becomes stabilized (lower dashed box with enlarged view), while straitjacket (containing the lasso, upper dashed box with enlarged view) and GARP become more flexible. (E) Model illustrating conformational entropy redistribution upon complex formation. Different regions are circled with colored dashed lines. ΔS<0, reduction of local entropy; ΔS>0, increase of local entropy; ΔS≈0, no change in local entropy. Blurring of ribbon diagrams indicates domain flexibility observed in structures. (F) Predicted spatial entropy redistribution upon L-TGF-β1/GARP/MHG8 binding to αvβ8. Labeling nomenclature same as (E). (G) and (H) Two different views of αvβ8/L-TGF-β1/GARP/MHG8 map (G) and docked with atomic model (H). L-TGF-β1/GARP/MHG8 is almost entirely resolved. Only a very small part of the integrin head domain is resolved. (I) Predicted spatial entropy redistribution upon L-TGF-β1/GARP binding to αvβ8fl-nd. (J) Comparison of local resolutions between reconstructions of αvβ8tr and αvβ8fl-nd in complex with L-TGF-β1/GARP. Local resolutions color coded by same scale. Both densities are displayed with two density thresholds. (K) Ribbon diagram of αvβ8fl-nd/L-TGF-β1/GARP. Residues colored by normalized B-factors with range indicated by scale bar. Enlarged views within dashed boxes show lasso loop (upper) and RGD containing arm domain (lower). (L) Ribbon diagram of αvβ8/L-TGF-β1/GARP colored with changes of normalized B-factor between αvβ8fl-nd and αvβ8tr in complex with L-TGF-β1/GARP, decreased (green) and increased (red). (M) Predicted entropy redistribution upon binding of soluble αvβ8tr, αvβ8fl-nd and immobilized αvβ8tr to cell membrane bound L-TGF-β1/GARP. Labeling nomenclature same as (E). Anchoring in cell membrane presumably increases stability of L-TGF-β1/GARP (panel 1). Upon binding αvβ8tr, conformational entropy is redistributed from L-TGF-β1 arm towards integrin αvβ8 (panel 2). Stabilization of αvβ8tr via clasped and nanodisc reconstitution of αvβ8fl redistributes conformational entropy largely towards straitjacket domain (panel 3 and 4). Immobilizing αvβ8tr drives entropy redistribution almost entirely towards the straitjacket, inducing sufficient flexibility for efficient TGF-β activation (panel 5 and 6). (N) Schematics showing design of TMLC reporter cell assays of TGF-β activation without αvβ8 (1), soluble αvβ8tr without (2) or with C-terminal constraint (3), soluble αvβ8fl-nd (panel 4), or globally stabilized immobilized αvβ8tr (5), or clasped αvβ8tr (6). (O) Activation of TGF-β by soluble and immobilized αvβ8tr (clasped and unclasped), αvβ8fl-nd and immobilized αvβ8tr using the assay configuration and numbering as in (N). See also Figure S4.
Figure 4.
Figure 4.. Intrinsic flexibility of L-TGF-β3/GARP leads to high basal activation of TGF-β3
(A) Schematic diagram of L-TGF-β3/GARP constructs, with all domains annotated and colored as in Figure 2A. (B) Left: Density map of L-TGF-β3/GARP with domains colored as in (A). Bars are colored following convention in (A), with the exception that unresolved regions are shown in white. Right: The same map (transparent) with ribbon diagram of L-TGF-β3/GARP displayed within. (C) Comparison of maps of L-TGF-β1/GARP (transparent grey) and L-TGF-β3/GARP (colored solid surface) shows arm domain of L-TGF-β3/GARP is more flexible than L-TGF-β1/GARP. (D) Ribbon diagram of L-TGF-β3 with residues colored by normalized B-factors with scale bar. Two enlarged views within dashed boxes show lasso loop (upper) and RGD containing arm domain (lower). (E) A consensus model of L-TGF-β1/GARP and L-TGF-β3/GARP with each Cα represented by a ball and colored with difference of normalized B-factors between L-TGF-β1/GARP and L-TGF-β3/GARP. Note B-factors of entire L-TGF-β3, particularly straitjacket (upper dashed box) and arm domains (lower dashed box), are much higher (~50Å2) than L-TGF-β1/GARP, indicating L-TGF-β3 is more flexible than L-TGF-β1 presented by GARP. (F) Mass photometry histogram: Peaks correspond to L-TGF-β3/GARP or αvβ8 alone (~190kd), L-TGF-β3/GARP with one (~390kd), or two αvβ8 integrins (~590kd). (G) Density map of L-TGF-β3/GARP bound with one αvβ8 at two thresholds. Disappearance of major part of L-TGF-β3/GARP indicates extensive flexibility upon binding to αvβ8. (H) Density map reconstructed from all particles of L-TGF-β3 bound with one αvβ8. Map displayed at two thresholds. (I) Upper row: 3D classification of all particles in (H) show flexibility of L-TGF-β3 bound with αvβ8. Bottom row: fitted atomic models of αvβ8 and L-TGF-β3 into corresponding maps shown in upper row. (J) Cartoon of mechanistic model of intrinsic (left) versus αvβ8-induced flexibility of L-TGFβ3/GARP (right). See also Figure S5.
Figure 5.
Figure 5.. αvβ8 binding to L-TGF-β3 is sufficient to release mature TGF-β3
(A) Cartoon of TGF-β activation assay, with TMLC cells transfected and sorted to express equivalent levels of L-TGF-β1/GARP or L-TGF-β3/GARP on cell surfaces, cultured on either BSA or αvβ8 coated wells. (B) TMLC cells expressing either L-TGF-β1/GARP (purple squares) or L-TGF-β3/GARP (purple inverted triangles) were cultured overnight on the indicated substrates and luciferase activity detected and reported as luminescence in relative light units (RLU). **p<0.01 by one-way ANOVA followed by Tukey’s post-test. (C) Cartoon of TGF-β activation assay showing supernatants (A) (L-TGF-β1/GARP (yellow squares) or L-TGF-β3/GARP (yellow inverted triangles)) applied to wild-type (WT) TMLC cells detecting released TGF-β. (D) Following overnight culture in format shown in (C) luciferase activity was detected. Results (C, D) shown as active TGF-β (ng/ml). ***p<0.001 by one-way ANOVA followed by Tukey’s post-test. (E) Upper panel: Ribbon models and filtered densities for L-TGF-β1 and L-TGF-β3 lasso-loops. Proline residues of lasso loops, used as landmarks, indicated. Middle panel: Sequence position and species conservation (larger fonts indicate higher conservation) below ribbon models. Lower panel: Overlays of L-TGF-β1 and L-TGF-β3 models in two views illustrating lasso3 does not cover the TGF-βR2 binding site of mature TGF-β as effectively as lasso1. (F) Sequence alignment showing lasso region of L-TGF-β1, -β3, and chimeric L-TGF-β1 with swapped lasso of L-TGF-β3. (G) Lasso3 domain destabilizes L-TGF-β1/GARP. Upper: Cartoon. Lower: TMLC stably expressing GARP transfected with constructs encoding L-TGF-β1 (purple square), L-TGF-β3 (purple inverted triangles), or L-TGF-β1 with swapped lasso3 (TGF-β1_lasso3 chimera, green inverted triangles) and sorted for equivalent expression. WT TMLC (yellow circles) or L-TGF-β/GARP expressing cell lines were cultured overnight and luciferase activity reported as luminescence (RLU). *p<0.05, ****p<0.0001 by one-way ANOVA followed by Sidak’s multiple comparison test. See also Figure S6.
Figure 6.
Figure 6.. Intrinsic and integrin-induced entropy of L-TGF-β determines signaling directionality
(A) Carton of design of dual TGF-β reporter system, TMLC (purple) and MFB-F11 (red), are co-cultured (left). Shown are stably expressed reporter constructs with SMAD-binding elements (SBE) driving indicated reporter proteins, luciferase or secreted alkaline phosphatase (SEAP). (B) MFB-F11 reporter cells stably transduced with an integrin β8 (ITGB8) expression construct sorted for high αvβ8 expression, using an anti-β8 antibody. Histogram demonstrates expression of αvβ8 only seen in ITGB8 transfected (red curve), not non-transfected (NT) cells (black curve). (C) Mixing αvβ8 expressing MFB-F11 cells with L-TGF-β1/GARP presenting TMLC cells is required and sufficient to activate TGF-β signaling pathway on L-TGF-β1/GARP expressing cells but not αvβ8 expressing cells. L-TGF-β1(RGD)/GARP TMLC (filled squares), L-TGF-β1(RGE)/GARP TMLC (open triangles, characterized as Figure S3B). Results (vertical axis) normalized against standard TGF-β activation curve. **p<0.01, ***p<0.001 by one-way ANOVA followed by Sidak’s multiple comparison test. (D) Upper: Transfection of TMLC cells stably expressing GARP and co-transfected with either wild-type L-TGF-β1 or L-TGF-β3 IRES GFP plasmids. Surface expression of L-TGF-β1 and L-TGF-β3 are equivalent. Lower: Co-culture of wild type MFB-F11 (−), or αvβ8 transfected (+) MFB-F11 cells (indicated below graph) with wild type TMLC (black circles), or TMLC expressing L-TGF-β1/GARP (blue filled squares) or L-TGF-β3/GARP (green triangles). Left: TMLC cells have significant basal levels of active TGF-β3 even when cultured without αvβ8-expressing MFB-F11, but further increased by coculture with αvβ8-expressing MFB-F11 cells. Right: Increased SEAP only seen when TMLC L-TGF-β3/GARP cells are cocultured with αvβ8-expressing MFB-F11. Results shown as arbitrary light units (AU). **p<0.01, ***p<0.001 by one-way ANOVA followed by Sidak’s multiple comparison test, with the exception that results for L-TGF-β3/GARP cells on wild type MFB-F11 or MFB-F11 αvβ8 expressing cells are shown as a paired t-test. (E) TGF-βR2 binds more efficiently to αvβ8 bound L-TGF-β3/GARP compared to L-TGF-β1/GARP. Upper: cartoon showing sequential immobilization of αvβ8 ectodomain, binding of L-TGF-β1 or -β3/GARP complexes, TGF-βR2-Fc (mouse-Fc), and anti-mouse-HRP. Lower: representative experiment (n=3) shown with varying concentrations of TGF-βR2-Fc, signal reported as OD450.
Figure 7.
Figure 7.. Dynamic entropy-based allosteric model of TGF-β activation
(A) Cartoon of intrinsic and integrin-induced TGF-β1 activation. 1) L-TGF-β1/GARP has relatively low basal entropy in straitjacket/lasso, insufficient to trigger significant signaling. 2) Binding αvβ8 stabilizes arm domain but redistributes sufficient entropy to expose mature TGF-β1 to TGF-βRs to trigger signaling. (B) Cartoon of intrinsic and integrin-induced TGF-β3 activation. 3) TGF-β3/GARP has relatively high levels of basal entropy in straitjacket/lasso sufficient to expose mature TGF-β3 to TGF-βRs allowing basal L-TGF-β3 constitutive autocrine signaling. 4) Binding to αvβ8 stabilizes the arm domain redistributing entropy exposing mature TGF-β3 to TGF-βRs, sufficient for paracrine release of mature TGF-β3 for bidirectional signaling to L-TGF-β3 presenting, and αvβ8 expressing cells.

Similar articles

References

    1. Massagué J, and Sheppard D (2023). TGF-β signaling in health and disease. Cell 186, 4007–4037. 10.1016/j.cell.2023.07.036. - DOI - PMC - PubMed
    1. Derynck R, Turley SJ, and Akhurst RJ (2020). TGFβ biology in cancer progression and immunotherapy. Nat Rev Clin Oncol. 10.1038/s41571-020-0403-1. - DOI - PMC - PubMed
    1. Akhurst RJ (2017). Targeting TGF-beta Signaling for Therapeutic Gain. Cold Spring Harb Perspect Biol 9. 10.1101/cshperspect.a022301. - DOI - PMC - PubMed
    1. Annes JP, Munger JS, and Rifkin DB (2003). Making sense of latent TGFbeta activation. J Cell Sci 116, 217–224. - PubMed
    1. Shi M, Zhu J, Wang R, Chen X, Mi L, Walz T, and Springer TA (2011). Latent TGF-beta structure and activation. Nature 474, 343–349. 10.1038/nature10152. - DOI - PMC - PubMed

LinkOut - more resources