. 1999 Jan;119(1):277-88.
doi: 10.1104/pp.119.1.277.

A steep dependence of inward-rectifying potassium channels on cytosolic free calcium concentration increase evoked by hyperpolarization in guard cells

Affiliations

A steep dependence of inward-rectifying potassium channels on cytosolic free calcium concentration increase evoked by hyperpolarization in guard cells

A Grabov et al. Plant Physiol. 1999 Jan.

Abstract

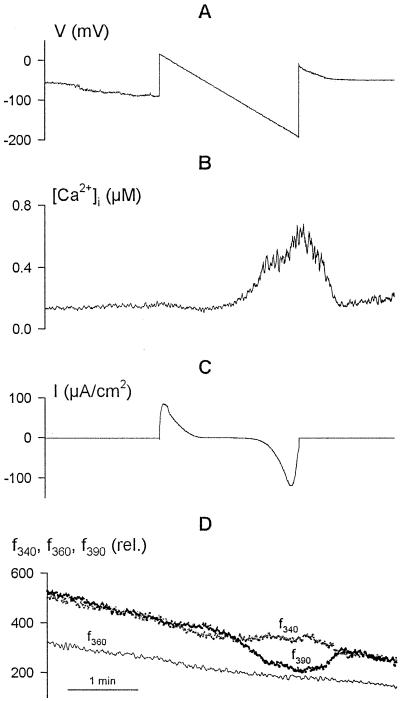
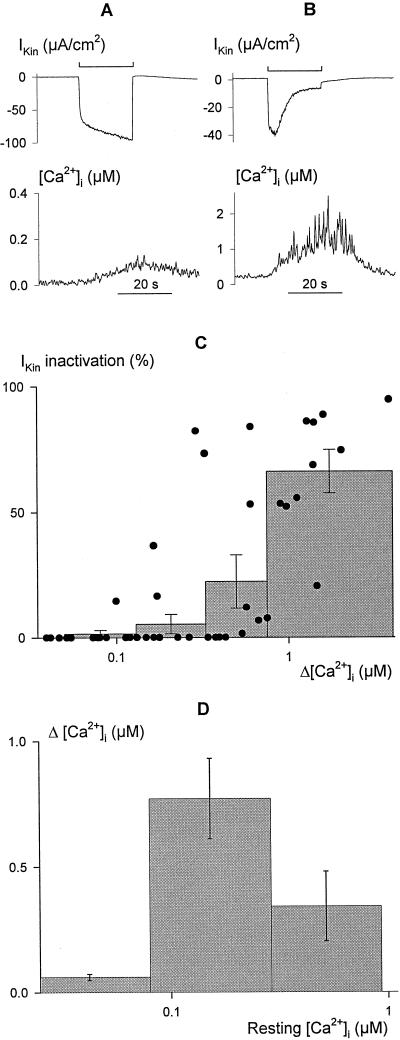
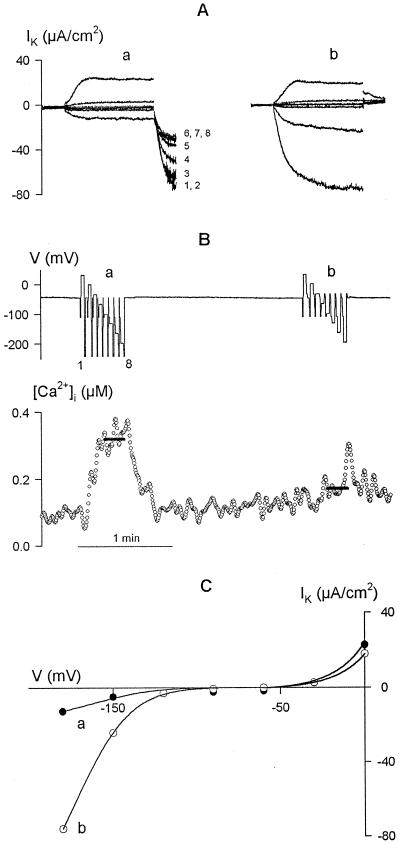
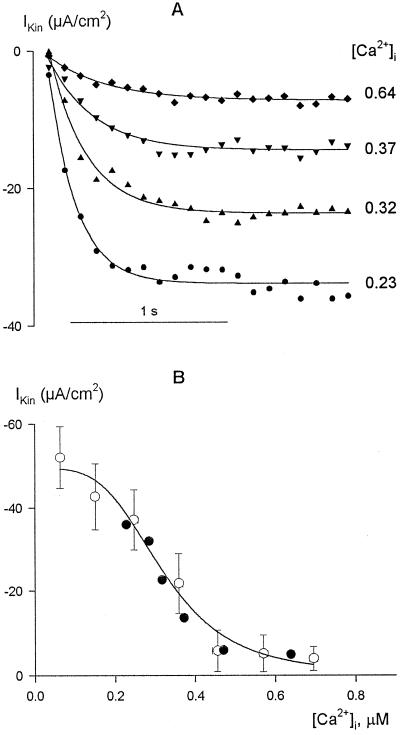
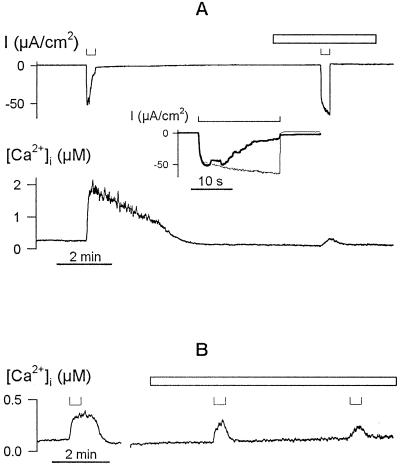
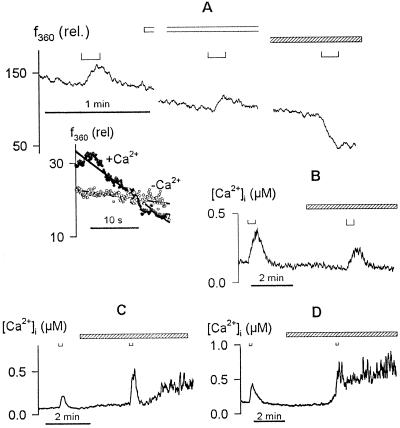
Inactivation of inward-rectifying K+ channels (IK,in) by a rise in cytosolic free [Ca2+] ([Ca2+]i) is a key event leading to solute loss from guard cells and stomatal closure. However, [Ca2+]i action on IK,in has never been quantified, nor are its origins well understood. We used membrane voltage to manipulate [Ca2+]i (A. Grabov and M.R. Blatt [1998] Proc Natl Acad Sci USA 95: 4778-4783) while recording IK,in under a voltage clamp and [Ca2+]i by Fura-2 fluorescence ratiophotometry. IK,in inactivation correlated positively with [Ca2+]i and indicated a Ki of 329 +/- 31 nM with cooperative binding of four Ca2+ ions per channel. IK,in was promoted by the Ca2+ channel antagonists Gd3+ and calcicludine, both of which suppressed the [Ca2+]i rise, but the [Ca2+]i rise was unaffected by the K+ channel blocker Cs+. We also found that ryanodine, an antagonist of intracellular Ca2+ channels that mediate Ca2+-induced Ca2+ release, blocked the [Ca2+]i rise, and Mn2+ quenching of Fura-2 fluorescence showed that membrane hyperpolarization triggered divalent release from intracellular stores. These and additional results point to a high signal gain in [Ca2+]i control of IK,in and to roles for discrete Ca2+ flux pathways in feedback control of the K+ channels by membrane voltage.


Figures

Figure 1
Figure 1
Voltage ramps demonstrate a voltage threshold for increases in [Ca2+]i and consequent inactivation of current carried by IK,in. Concurrent records of voltage (A), [Ca2+]i (B), and clamp current (C) are shown, along with the raw Fura-2 fluorescence recorded on f340, f360, and f390 (D). Data are from one guard cell bathed in 5 mm Ca2+-Mes, pH 6.1, with 10 mm KCl. Slowly ramping membrane voltage from +20 to −200 mV under voltage clamp was accompanied by an appreciable rise in [Ca2+]i at voltages negative of about −120 mV. The outward (positive) current at the start of the voltage ramp is associated with IK,out (Blatt and Grabov, 1997). Activation of inward (negative) current at voltages negative of −120 mV, carried predominantly by IK,in (Blatt and Grabov, 1997), was followed by a near-complete decay in current amplitude during the final 10 s of the ramp and coincident with the [Ca2+]i rise near and above 400 nm. Gradual decay in fluorescence recorded on excitation at all three wavelengths (D) is characteristic of progressive photobleaching of Fura-2 under these conditions. Note the absence any influence of the voltage ramp on the fluorescence trajectory recorded at the isobestic wavelength f360.
Figure 2
Figure 2
Inactivation of current through IK,in is correlated with [Ca2+]i elevation. Voltage steps of 20 s duration from −50 to −200 mV leading to limited (A) and profound (B) increases in [Ca2+]i (bottom trace, note different scales) in two broad bean guard cells. The clamp current (top trace, note different scales) shows the characteristic time course for IK,in activation (A) in the absence of an extensive rise in [Ca2+]i, and activation followed by a decay in current amplitude (B) with the more pronounced rise in [Ca2+]i. C, Summary of relative IK,in inactivation as a function of the change in [Ca2+]i (Δ[Ca2+]i) evoked by 20-s voltage steps from −50 to −200 mV recorded in 52 independent experiments (solid points). Histograms show the means ± se of measurements binned in successive pools of 10 or 11 experiments. Inactivation of IK,in was calculated from the ratio (ImaxIfinal)/Imax, with Imax determined at maximum IK,in amplitude and Ifinal taken as the final current amplitude without correction for instantaneous current. Δ[Ca2+]i values were determined from the mean [Ca2+]i recorded over periods of 1 s immediately before and at the end of the voltage steps. Note that the analysis does not account for measurements in which [Ca2+]i was initially high, nor does it account for measurements in which clamp steps yielded little inward current. The distribution is therefore probably skewed to the right along the x axis, but nonetheless shows that current inactivation was associated with the rise in [Ca2+]i. D, [Ca2+]i elevation (Δ[Ca2+]i) after 20-s steps to −200 mV is dependent on the resting [Ca2+]i level. Data from C plotted as a function of [Ca2+]i before voltage steps to −200 mV. Histograms show the means ± se of measurements binned in successive pools with [Ca2+]i ≤ 80 nm, 80 nm < [Ca2+]I ≤ 300 nm, and [Ca2+]I > 300 nm at rest. Note the logarithmic abscissa. The decline in the mean Δ[Ca2+]i from high starting [Ca2+]i values is not consistent with saturation of the Fura-2 signal.
Figure 3
Figure 3
Inactivation of current through IK,in is evoked by [Ca2+]i elevation. Data are from one guard cell bathed in 5 mm Ca2+-Mes, pH 6.1, with 10 mm KCl. A, Clamp current recorded using standard two-pulse protocols of eight cycles with the addition of a third, 0.5-s intervening step at the end of each cycle to −250 mV (a) or to −30 mV (b). Clamp cycles: 0.5-s conditioning step, −100 mV; 2-s test steps (8) from +20 to −200 mV. B, Voltage (V, top trace) and [Ca2+]i (bottom trace) records with intervening voltage steps numbered according to the cycle (1–8, cross-referenced to currents in A). The mean [Ca2+]i during the final three cycles in each protocol is indicated by the solid lines overlaid on the [Ca2+]i record. C, Steady-state current-voltage characteristic determined from the currents recorded at the end of the test voltage steps in protocols a and b. The curves have not been corrected for the background (“instantaneous”) current.
Figure 4
Figure 4
Inactivation of IK,in shows a steep dependence on [Ca2+]i above resting [Ca2+]i levels. A, Data are from one guard cell bathed in 5 mm Ca2+-Mes, pH 6.1, with 10 mm KCl. IK,in recorded during the first 2 s of 20-s steps to −200 mV with [Ca2+]i elevated by successively decreasing the interstep interval from 90 to 20 s. Data fitted to single-exponential activation curves and points are shown at 100-ms intervals for clarity. [Ca2+]i is on the right (in μm). B, Summary of steady-state IK,in from A (solid symbols) along with means ± se of data from 52 guard cells (open symbols) binned in pools of eight to nine experiments with increasing [Ca2+]i. [Ca2+]i values were determined from the mean [Ca2+]i recorded over the final 1 s of voltage steps after prior stimulation to raise [Ca2+]i (see A) or from equivalent measurements from resting [Ca2+]i conditions. The solid line is the result of nonlinear least-squares fitting of the means to the Hill equation (Eq. 1). Fitted parameters: Ki, 329 ± 31 nm; n (cooperativity coefficient), 4.1 ± 0.5. Statistically equivalent results were obtained when the data were fitted without binning (not shown).
Figure 5
Figure 5
Voltage-evoked [Ca2+]i rise is sensitive to extracellular Ca2+ channel blockers. A, [Ca2+]i increases (trace below) and clamp current (trace above) during 20-s steps from −50 to −200 mV (⊔, above) before and after adding 0.1 mm GdCl3 to the bath. Period of GdCl3 exposure is indicated by the open bar. Data are from one guard cell in 5 mm Ca2+-Mes, pH 6.1, with 10 mm KCl. Inset, Clamp current during steps to −200 mV (⊔, above) replotted on expanded time scale shows characteristic activation of the IK,in current (Grabov and Blatt, 1997) when the [Ca2+]i rise is suppressed in the presence of Gd3+ (fine line) and its time-dependent inactivation when [Ca2+]i rises in the absence of Gd3+ (solid line). B, [Ca2+]i increases evoked during 20-s steps from −50 to −200 mV (⊔, above) before and after adding 0.5 μm calcicludine to the bath. Data are from one guard cell in 5 mm Ca2+-Mes, pH 6.1, with 10 mm KCl. Period of exposure to the Ca2+ channel blocker is indicated by an open bar. Time scale (below), 2 min.
Figure 6
Figure 6
Evoked [Ca2+]i rise is facilitated by Ca2+ release from intracellular stores. A, Fura-2 fluorescence quenching recorded on f360. Data are from one guard cell recorded after intracellular loading with Mn2+ in 20 mm K+-Mes, pH 6.1, and 2 mm MnCl2. Voltage steps of 20 s to −200 mV (⊔, above) applied with the cell bathed in 20 mm K+-Mes, pH 6.1, plus 2 mm CaCl2, then in the same buffer without CaCl2 (open bar), and finally with 2 mm MnCl2 (striped bar). Inset, f360 during the first 20 s after voltage steps without (○) and with (•) Ca2+ outside after normalizing to the fluorescence signal at the start of each voltage step. Note the rapid decay in f360 after voltage stimulus in the presence of external Ca2+. B to D, [Ca2+]i rise was suppressed by 10 μm ryanodine (B) and augmented by 100 μm heparin (C) and 1 mm neomycin sulfate (D). Data are from three guard cells in 5 mm Ca2+-Mes, pH 6.1, with 10 mm KCl. Membrane voltages were clamped to −50 mV in each case. Voltage steps to −200 mV (B) and −180 mV (C and D) are indicated above (⊔). Times of treatments with ryanodine, heparin, and neomycin sulfate are indicated by the open bars in each case. Note the prolonged secondary rise in [Ca2+]i in the presence of heparin and neomycin sulfate.

Similar articles

Cited by

References

    1. Alexandre J, Lassalles JP. Hydrostatic and osmotic pressure activated channel in plant vacuole. Biophys J. 1991;60:1326–1336. - PMC - PubMed
    1. Allen GJ, Muir SR, Sanders D. Release of Ca2+ from individual plant vacuoles by both insp(3) and cyclic ADP-ribose. Science. 1995;268:735–737. - PubMed
    1. Allen GJ, Sanders D. Calcineurin, a type 2B protein phosphatase, modulates the Ca2+-permeable slow vacuolar ion channel of stomatal guard cells. Plant Cell. 1995;7:1473–1483. - PMC - PubMed
    1. Allen GJ, Sanders D. Control of ionic currents in guard cell vacuoles by cytosolic and luminal calcium. Plant J. 1996;10:1055–1069. - PubMed
    1. Armstrong F, Blatt MR. Evidence for K+ channel control in Vicia guard cells coupled by G-proteins to a 7TMS receptor. Plant J. 1995;8:187–198.

LinkOut - more resources