Regulation of proliferation-survival decisions during tumor cell hypoxia
- PMID: 9566903
- PMCID: PMC110663
- DOI: 10.1128/MCB.18.5.2845
Regulation of proliferation-survival decisions during tumor cell hypoxia
Abstract
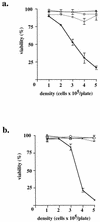
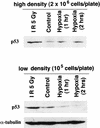
Hypoxia may influence tumor biology in paradoxically opposing ways: it is lethal as a direct stress trigger, yet hypoxic zones in solid tumors harbor viable cells which are particularly resistant to treatment and contribute importantly to disease relapse. To examine mechanisms underlying growth-survival decisions during hypoxia, we have compared genetically related transformed and untransformed fibroblast cells in vitro for proliferation, survival, clonogenicity, cell cycle, and p53 expression. Hypoxia induces G0/G1 arrest in primary fibroblasts but triggers apoptosis in oncogene-transformed derivatives. Unexpectedly, the mechanism of apoptosis is seen to require accumulated acidosis and is rescued by enhanced buffering. The direct effect of hypoxia under nonacidotic conditions is unique to transformed cells in that they override the hypoxic G0/G1 arrest of primary cells. Moreover, when uncoupled from acidosis, hypoxia enhances tumor cell viability and clonogenicity relative to normoxia. p53 is correspondingly upregulated in response to hypoxia-induced acidosis but downregulated during hypoxia without acidosis. Hypoxia may thus produce both treatment resistance and a growth advantage. Given strong evidence that hypoxic regions in solid tumors are often nonacidotic (G. Helmlinger, F. Yuan, M. Dellian, and R. K. Jain, Nat. Med. 3:177-182, 1997), this behavior may influence relapse and implicates such cells as potentially important therapeutic targets.
Figures


Similar articles
-
Acidosis reduces neuronal apoptosis.Neuroreport. 1998 Mar 30;9(5):875-9. doi: 10.1097/00001756-199803300-00021. Neuroreport. 1998. PMID: 9579683
-
Hypoxia-mediated selection of cells with diminished apoptotic potential in solid tumours.Nature. 1996 Jan 4;379(6560):88-91. doi: 10.1038/379088a0. Nature. 1996. PMID: 8538748
-
Arsenic trioxide inhibits the growth of human lung cancer cell lines via cell cycle arrest and induction of apoptosis at both normoxia and hypoxia.Toxicol Ind Health. 2009 Sep;25(8):505-15. doi: 10.1177/0748233709345936. Toxicol Ind Health. 2009. PMID: 19825857
-
Hypoxia-mediated drug resistance: novel insights on the functional interaction of HIFs and cell death pathways.Drug Resist Updat. 2011 Jun;14(3):191-201. doi: 10.1016/j.drup.2011.03.001. Epub 2011 Apr 3. Drug Resist Updat. 2011. PMID: 21466972 Review.
-
Hypoxia-induced dedifferentiation of tumor cells--a mechanism behind heterogeneity and aggressiveness of solid tumors.Semin Cell Dev Biol. 2005 Aug-Oct;16(4-5):554-63. doi: 10.1016/j.semcdb.2005.03.007. Epub 2005 Apr 26. Semin Cell Dev Biol. 2005. PMID: 16144692 Review.
Cited by
-
IGF-I activates PKB and prevents anoxic apoptosis in Achilles tendon cells.J Orthop Res. 2005 Sep;23(5):1219-25. doi: 10.1016/j.orthres.2004.12.011. Epub 2005 Apr 20. J Orthop Res. 2005. PMID: 16140203 Free PMC article.
-
The Aqueous Soluble Polyphenolic Fraction of Psidium guajava Leaves Exhibits Potent Anti-Angiogenesis and Anti-Migration Actions on DU145 Cells.Evid Based Complement Alternat Med. 2011;2011:219069. doi: 10.1093/ecam/neq005. Epub 2011 Jun 8. Evid Based Complement Alternat Med. 2011. PMID: 21799674 Free PMC article.
-
Involvement of the mRNA binding protein CRD-BP in the regulation of metastatic melanoma cell proliferation and invasion by hypoxia.J Cell Sci. 2012 Dec 15;125(Pt 24):5950-4. doi: 10.1242/jcs.115204. Epub 2012 Oct 4. J Cell Sci. 2012. PMID: 23038779 Free PMC article.
-
Diagnostic, prognostic and therapeutic implications of carbonic anhydrases in cancer.Br J Cancer. 2003 Jul 7;89(1):2-7. doi: 10.1038/sj.bjc.6600936. Br J Cancer. 2003. PMID: 12838292 Free PMC article. Review.
-
ACLY and ACC1 Regulate Hypoxia-Induced Apoptosis by Modulating ETV4 via α-ketoglutarate.PLoS Genet. 2015 Oct 9;11(10):e1005599. doi: 10.1371/journal.pgen.1005599. eCollection 2015 Oct. PLoS Genet. 2015. PMID: 26452058 Free PMC article.
References
-
- Acker H, Holtermann G, Carlsson J. Influence of glucose on metabolism and growth of rat glioma cells in multicellular spheroid culture. Int J Cancer. 1992;52:279–285. - PubMed
-
- Barry M A, Eastman A. Endonuclease activation during apoptosis: the role of cytosolic Ca 2+ and pH. Biochem Biophys Res Commun. 1992;186:782–789. - PubMed
-
- Barry M A, Eastman A. Identification of deoxyribonuclease II as an endonuclease involved in apoptosis. Arch Biochem Biophys. 1993;300:440–450. - PubMed
-
- Barry M A, Reynolds J E, Eastman A. Etoposide-induced apoptosis in human HL-60 cells is associated with intracellular acidification. Cancer Res. 1993;53:2349–2347. - PubMed
-
- Bissell M J, Hatie C, Rubin H. Patterns of glucose metabolism in normal and virus-transformed chick cells in tissue culture. J Natl Cancer Inst. 1972;49:555–565. - PubMed
Publication types
MeSH terms
Substances
Grants and funding
LinkOut - more resources
Full Text Sources
Other Literature Sources
Research Materials
Miscellaneous
