. 1998 Feb 23;140(4):961-72.
doi: 10.1083/jcb.140.4.961.

CAS/Crk coupling serves as a "molecular switch" for induction of cell migration

Affiliations

CAS/Crk coupling serves as a "molecular switch" for induction of cell migration

R L Klemke et al. J Cell Biol. .

Abstract

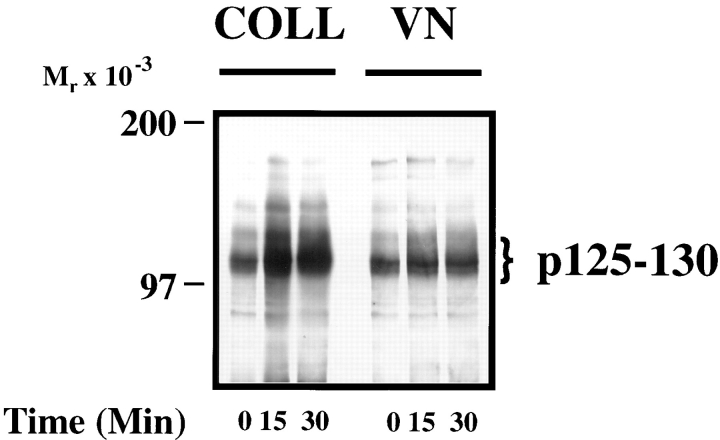
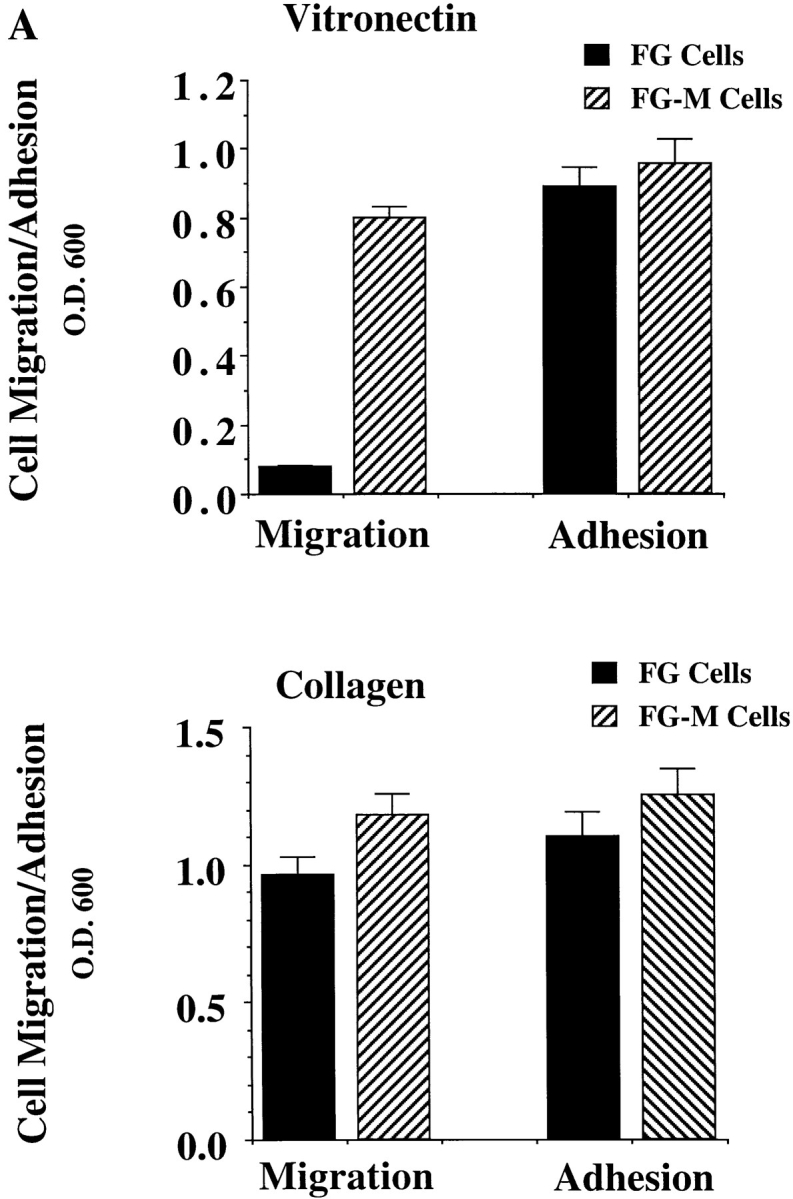
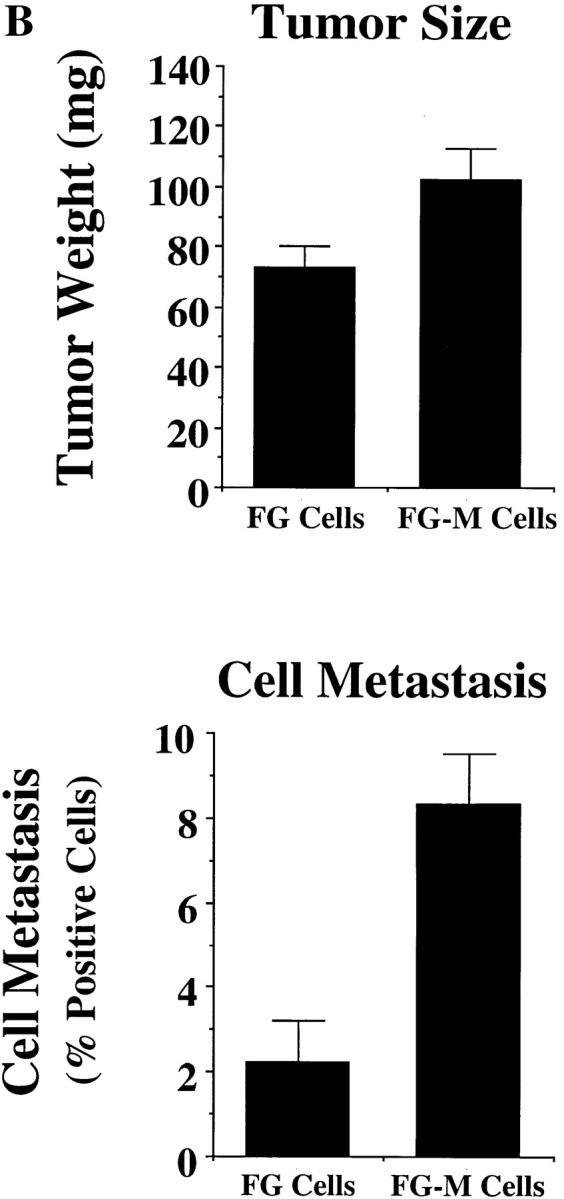
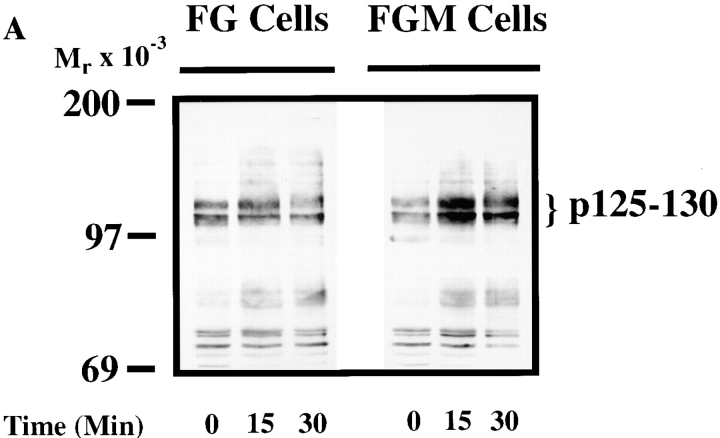
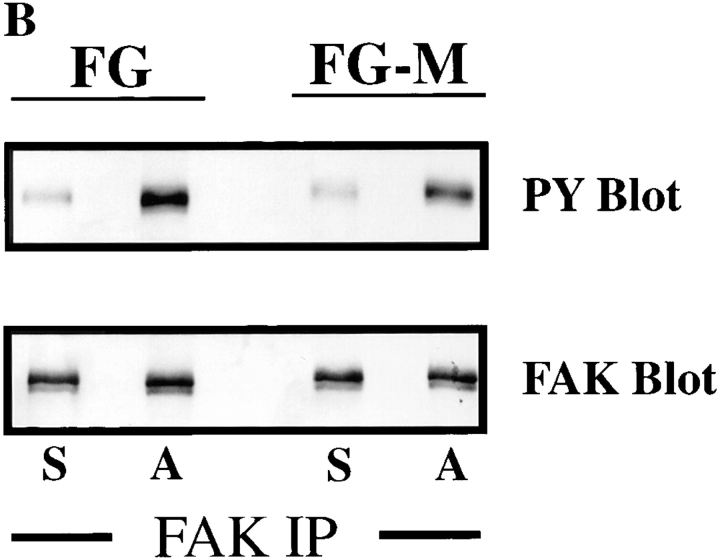
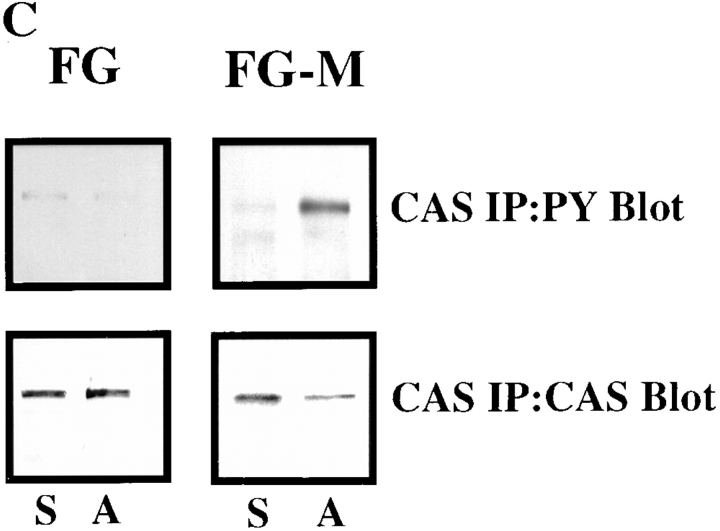
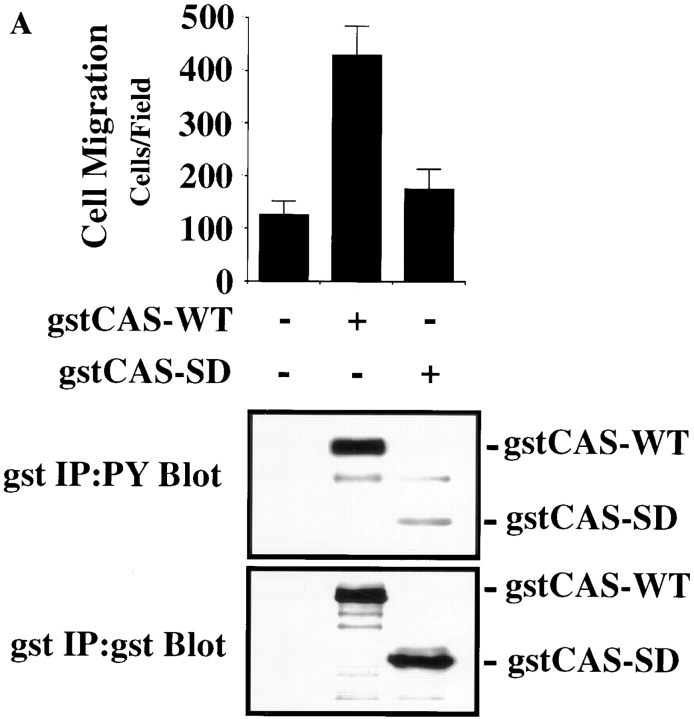
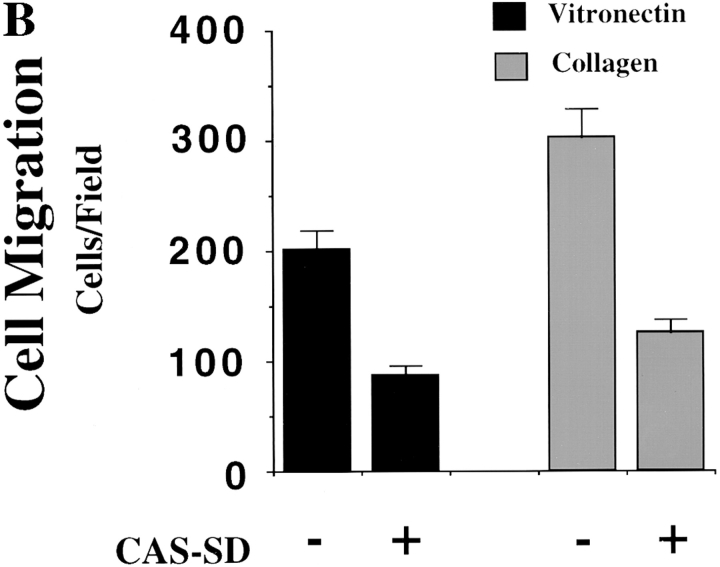
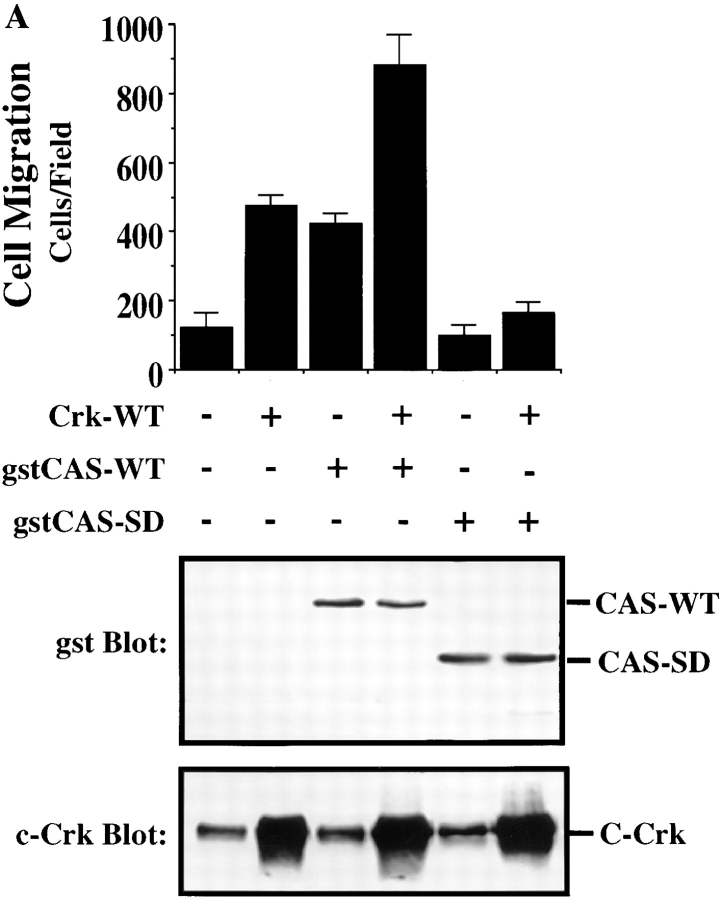
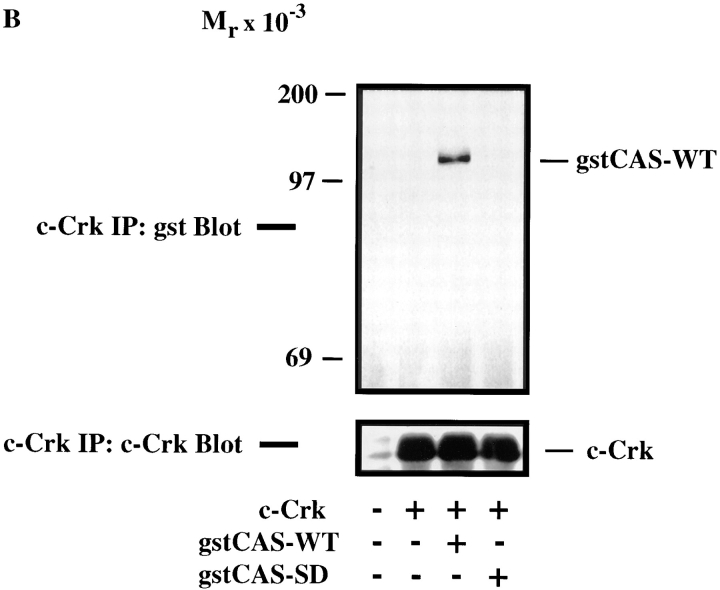
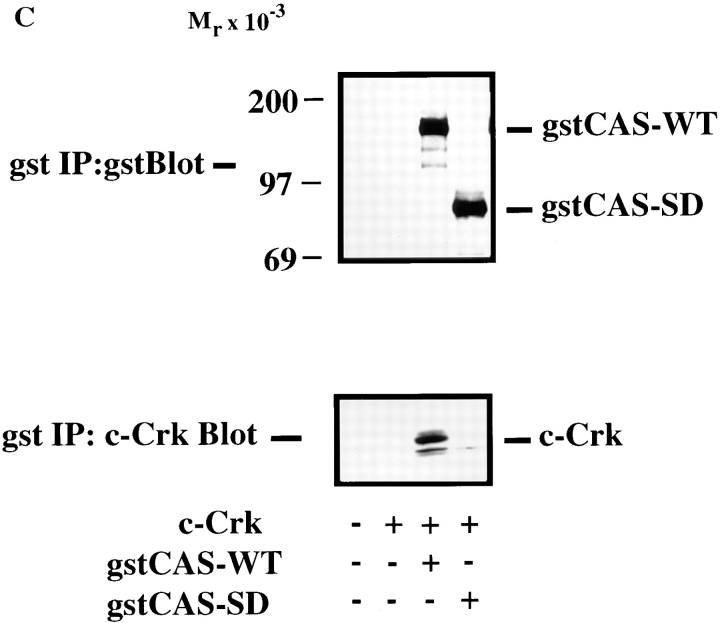
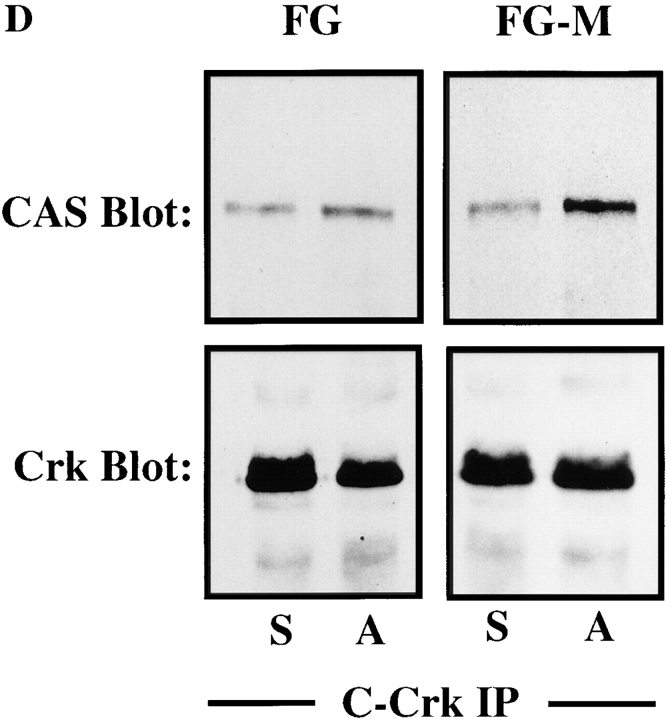
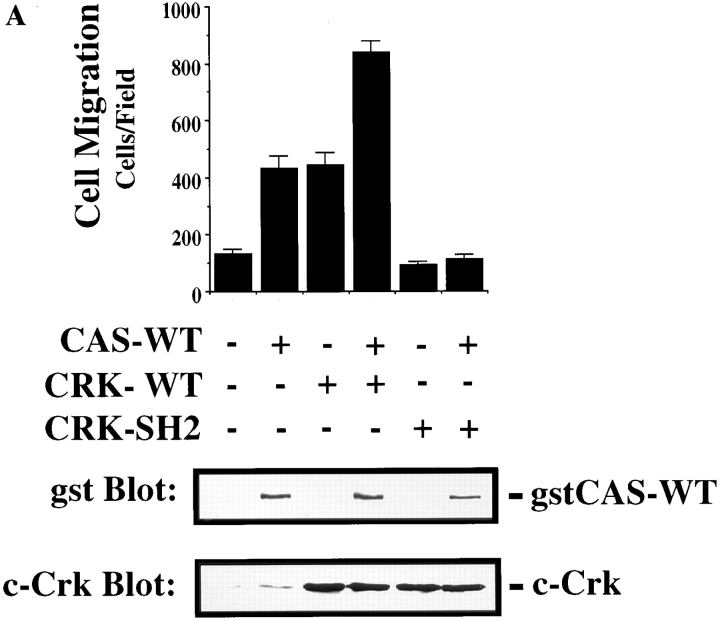
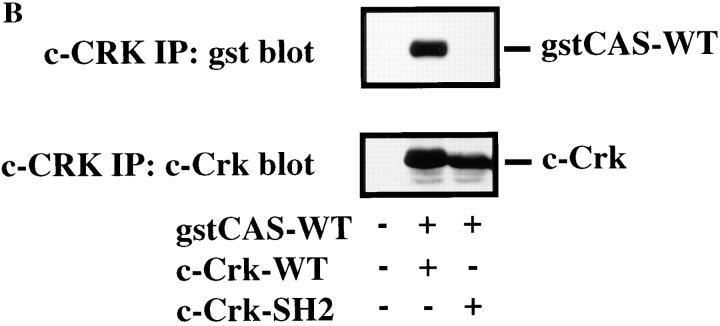
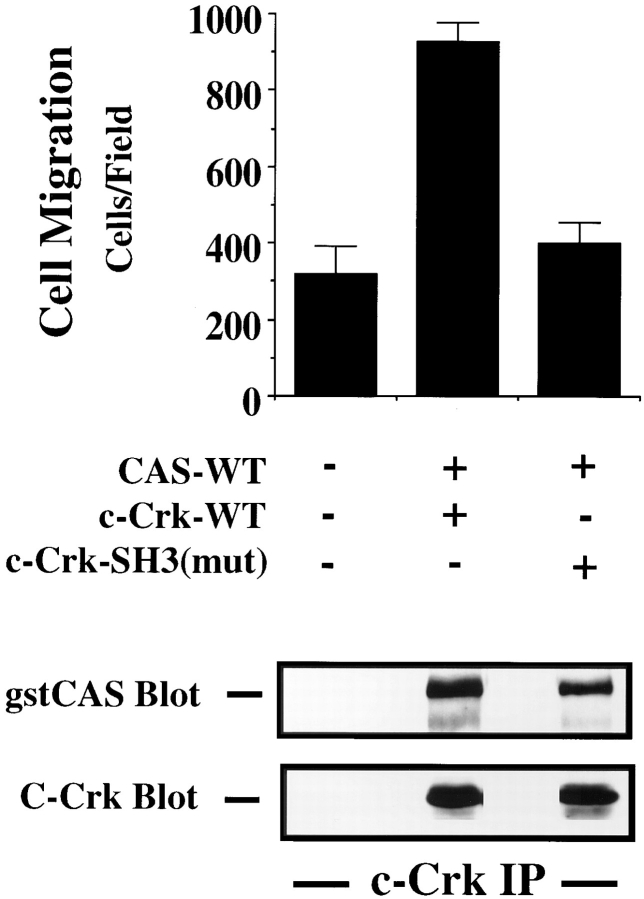
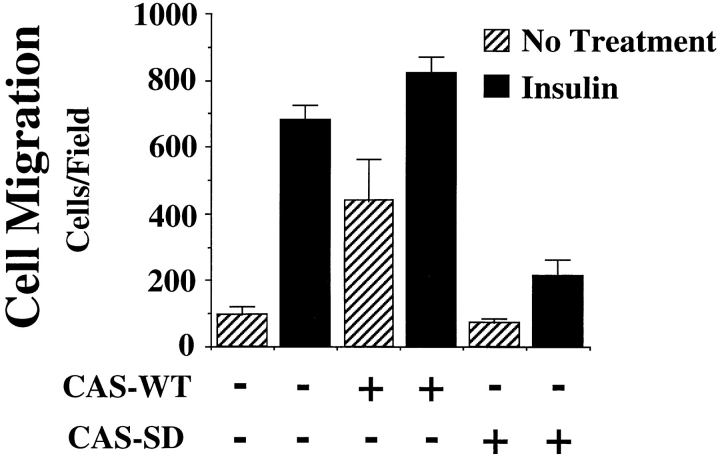
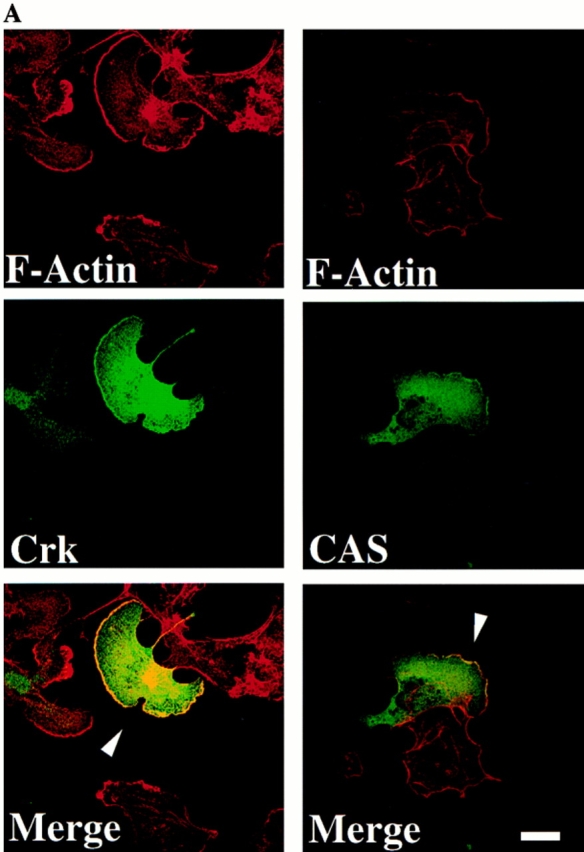
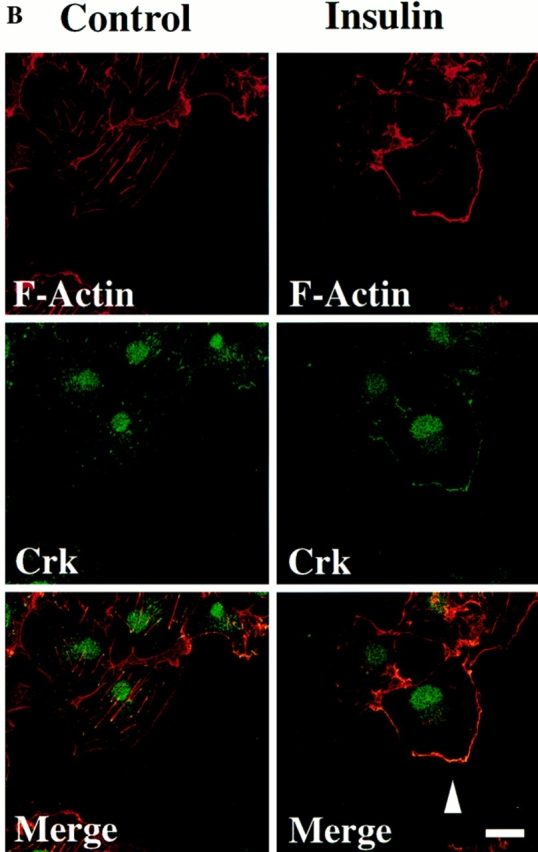
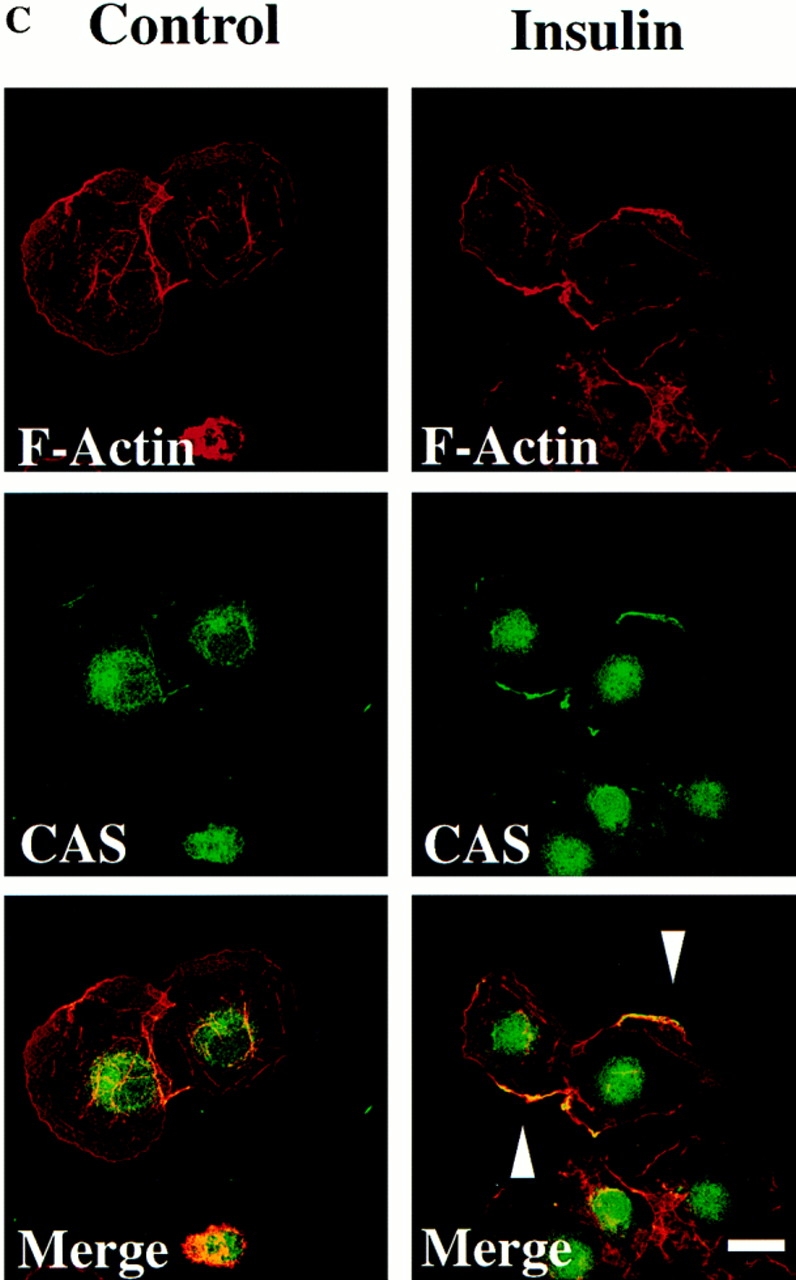
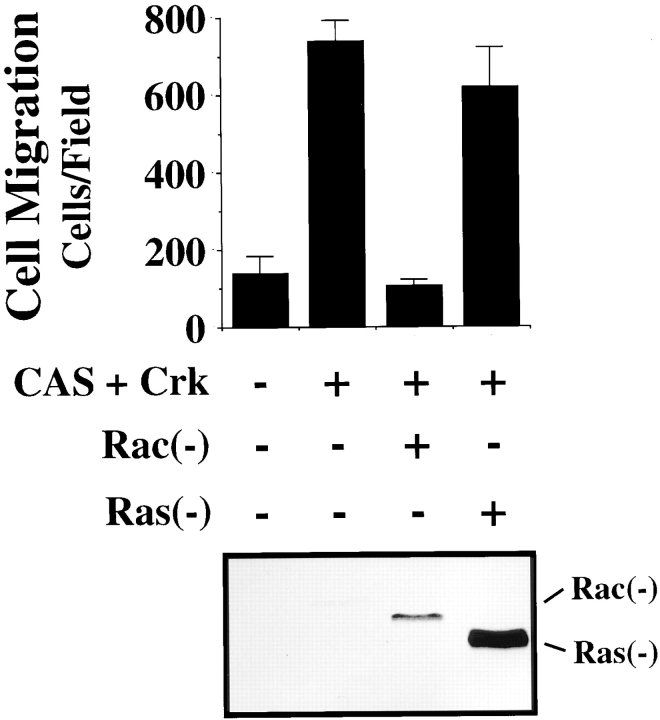
Carcinoma cells selected for their ability to migrate in vitro showed enhanced invasive properties in vivo. Associated with this induction of migration was the anchorage-dependent phosphorylation of p130CAS (Crk-associated substrate), leading to its coupling to the adaptor protein c-CrkII (Crk). In fact, expression of CAS or its adaptor protein partner Crk was sufficient to promote cell migration, and this depended on CAS tyrosine phosphorylation facilitating an SH2-mediated complex with Crk. Cytokine-stimulated cell migration was blocked by CAS lacking the Crk binding site or Crk containing a mutant SH2 domain. This migration response was characterized by CAS/Crk localization to membrane ruffles and blocked by the dominant-negative GTPase, Rac, but not Ras. Thus, CAS/Crk assembly serves as a "molecular switch" for the induction of cell migration and appears to contribute to the invasive property of tumors.


Figures

Figure 1
Figure 1
FG cell migration on collagen is associated with increased tyrosine phosphorylation of p125–130 proteins. Serum-starved FG cells were held in suspension (0 time point) or allowed to attach to Petri dishes coated with collagen (COLL) or vitronectin (VN) for various times before being lysed and examined for changes in tyrosine phosphorylation of total cellular proteins by phosphotyrosine immunoblotting as described in Materials and Methods. Cell migration was determined in modified Boyden chambers (Transwells) coated with either collagen or vitronectin as described in Materials and Methods. Cell migration on collagen (+) was greater than 50% of the cell population in 24 h, while on vitronectin less than 1.0% of the cells migrated.
Figure 2
Figure 2
Comparison of FG and FG-M cell migration in vitro and metastasis in vivo. (A) FG-M cells are a stable cell line derived from FG cells selected for their ability to migrate on a vitronectin substrate as described in Materials and Methods. Cells were allowed to adhere for 30 min to Petri dishes or migrate for 4 h on Transwell migration chambers coated with vitronectin (top) or collagen (bottom) and quantified as described in Materials and Methods. Each bar represents the mean ± SD of triplicate migration wells of one of three representative experiments. (B) FG or FG-M carcinoma cells (5 × 10⁶) inoculated onto chorioallantoic membrane of 9-d-old chick embryos were allowed to form tumors for 9–10 d, at which time the tumors were resected and weighed (top). Pulmonary metastasis (bottom) was measured as described in Materials and Methods. Tumor weight is the mean ± SEM. Percent positive metastasis is the mean ± SEM of the relative percentage of tumor cells in the lungs of the chick embryos. FG-M cells showed a statistically significant increase in metastasis over FG cells (P < 0.01) as determined by Student's t test.
Figure 2
Figure 2
Comparison of FG and FG-M cell migration in vitro and metastasis in vivo. (A) FG-M cells are a stable cell line derived from FG cells selected for their ability to migrate on a vitronectin substrate as described in Materials and Methods. Cells were allowed to adhere for 30 min to Petri dishes or migrate for 4 h on Transwell migration chambers coated with vitronectin (top) or collagen (bottom) and quantified as described in Materials and Methods. Each bar represents the mean ± SD of triplicate migration wells of one of three representative experiments. (B) FG or FG-M carcinoma cells (5 × 10⁶) inoculated onto chorioallantoic membrane of 9-d-old chick embryos were allowed to form tumors for 9–10 d, at which time the tumors were resected and weighed (top). Pulmonary metastasis (bottom) was measured as described in Materials and Methods. Tumor weight is the mean ± SEM. Percent positive metastasis is the mean ± SEM of the relative percentage of tumor cells in the lungs of the chick embryos. FG-M cells showed a statistically significant increase in metastasis over FG cells (P < 0.01) as determined by Student's t test.
Figure 3
Figure 3
FG-M, but not FG cells, show increased tyrosine phosphorylation of p130CAS upon attachment to vitronectin. (A) Serum-starved FG or FG-M cells were held in suspension or allowed to attach to vitronectin-coated Petri dishes for various times before being lysed in detergent and analyzed for changes in tyrosine phosphorylation of total cellular proteins as described in Materials and Methods. The bracket indicates p125–130 proteins that show increased tyrosine phosphorylation in FG-M but not FG cell protein extracts. (B, top) Phosphotyrosine immunoblot of FAK immunoprecipitated from FG or FG-M cells either held in suspension (S) or allowed to attach (A) to vitronectin-coated Petri dishes for 15 min. (B, bottom) Blot was stripped and reprobed with anti-FAK antibodies to confirm equal amounts of protein were precipitated in this experiment. (C) Phosphotyrosine immunoblot of CAS immunoprecipitated from FG or FG-M cells held in suspension (S) or allowed to attach (A) to vitronectin-coated Petri dishes for 15 min. (C, bottom) The blot was reprobed with anti-CAS antibodies to confirm equal amounts of protein were precipitated in this experiment. The result shown is representative of at least three independent experiments.
Figure 3
Figure 3
FG-M, but not FG cells, show increased tyrosine phosphorylation of p130CAS upon attachment to vitronectin. (A) Serum-starved FG or FG-M cells were held in suspension or allowed to attach to vitronectin-coated Petri dishes for various times before being lysed in detergent and analyzed for changes in tyrosine phosphorylation of total cellular proteins as described in Materials and Methods. The bracket indicates p125–130 proteins that show increased tyrosine phosphorylation in FG-M but not FG cell protein extracts. (B, top) Phosphotyrosine immunoblot of FAK immunoprecipitated from FG or FG-M cells either held in suspension (S) or allowed to attach (A) to vitronectin-coated Petri dishes for 15 min. (B, bottom) Blot was stripped and reprobed with anti-FAK antibodies to confirm equal amounts of protein were precipitated in this experiment. (C) Phosphotyrosine immunoblot of CAS immunoprecipitated from FG or FG-M cells held in suspension (S) or allowed to attach (A) to vitronectin-coated Petri dishes for 15 min. (C, bottom) The blot was reprobed with anti-CAS antibodies to confirm equal amounts of protein were precipitated in this experiment. The result shown is representative of at least three independent experiments.
Figure 4
Figure 4
Expression of CAS in cells is sufficient to induce cell migration. (A, top) Serum-starved COS cells were allowed to migrate for 3 h on vitronectin-coated membranes after transient transfection with either the empty expression vector or the expression vector containing gst-tagged wild-type CAS (gstCAS-WT) or gst-tagged CAS lacking a substrate domain (i.e., aa 213–514 and tyr-377 to tyr-414; gstCAS-SD). The number of transfected cells migrating were enumerated by counting cells on the underside of the membrane that coexpressed a β-galactosidase vector as described in Materials and Methods. Each bar represents the mean ± SD of triplicate migration wells of one of three representative experiments. Identical results were obtained with cells transfected with wild-type CAS or CAS-SD without the gst tag (data not shown). (A, middle) Phosphotyrosine immunoblot of gstCAS-WT and gstCAS-SD immunoprecipitated from COS cells treated as for the migration assay above and attached to the culture dish. (A, bottom) The blot was reprobed with anti-gst antibodies to confirm equal loading of gstCAS-WT and gstCAS-SD. (B) Serum-starved FG-M cells were allowed to migrate on vitronectin- or collagen-coated Transwell membranes after being transiently transfected with either the empty expression vector or the vector containing CAS-SD along with the β-galactosidase reporter construct as described in the Materials and Methods. Migration was enumerated as described in A above. The results shown are representative of at least three independent experiments.
Figure 4
Figure 4
Expression of CAS in cells is sufficient to induce cell migration. (A, top) Serum-starved COS cells were allowed to migrate for 3 h on vitronectin-coated membranes after transient transfection with either the empty expression vector or the expression vector containing gst-tagged wild-type CAS (gstCAS-WT) or gst-tagged CAS lacking a substrate domain (i.e., aa 213–514 and tyr-377 to tyr-414; gstCAS-SD). The number of transfected cells migrating were enumerated by counting cells on the underside of the membrane that coexpressed a β-galactosidase vector as described in Materials and Methods. Each bar represents the mean ± SD of triplicate migration wells of one of three representative experiments. Identical results were obtained with cells transfected with wild-type CAS or CAS-SD without the gst tag (data not shown). (A, middle) Phosphotyrosine immunoblot of gstCAS-WT and gstCAS-SD immunoprecipitated from COS cells treated as for the migration assay above and attached to the culture dish. (A, bottom) The blot was reprobed with anti-gst antibodies to confirm equal loading of gstCAS-WT and gstCAS-SD. (B) Serum-starved FG-M cells were allowed to migrate on vitronectin- or collagen-coated Transwell membranes after being transiently transfected with either the empty expression vector or the vector containing CAS-SD along with the β-galactosidase reporter construct as described in the Materials and Methods. Migration was enumerated as described in A above. The results shown are representative of at least three independent experiments.
Figure 5
Figure 5
CAS and Crk promote cell migration. (A) Serum-starved COS cells were allowed to migrate for 3 h on vitronectin-coated membranes (top) or lysed on the culture dish and analyzed for expression of CAS (middle) and Crk (bottom) by immunoblotting after transfection with either the empty expression vector or the expression vector containing wild-type Crk (Crk-WT) and/or gstCAS-WT or gstCAS-SD. The number of transfected migratory cells that coexpressed β-galactosidase were enumerated by counting cells on the underside of the membrane as described in Materials and Methods. Each bar represents the mean ± SD of triplicate migration wells of one of three representative experiments. (B) Crk immunoprecipitated from detergent lysates prepared from COS cells transfected as for the migration assay above were analyzed by blotting with anti-gst (top) or anti-Crk antibodies (bottom). (C) gstCAS-WT or gstCAS-SD immunoprecipitated from detergent lysates prepared from COS cells treated as described in B was analyzed by immunoblotting with anti-gst (top) or anti-Crk antibodies (bottom). (D) Crk immunoprecipitated from detergent lysates prepared from FG or FG-M cells either held in suspension (S) or allowed to attach (A) to vitronectin for 15 min were analyzed by immunoblotting with anti-CAS (top) or anti-Crk antibodies (bottom). The results shown are representative of at least three independent experiments.
Figure 5
Figure 5
CAS and Crk promote cell migration. (A) Serum-starved COS cells were allowed to migrate for 3 h on vitronectin-coated membranes (top) or lysed on the culture dish and analyzed for expression of CAS (middle) and Crk (bottom) by immunoblotting after transfection with either the empty expression vector or the expression vector containing wild-type Crk (Crk-WT) and/or gstCAS-WT or gstCAS-SD. The number of transfected migratory cells that coexpressed β-galactosidase were enumerated by counting cells on the underside of the membrane as described in Materials and Methods. Each bar represents the mean ± SD of triplicate migration wells of one of three representative experiments. (B) Crk immunoprecipitated from detergent lysates prepared from COS cells transfected as for the migration assay above were analyzed by blotting with anti-gst (top) or anti-Crk antibodies (bottom). (C) gstCAS-WT or gstCAS-SD immunoprecipitated from detergent lysates prepared from COS cells treated as described in B was analyzed by immunoblotting with anti-gst (top) or anti-Crk antibodies (bottom). (D) Crk immunoprecipitated from detergent lysates prepared from FG or FG-M cells either held in suspension (S) or allowed to attach (A) to vitronectin for 15 min were analyzed by immunoblotting with anti-CAS (top) or anti-Crk antibodies (bottom). The results shown are representative of at least three independent experiments.
Figure 6
Figure 6
Crk binding to CAS is required for cell migration. (A) Serum- starved COS cells were allowed to migrate for 3 h on vitronectin-coated membranes (top) or lysed on the culture dish and analyzed for expression of Crk and CAS by immunoblotting (middle and bottom) after transfection with either empty expression vector or the expression vector containing gstCAS-WT and either Crk-WT or CRK with a mutated SH2 domain (Crk-SH2). The number of transfected cells migrating were enumerated by counting β-galactosidase– positive cells on the underside of the membrane. Each bar represents the mean ± SD of triplicate migration wells of one of three representative experiments. (B) Crk immunoprecipitated from detergent lysates prepared from COS cells transfected as described for the migration experiment in A and analyzed by immunoblotting with anti-gst (top) or anti-Crk antibodies (bottom). The results shown are representative of at least three independent experiments.
Figure 6
Figure 6
Crk binding to CAS is required for cell migration. (A) Serum- starved COS cells were allowed to migrate for 3 h on vitronectin-coated membranes (top) or lysed on the culture dish and analyzed for expression of Crk and CAS by immunoblotting (middle and bottom) after transfection with either empty expression vector or the expression vector containing gstCAS-WT and either Crk-WT or CRK with a mutated SH2 domain (Crk-SH2). The number of transfected cells migrating were enumerated by counting β-galactosidase– positive cells on the underside of the membrane. Each bar represents the mean ± SD of triplicate migration wells of one of three representative experiments. (B) Crk immunoprecipitated from detergent lysates prepared from COS cells transfected as described for the migration experiment in A and analyzed by immunoblotting with anti-gst (top) or anti-Crk antibodies (bottom). The results shown are representative of at least three independent experiments.
Figure 7
Figure 7
The NH2-terminal SH3 domain of Crk is required for CAS/Crk-induced cell migration. (Top) Serum-starved COS cells were allowed to migrate for 3 h on vitronectin-coated membranes after transfection with either empty expression vector or the expression vector containing gstCAS-WT and either Crk-WT or CRK with a mutation in the NH2-terminal SH3 domain (c-Crk-SH3(mut)). The number of transfected cells migrating were enumerated by counting β-galactosidase–positive cells on the underside of the membrane. Each bar represents the mean ± SD of triplicate migration wells of one of three representative experiments. (Bottom) Crk-WT or Crk-SH3N immunoprecipitated from detergent extracts from COS cells transfected as described for the migration experiment above and immunoblotted for gstCAS or Crk. The results shown are representative of at least three independent experiments.
Figure 8
Figure 8
Requirement of CAS for cytokine-induced cell migration. Serum-starved COS cells were allowed to migrate for 3 h on vitronectin-coated membranes in the presence or absence of insulin after transfection with either empty expression vector or the vector containing gstCAS-WT or gstCAS-SD as described in Materials and Methods. The number of transfected cells migrating were enumerated by counting β-galactosidase–positive cells on the underside of the membrane. Each bar represents the mean ± SD of triplicate wells. Similar results were obtained after stimulation with IGF-1 and EGF (not shown).
Figure 9
Figure 9
Localization of CAS and Crk to membrane ruffles in migratory cells. (A) Serum-starved COS cells were allowed to attach to vitronectin-coated glass coverslips after transfection with the expression vector containing either wild-type Crk or CAS and examined by confocal immunofluorescent imaging as described in Materials and Methods. Rhodamine-conjugated phalloidin was used to visualize F-actin (red), whereas FITC-conjugated secondary antibody was used to visualize primary antibodies directed to Crk or CAS (green). Yellow staining represents the colocalization of red and green staining in the merged image. Control cells in which the primary antibody was omitted showed no immunofluorescent staining (data not shown). Photomicrographs were taken with a Bio-Rad Labs 1024 laser and Zeiss Axiovert microscope focused at the cell–substratum interface (630×). The arrowheads indicate colocalization of Crk or CAS with F-actin and represent membrane ruffling of cells showing motile phenotype. (B) Serum-starved COS cells attached to vitronectin-coated coverslips in the presence (15 min) or absence of insulin were analyzed by immunofluorescent confocal imaging for intracellular localization of endogenous Crk with F-actin as described above. Photomicrographs were taken at the cell–substratum interface (630×). The arrowhead indicates colocalization of Crk with F-actin containing membrane ruffles in cells stimulated to migrate with insulin. (C) Confocal immunofluorescent imaging of endogenous CAS in COS cells treated as described in B above. Photomicrographs were taken at the cell–substratum interface (630×). The arrowheads indicate colocalization of CAS with F-actin containing membrane ruffles in cells stimulated to migrate with insulin. Bars, 10 μm.
Figure 9
Figure 9
Localization of CAS and Crk to membrane ruffles in migratory cells. (A) Serum-starved COS cells were allowed to attach to vitronectin-coated glass coverslips after transfection with the expression vector containing either wild-type Crk or CAS and examined by confocal immunofluorescent imaging as described in Materials and Methods. Rhodamine-conjugated phalloidin was used to visualize F-actin (red), whereas FITC-conjugated secondary antibody was used to visualize primary antibodies directed to Crk or CAS (green). Yellow staining represents the colocalization of red and green staining in the merged image. Control cells in which the primary antibody was omitted showed no immunofluorescent staining (data not shown). Photomicrographs were taken with a Bio-Rad Labs 1024 laser and Zeiss Axiovert microscope focused at the cell–substratum interface (630×). The arrowheads indicate colocalization of Crk or CAS with F-actin and represent membrane ruffling of cells showing motile phenotype. (B) Serum-starved COS cells attached to vitronectin-coated coverslips in the presence (15 min) or absence of insulin were analyzed by immunofluorescent confocal imaging for intracellular localization of endogenous Crk with F-actin as described above. Photomicrographs were taken at the cell–substratum interface (630×). The arrowhead indicates colocalization of Crk with F-actin containing membrane ruffles in cells stimulated to migrate with insulin. (C) Confocal immunofluorescent imaging of endogenous CAS in COS cells treated as described in B above. Photomicrographs were taken at the cell–substratum interface (630×). The arrowheads indicate colocalization of CAS with F-actin containing membrane ruffles in cells stimulated to migrate with insulin. Bars, 10 μm.
Figure 10
Figure 10
Requirement of Rac, but not Ras, for CAS/Crk-mediated cell migration. (Top) Serum-starved COS cells were allowed to migrate for 3 h on vitronectin-coated membranes after transfection with either the empty expression vector or the expression vector containing gstCAS-WT and Crk-WT along with dominant-negative Rac (−) or dominant-negative Ras (−) . The number of transfected cells migrating were enumerated by counting cells on the underside of the membrane as described above. Each bar represents the mean ± SD of triplicate migration wells of one of three representative experiments. (Bottom) An aliquot of those cells used for the migration assay above were lysed in detergent and analyzed for myc-tagged Rac or Ras expression as described in Materials and Methods.

Similar articles

Cited by

References

    1. Bar-Sagi D, Rotin D, Batzer A, Mandiyan V, Schlessinger J. SH3 domains direct cellular localization of signaling molecules. Cell. 1993;74:83–91. - PubMed
    1. Birge B, Fajardo J, Mayer B, Hanafusa H. Tyrosine-phosphorylated epidermal growth factor receptor and cellular p130 provide high affinity binding substrates to analyze Crk-phosphotyrosine-dependent interactions in vitro. J Biol Chem. 1992;267:10588–10595. - PubMed
    1. Brooks PC, Klemke RL, Schön S, Lewis JM, Schwartz MA, Cheresh DA. Insulin-like growth factor receptor cooperates with integrin αvβ5 to promote tumor cell dissemination in vivo. J Clin Invest. 1997;99:1390–1398. - PMC - PubMed
    1. Cary LA, Chang JF, Guan J. Stimulation of cell migration by overexpression of focal adhesion kinase and its association with Src and Fyn. J Cell Sci. 1996;109:1787–1794. - PubMed
    1. Chen P, Xie H, Sekar M, Gupta K, Wells A. Epidermal growth factor receptor–mediated cell motility: phospholipase C activity is required but mitogen-activated protein kinase is not sufficient for induced cell movement. J Cell Biol. 1994;127:847–857. - PMC - PubMed

Publication types

MeSH terms