. 1997 Nov 17;139(4):1047-59.
doi: 10.1083/jcb.139.4.1047.

Regulation of cell-cell adhesion by rac and rho small G proteins in MDCK cells

Affiliations

Regulation of cell-cell adhesion by rac and rho small G proteins in MDCK cells

K Takaishi et al. J Cell Biol. .

Abstract

The Rho small G protein family, consisting of the Rho, Rac, and Cdc42 subfamilies, regulates various cell functions, such as cell shape change, cell motility, and cytokinesis, through reorganization of the actin cytoskeleton. We show here that the Rac and Rho subfamilies furthermore regulate cell-cell adhesion. We prepared MDCK cell lines stably expressing each of dominant active mutants of RhoA (sMDCK-RhoDA), Rac1 (sMDCK-RacDA), and Cdc42 (sMDCK-Cdc42DA) and dominant negative mutants of Rac1 (sMDCK-RacDN) and Cdc42 (sMDCK-Cdc42DN) and analyzed cell adhesion in these cell lines. The actin filaments at the cell-cell adhesion sites markedly increased in sMDCK-RacDA cells, whereas they apparently decreased in sMDCK-RacDN cells, compared with those in wild-type MDCK cells. Both E-cadherin and beta-catenin, adherens junctional proteins, at the cell-cell adhesion sites also increased in sMDCK-RacDA cells, whereas both of them decreased in sMDCK-RacDN cells. The detergent solubility assay indicated that the amount of detergent-insoluble E-cadherin increased in sMDCK-RacDA cells, whereas it slightly decreased in sMDCK-RacDN cells, compared with that in wild-type MDCK cells. In sMDCK-RhoDA, -Cdc42DA, and -Cdc42DN cells, neither of these proteins at the cell-cell adhesion sites was apparently affected. ZO-1, a tight junctional protein, was not apparently affected in any of the transformant cell lines. Electron microscopic analysis revealed that sMDCK-RacDA cells tightly made contact with each other throughout the lateral membranes, whereas wild-type MDCK and sMDCK-RacDN cells tightly and linearly made contact at the apical area of the lateral membranes. These results suggest that the Rac subfamily regulates the formation of the cadherin-based cell- cell adhesion. Microinjection of C3 into wild-type MDCK cells inhibited the formation of both the cadherin-based cell-cell adhesion and the tight junction, but microinjection of C3 into sMDCK-RacDA cells showed little effect on the localization of the actin filaments and E-cadherin at the cell-cell adhesion sites. These results suggest that the Rho subfamily is necessary for the formation of both the cadherin-based cell- cell adhesion and the tight junction, but not essential for the Rac subfamily-regulated, cadherin-based cell- cell adhesion.


Figures

Figure 1
Figure 1
Expression of various Rho, Rac, and Cdc42 mutants in stable transformants of MDCK cell lines. Subconfluent MDCK cells were lysed and protein samples were directly subjected to SDS-PAGE (13% polyacrylamide). The separated proteins were processed for immunoblotting with the 9E10 anti-myc mAb (a). Subconfluent MDCK cells were lysed, and protein samples were immunoprecipitated with the 9E10 anti-myc mAb crosslinked to protein A-Sepharose 4B. The immunoprecipitates were subjected to SDS-PAGE (13% polyacrylamide) and the separated proteins were processed for immunoblotting with the 9E10 mAb (b). lane 1, Wild-type MDCK cell line; lane 2, sMDCK-RhoDA-5 cell line expressing myc-V14RhoA; lane 3, sMDCK-RacDA-1 cell line expressing myc-V12Rac1; lane 4, sMDCK-RacDN-2 cell line expressing myc-N17Rac1; lane 5, sMDCK-Cdc42DA-2 cell line expressing myc-V12Cdc42; lane 6, sMDCK-Cdc42DN-6 cell line expressing myc-N17Cdc42. Arrows indicate myc-tagged proteins. The mobility of myc-V14RhoA was slightly slower than that of myc-V12Rac1, -N17Rac1, -V12Cdc42, and -N17Cdc42. An arrowhead indicates the light chain of the 9E10 anti-myc mAb, which was detected because a part of the light chain of the 9E10 anti-myc mAb crosslinking to protein A-sepharose 4B was detached from the beads by boiling in SDS-sample buffer. The prestained protein markers used were soybean trypsin inhibitor (molecular weight, 28,300) and lysozyme (molecular weight, 19,800).
Figure 2
Figure 2
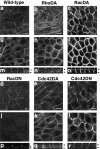
Localization of the actin cytoskeleton and cell shape in MDCK cells stably expressing various Rho, Rac, and Cdc42 mutants. Wild-type MDCK cells (a, g, and m), sMDCK-RhoDA-5 cells (b, h, and n), sMDCK-RacDA-1 cells (c, i, and o), sMDCK-RacDN-2 cells (d, j, and p), sMDCK-Cdc42DA-2 cells (e, k, and q), and sMDCK-Cdc42DN-6 cells (f, l, and r) were stained with rhodamine-phalloidin and analyzed by confocal microscopy. (a– f) Basal levels; (g–l) apical, junctional levels; (m–r) vertical sections. White arrowheads indicate the cell–cell adhesion sites. Black arrowheads and arrows indicate the apical and basal levels of the cells, respectively. Note that the scale in RacDN panels (d, j, and p) is different from those in the other panels. The results shown are representative of three independent experiments. Bars, 10 μm.
Figure 3
Figure 3
Localization of E-cadherin and β-catenin in sMDCK-RhoDA-5, -RacDA-1, and -RacDN-2 cells. Wild-type MDCK cells (a, e, i, and m), sMDCK-RhoDA-5 cells (b, f, j, and n), sMDCK-RacDA-1 cells (c, g, k, and o), and sMDCK-RacDN-2 cells (d, h, l, and p) were stained with the ECCD-2 anti–E-cadherin mAb (a–h) or the 5H10 anti–β-catenin mAb (i–p) and analyzed by confocal microscopy. (a–d and i–l) Junctional levels; (e–h and m–p) vertical sections. White arrowheads indicate the cell–cell adhesion sites. Black arrowheads and arrows indicate the apical and basal levels of the cells, respectively. Note that the scales in RacDN panels (d, h, l, and p) are different from those in the other panels. The results shown are representative of three independent experiments. Bars, 10 μm.
Figure 4
Figure 4
Detergent solubility of E-cadherin from wild-type MDCK, sMDCK-RacDA-1, and -RacDN-2 cells. Wild-type MDCK (a), sMDCK-RacDA-1 (b), and sMDCK-RacDN-2 cells (c) were incubated with various concentrations of NP-40, and the amounts of E-cadherin in the detergent-soluble (S) and -insoluble (I) fractions were measured by immunoblotting with the C20820 anti–E-cadherin mAb. d shows the amount of the insoluble E-cadherin as a percentage of the amount of total E-cadherin, i.e., S plus I, by estimation using densitometer.
Figure 4
Figure 4
Detergent solubility of E-cadherin from wild-type MDCK, sMDCK-RacDA-1, and -RacDN-2 cells. Wild-type MDCK (a), sMDCK-RacDA-1 (b), and sMDCK-RacDN-2 cells (c) were incubated with various concentrations of NP-40, and the amounts of E-cadherin in the detergent-soluble (S) and -insoluble (I) fractions were measured by immunoblotting with the C20820 anti–E-cadherin mAb. d shows the amount of the insoluble E-cadherin as a percentage of the amount of total E-cadherin, i.e., S plus I, by estimation using densitometer.
Figure 5
Figure 5
Expression levels of E-cadherin and β-catenin in sMDCK-RhoDA-5, -RacDA-1, and -RacDN-2 cells. Sub-confluent MDCK cells were lysed, and protein samples were directly subjected to SDS-PAGE (10% polyacrylamide). The separated proteins were processed for immunoblotting with the C20820 anti–E-cadherin mAb (a) and the 5H10 anti–β-catenin mAb (b). Lane 1, wild-type MDCK cells; lane 2, sMDCK-RhoDA-5 cells; lane 3, sMDCK-RacDA-1 cells; lane 4, sMDCK-RacDN-2 cells. The prestained protein markers used were myosin (molecular weight, 201,000), β-galactosidase (molecular weight, 117,000), and bovine serum albumin (molecular weight, 82,000).
Figure 6
Figure 6
Localization of ZO-1 in sMDCK-RhoDA-5, -RacDA-1, and RacDN-2 cells. Wild-type MDCK cells (a), sMDCK-RhoDA-5 cells (b), sMDCK-RacDA-1 cells (c), and sMDCK-RacDN-2 cells (d) were stained with the anti–ZO-1 mAb and analyzed by confocal microscopy. Confocal images are shown at the junctional levels. Note that the scale in RacDN panels (d) is different from those in the other panels. The results shown are representative of three independent experiments. Bars, 10 μm.
Figure 7
Figure 7
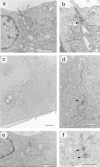
Electron microscopic analysis on the morphology of the cell–cell adhesion sites in wild-type MDCK, sMDCK-RacDA-1, and -RacDN-2 cells. Wild-type MDCK cells (a and b), sMDCK-RacDA-1 cells (c and d), and sMDCK-RacDN-2 cells (e and f) were fixed and processed for electron microscopy. b, d, and f show the cell–cell adhesion sites at higher magnifications of a, c, and e, respectively. Arrowheads indicate desmosomes. The results shown are representative of three independent experiments. Bars: (a, c, and e) 1 μm; (b, d, and f) 0.5 μm.
Figure 8
Figure 8
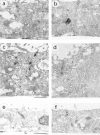
Immunoelectron microscopy analysis of the localization of E-cadherin and β-catenin at the cell–cell adhesion sites by immunoelectron microscopy in wild-type MDCK, sMDCK-RacDA-1, and -RacDN-2 cells. Wild-type MDCK cells (a and b), sMDCK-RacDA-1 cells (c and d), and sMDCK-RacDN-2 cells (e and f) were fixed and processed for immunoelectron microscopy using the ECCD-2 anti–E-cadherin mAb (a, c, and e) or the 5H10 anti–β-catenin mAb (b, d, and f). The results shown are representative of three independent experiments. Bars, 1 μm.
Figure 9
Figure 9
Disruption of the cell–cell adhesion in wild-type MDCK cells by microinjection of C3. Wild-type MDCK cells were fixed at 1 h after the microinjection with 40 μg/ml of C3 plus 5 mg/ml of rabbit IgG and stained with rhodamine-phalloidin (a), the ECCD-2 anti–E-cadherin mAb (b), or the anti–ZO-1 mAb (c), and analyzed by confocal microscopy. The microinjected cells are shown by the staining of microinjected rabbit IgG (d–f). Confocal images are shown at the junctional levels. The localization of the actin filaments, E-cadherin, and ZO-1 at the cell–cell adhesion sites was inhibited between the microinjected cells (arrowheads), whereas it was not inhibited between the microinjected and unmicroinjected cells (arrows). The results shown are representative of three independent experiments. Bars, 10 μm.
Figure 10
Figure 10
Inhibition of the formation of the cell–cell adhesion in wild-type MDCK cells by microinjection of C3. Wild-type MDCK cells cultured in normal Ca2+ DME were microinjected with 40 μg/ml of C3 plus 5 mg/ml of rabbit IgG. At 30 min after the microinjection the cells were transferred to low Ca2+ DME and further incubated for 2 h. The cells were then transferred to normal Ca2+ DME for 2 h (a, b, d, and e) or stimulated with 1 × 10⁻⁷ M TPA for 1 h (c and f). The cells were stained with the ECCD-2 anti–E-cadherin mAb (a) or the anti–ZO-1 mAb (b and c) and analyzed by confocal microscopy. The microinjected cells are shown by the staining of microinjected rabbit IgG (d–f). Confocal images are shown at the junctional levels. The localization of E-cadherin and ZO-1 at the cell–cell adhesion sites was inhibited between the microinjected cells (arrowheads), whereas it was not inhibited between the microinjected and unmicroinjected cells (arrows). The results shown are representative of three independent experiments. Bars, 10 μm.
Figure 11
Figure 11
Inability of microinjection of C3 to disrupt the cell– cell adhesion in sMDCK-RacDA-1 cells. (a–c); sMDCK-RacDA-1 cells were fixed at 2 h after the microinjection with 40 μg/ml of C3 plus 5 mg/ml of rabbit IgG and stained with rhodamine-phalloidin (a and b) and analyzed by confocal microscopy. The microinjected cells are shown by the staining of microinjected rabbit IgG (c). (a) Basal level; (b and c) junctional levels. Stress fibers completely disappeared in the microinjected cells (stars), whereas the unmicroinjected cells possessed weak stress fibers (arrow). (d–f) sMDCK-RacDA-1 cells were fixed at 2 h after the microinjection with 40 μg/ml of C3 plus 5 mg/ml of rabbit IgG and stained with rhodamine-phalloidin (d) or the ECCD-2 anti–E-cadherin mAb (e) and analyzed by confocal microscopy. The microinjected cells are shown by the staining of microinjected rabbit IgG (f). Confocal images are shown at the junctional levels. The results shown are representative of three independent experiments. Bars, 10 μm.
Figure 12
Figure 12
Localization of myc-tagged proteins in sMDCK-RhoDA-5, -RacDA-1, and -RacDN-2 cells. Wild-type MDCK cells (a and e), sMDCK-RhoDA-5 cells expressing myc-V14RhoA (b and f), sMDCK-RacDA-1 cells expressing myc-V12Rac1 (c and g), and sMDCK-RacDN-2 cells expressing myc-N17Rac1 (d and h) were double stained with rhodamine-phalloidin (a–d) and the 9E10 anti-myc mAb (e–h) and analyzed by confocal microscopy. Confocal images are shown at the junctional levels. The results shown are representative of three independent experiments. Bars, 10 μm.

Similar articles

Cited by

References

    1. Abo A, Pick E, Hall A, Totty N, Teahan CG, Segal AW. Activation of the NADPH oxidase involves the small GTP-binding protein p21rac1 . Nature. 1991;353:668–670. - PubMed
    1. Aktories K, Rösener S, Blaschke U, Chhatwal GS. Botulinum ADP-ribosyltransferase C3: purification of the enzyme and characterization of the ADP-ribosylation reaction in platelet membranes. Eur J Biochem. 1988;172:445–450. - PubMed
    1. Ando S, Kaibuchi K, Sasaki T, Hiraoka K, Nishiyama T, Mizuno T, Asada M, Nunoi H, Matsuda I, Matsuura Y, et al. Post-translational processing of racp21s is important both for their interaction with the GDP/GTP exchange proteins and for their activation of NADPH oxidase. J Biol Chem. 1992;267:25709–25713. - PubMed
    1. Balda MS, Gonzalez-Mariscal L, Matter K, Cereijido M, Anderson JM. Assembly of the tight junction: the role of diacylglycerol. J Cell Biol. 1993;123:293–302. - PMC - PubMed
    1. Behrens J, Vakaet L, Friis R, Winterhager E, van Roy F, Mareel MM, Birchmeier W. Loss of epithelial differentiation and gain of invasiveness correlate with tyrosine phosphorylation of the E-cadherin/β-catenin complex in cells transformed with a temperature-sensitive v-src gene. J Cell Biol. 1993;120:757–766. - PMC - PubMed

Publication types

MeSH terms