. 2024 May;4(5):727-744.
doi: 10.1038/s43587-024-00613-3. Epub 2024 Apr 15.

Human skeletal muscle aging atlas

Affiliations

Human skeletal muscle aging atlas

Veronika R Kedlian et al. Nat Aging. 2024 May.

Abstract

Skeletal muscle aging is a key contributor to age-related frailty and sarcopenia with substantial implications for global health. Here we profiled 90,902 single cells and 92,259 single nuclei from 17 donors to map the aging process in the adult human intercostal muscle, identifying cellular changes in each muscle compartment. We found that distinct subsets of muscle stem cells exhibit decreased ribosome biogenesis genes and increased CCL2 expression, causing different aging phenotypes. Our atlas also highlights an expansion of nuclei associated with the neuromuscular junction, which may reflect re-innervation, and outlines how the loss of fast-twitch myofibers is mitigated through regeneration and upregulation of fast-type markers in slow-twitch myofibers with age. Furthermore, we document the function of aging muscle microenvironment in immune cell attraction. Overall, we present a comprehensive human skeletal muscle aging resource ( https://www.muscleageingcellatlas.org/ ) together with an in-house mouse muscle atlas to study common features of muscle aging across species.


Conflict of interest statement

In the past 3 years, S.A.T. has consulted for or been a member of scientific advisory boards at Qiagen, Sanofi, GlaxoSmithKline and ForeSite Labs. She is a co-founder and an equity holder of TransitionBio and EnsoCell and a SAB member of Element Biosciences. She is a part-time employee at GlaxoSmithKline. The remaining authors declare no competing interests.

Figures
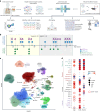
Fig. 1
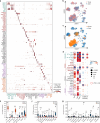
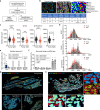
Fig. 1. Single-cell and single-nucleus skeletal muscle aging atlas.
a, Visual overview of experimental design and main directions of investigations. Illustration was created with BioRender.com. b, Timescale displaying human muscle sampling across ages for scRNA-seq/snRNA-seq (eight young versus nine aged) and for myofiber subtyping (seven young versus four aged). c, Uniform manifold approximation and projection (UMAP) visualization of annotated cells in the Muscle Aging Cell Atlas. Cell type annotation and abbreviations for all populations are shown in Supplementary Table 10. d, log2-transformed fold change (FC) in the abundance of cell clusters across age (first column) and enrichment in cells compared to nuclei fraction (second and third columns), taking into account 10x chemistry (see full version in Extended Data Fig. 1d). Some populations (hybrid, specialized myonuclei, MF-Isn fragments, MF-IIsn fragments, neutrophils, mesothelium, red blood cells (RBC), eosinophils and plasmacytoid dendritic cells (pDC)) were removed from the plot because they represented a mixture of different cell types, contained a very small number of cells or predominantly originated from particular donors. The LTSR denotes statistical significance and ranges from 0 to 1, where 1 indicates a confident estimate. See Methods for more details. ArtEC, arterial endothelial cells; CapEC, capillary endothelial cells; cDC1 and cDC2, conventional type 1 and 2 dendritic cells; mSchwann and nmSchwann, myelinating and non-myelinating Schwann cells. Source data
Fig. 2
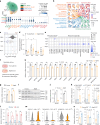
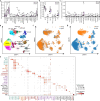
Fig. 2. Mechanistic insights into human MuSC aging.
a, UMAP visualization of MuSC subpopulations identified from scRNA-seq. b, Tree visualization of the GO terms enriched among marker genes for every MuSC subpopulation. Top 10 clusters of GO terms defined based on semantic similarity are shown. c, Beeswarm Milo plot showing the distribution of log2(FC) in cell abundance with age across neighborhoods of MuSC subtypes; significantly differentially abundant neighborhoods are colored. d, Ribosome biogenesis enrichment score of MuSC subpopulations in young (five donors) versus aged (seven donors) individuals. P value: two-tailed Mann–Whitney–Wilcoxon test. *P < 0.05. e, Dot plot of ribosome biogenesis and RNA polymerase I complex genes in MuSC subpopulations. Dot size represents the proportion of cells expressing the gene in aged group, color represents log2(FC) in young versus aged. Significantly upregulated and downregulated genes were defined using the direction of log2 (FC), the proportion of cells > 0.05 and LTSR > 0.9 (significance value, ranging from 0 to 1, where 1 is confident estimate). See Source Data. fj, Expression of senescence-associated (g) and ribosome assembly (h) genes in cultured human primary myoblasts (f) by both qPCR (three biological repeats per group) (g,h) and western blot (i,j). Three independent experiments were performed for western blot with similar results. P value: unpaired two-tailed t-test. *P < 0.05; **P < 0.01; ***P < 0.001. Illustration in f was created with BioRender.com. k,l, qPCR (three donors for both panels) of genes in FACS-sorted MuSC subpopulations. P value in k: one-way ANOVA test; P value in l: unpaired two-tailed t-test. *P < 0.05; **P < 0.01. m, Violin plots of CCL2, TNFAIP3 and NFKBIZ in ICA+ MuSCs from scRNA-seq data. P value: unpaired two-tailed t-test. n, qPCR of CHUK, NFKBIZ and CCL2 in FACS-sorted ICA+ MuSCs (three young versus three or four aged donors). P value: unpaired two-tailed t-test. *P < 0.05. All data presented in d, g, h, jl and n are mean ± s.e.m. with individual data points shown. The exact P values are shown in the Source Data. Source data
Fig. 3
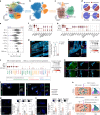
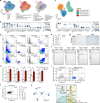
Fig. 3. Integrated single-cell and single-nucleus MF atlas.
ac, UMAP visualization of MF populations obtained from integrated (b) or separate snRNA-seq (a) and scRNA-seq (c). Hyb, hybrid; fg, fragments. d, Pie charts illustrating the average ratio of spliced and unspliced transcripts in MF nuclei and cells (from a and c) in comparison to non-MF ones. e, Beeswarm Milo plot showing the distribution of log2(FC) in cell abundance with age across neighborhoods of myonuclei populations. Significantly differentially abundant neighborhoods are colored (donor 343B was omitted from analysis due to abnormally high proportion of II-OTU state (interquartile range (IQR) outlier)). fi, Marker gene profiles of paired FAM189A2+ (f) and OTUD1+ (h) states. RNAscope staining of their marker genes on FFPE sections of intercostal muscle (g, three young versus three aged donors; i, three young versus two aged donors). I-FAM nuclei were also manually quantified (g, right). P value: unpaired two-tailed t-test. Scale bar, 50 µm. j, Dot plot of NMJ and NMJ accessory (acc.) marker genes. k, RNAscope staining of NMJ accessory (in yellow circle) on intercostal muscle FFPE sections (two young versus three aged donors). Scale bar, 10 µm. l, Immunofluorescence staining of α-bungarotoxin (α-BTX) and SORBS2 on teased human intercostal muscles (one young versus two aged donors). Scale bar, 10 µm. m,n, Immunofluorescence of AChRs on cultured human myotubes after siRNA knockdown of EFNA5 (m, left, 13 si-EFNA5 versus eight Scramble control fields) and overexpression of EFNA5 (n, left, eight OE-EFNA5 versus 11 control fields). AChRs on different stages of cluster formation (dotted to plaque to branched) were quantified by Fiji. P value: unpaired two-tailed t-test. Scale bar, 50 µm. Both experiments in m and n were performed twice with similar results. o, Schematic diagram showing NMJ accessory-mediated pro-survival mechanism against NMJ aging. All data presented in bar plots (g,m,n) are mean ± s.e.m. with individual data points shown. *P < 0.05; **P < 0.01; ***P < 0.001. The exact P values are shown in the Source Data. Source data
Fig. 4
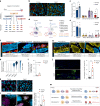
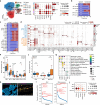
Fig. 4. Mechanisms countering fast-twitch MF loss in aging.
a, Schematic diagram of the current understanding concerning the general categories of muscle fibers and their respective nuclei. Illustration was created with BioRender.com. b,c, Immunfluorescence staining (b) and proportional changes (c) of different MF types in human intercostal muscles (seven young versus four aged donors). Scale bar, 100 µm. P value: unpaired two-tailed t-test. d,e, Three-dimensional scatter plots of myonuclei types based on expression of MYH1 (x axis), MYH2 (y axis) and MYH7 (z axis) from snRNA-seq (Methods; unclassified population is not displayed, d) and their proportional changes (e) in aging (five young versus five aged donors). Three donors (502B, 582C and 583B) with a high proportion (>75%) of unclassified populations were discarded. P value: unpaired two-tailed t-test. f,g, Joint RNAscope (MYH1 and MYH2) with immunofluorescence (MYH7) highlights upregulation of fast-type mRNA (especially MYH1) within the nucleus (middle) and cytoplasm (right) of slow-twitch (f) and fast-twitch (g) MYH2+ MFs with age. Scale bar, 20 µm. h, Violin plot showing specific expression of fast-twitch MF structural genes in MYH8+ myocytes. i, Bar plot showing proportion of MYH8+ myocytes, relative to the total MF cells in scRNA-seq (five young versus seven aged donors). P value: unpaired two-tailed t-test. j, Immunofluorescence (left) and area quantification (right) of MYH8 on teased human intercostal muscles (six young versus six aged donors). P value: unpaired two-tailed t-test. **P < 0.01. Scale bar, 100 µm. k,l, Co-immunofluorescence of MYH7, MYH2 and MYH8 on skeletal muscle cross-sections with lower (k) and higher (l) magnification. Bar plots illustrate proportion of MYH2+ MFs with centralized nuclei relative to all MYH2+ MFs (five young versus four aged donors). Arrows point to MYH8+ MFs. Scale bar in k, 50 µm. Scale bar in l, 10 µm. P value: unpaired two-tailed t-test. *P < 0.05. m, Diagram illustrating different putative mechanisms of MF aging. All data in c,e,i,j and l are mean ± s.e.m. with individual data points shown. The exact P values are shown in the Source Data. Source data
Fig. 5
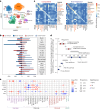
Fig. 5. The human skeletal muscle microenvironment in aging.
ac, Beeswarm Milo plots showing the distribution of log2-transformed fold change in cell abundance with age across neighborhoods of cells in the microenvironment. AdvFB, adventitial fibroblasts; EnFB, endoneurial fibroblasts; PnFB, perineural fibroblasts.d, Co-immunofluorescence of CD3 and laminin on fresh-frozen sections. Bar plot showing number of CD3+ cells per field (four young versus six aged donors). Scale bar, 10 µm. P: unpaired two-tailed t-test. *P < 0.05. e, Subset of four markers from a 15-plex RareCyte protein panel indicating proximity between CD4+ T cells and CD31+ vessels (two young versus two aged donors). Scale bar, 40 µm. f, Co-immunofluorescence of NKG7 and laminin on fresh-frozen sections. Bar plots show the number of NKG7+ cells per mm2 (three young versus four aged donors). Scale bar, 10 µm. P: unpaired two-tailed t-test. *P < 0.05. g,h, RNAscope (g) and bar plot (h) showing number of LYVE1 cells per field on FFPE sections (two young versus two aged donors). Scale bar, 50 µm. P: one-way ANOVA test. ***P < 0.001. i,j, Co-immunofluorescence of ACTA2 and laminin on fresh-frozen sections (i) and bar plot illustrating proportion of MFs with 0 (none), 1, 2, 3 or more ACTA2+ cells surrounding them (j) (three young versus three aged donors). Scale bar, 50 µm. P: unpaired two-tailed t-test. *P < 0.05. k, Dot plot illustrating aging changes of chemokine and interleukin genes. Significant genes were defined based on direction of change, proportion of cells >0.05 and LTSR (significance) > 0.9. l, Co-immunofluorescence of ACTA2 and CCL2 on FFPE sections. Bar plot shows percentage of CCL2+ACTA2+ cells (two young versus two aged donors). Scale bar, 50 µm. P value: one-way ANOVA test. ***P < 0.001. m, CellPhoneDB analysis of cell–cell interactions mediated via CCL2 produced by various cell types in the microenvironment. Emitter (ligand) cells: leftmost; receiver (receptor) cells: rightmost. FB, fibroblast. All data in d,f,h,j and l are mean ± s.e.m. with individual data points shown. See the Source Data for exact P values. Source data
Fig. 6
Fig. 6. Common skeletal muscle aging changes in human and mouse.
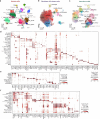
a, UMAP plot showing main cell populations in the integrated human and mouse skeletal muscle dataset of 346,296 cells, including our muscle aging atlas as well as six other publicly available resources. b, Bar plots showing the number of significantly upregulated and downregulated DEGs in mouse and human across different cell types. c, Heatmap showing consistency of the DEGs within the same cell type in human and mouse for upregulated (left) and downregulated (right) genes. Consistency was calculated using Jaccard similarity index. Immune cells showcase the highest similarity among cell type groups and are highlighted in red. d, Scatter plot illustrating the number of cell types that show simultaneous human and mouse age-related enrichment in the given KEGG pathway. Pathways are ordered according to the number of enriched cell types. Pathways enriched in cell-type-specific upregulated genes are shown in the top half (y > 0) versus ones showing enrichment in downregulated genes displayed in the bottom half (y < 0). e, Dot plot showing species-common and species-specific aging DEGs in human and mouse. Dot size represents proportion of cells in aged group, color represents log2(FC) in young versus aged. Significant genes were defined based on direction of change, proportion of cells >0.05 and LTSR (significance) > 0.9. Source data
Extended Data Fig. 1
Extended Data Fig. 1. Single-cell and single-nucleus skeletal muscle aging atlas.
a, Dot plot showing marker genes for major cell types in human skeletal muscle aging atlas. The size of the dot represents the proportion of cells expressing a gene. Colour denotes the scaled expression level. b, c, UMAP visualisation of human aging cell atlas coloured according to age (b) and batch: cells or nuclei (c). d, Full version of the plot in Fig. 1d, taking into account 10x chemistry (Methods). e-g, Box plots illustrating proportions of each cell type in every biological replicate (tissue piece) for scRNA-seq (Cells) vs. snRNA-seq (Nuclei) data (averaged across different technical replicates, 15 nuclei vs. 12 cells replicates). Samples containing less than 1000 cells were excluded. The box boundary extends from the 1st quantile (25 percentile) to the 3rd quantile (75 percentile), horizontal line represents median, ‘whiskers’ extend to points that lie within 1.5 IQRs of the lower and upper quartile, observations outside this range are considered ‘outliers’ and marked with a cross. Mann-Whitney-Wilcoxon two-sided test with Benjamini-Hochberg correction was used to quantify the change between cells and nuclei, *, p ≤ 0.05; **, p ≤ 0.01; ***, p ≤ 0.001, ****, p ≤ 1.00e-04, see Source Data for exact p values. Source data
Extended Data Fig. 2
Extended Data Fig. 2. Human cell type dynamics with age and a reference mouse skeletal muscle aging atlas.
ac, Box plots illustrating proportions of each cell type in every biological replicate (averaged across different technical replicates) in young (in violet) vs. aged (in pink) samples from scRNA-seq (5 young vs. 7 aged donors, a) or from snRNA-seq (7 young vs. 8 aged biological replicates from 6 young vs. 7 aged donors, b, c). Samples containing less than 1000 cells were excluded. The box boundary extends from the 1st quantile (25 percentile) to the 3rd quantile (75 percentile), horizontal line represents median, ‘whiskers’ extend to points that lie within 1.5 IQRs of the lower and upper quartile, observations outside this range are considered ‘outliers’ and marked with a cross. Mann-Whitney-Wilcoxon two-sided test with Benjamini-Hochberg correction was used to quantify the change between aged and young, *, p ≤ 0.05; see Source Data for exact p values. d-g, UMAP plot illustrating 96,529 cells/nuclei from mouse skeletal muscle across age with major cell types (d), age group (young vs. aged, f) and data type (scRNA-seq vs. snRNA-seq, g) shown. e, Dot plot of marker genes for each cell type in mouse skeletal muscle aging atlas. The size of the dot represents the proportion of cells expressing a gene. Colour denotes the scaled expression level. Source data
Extended Data Fig. 3
Extended Data Fig. 3. Mechanistic insights into human MuSC aging.
a-c, UMAP and marker plots of in-house human (a,b) and mouse MuSCs (b) integrated together with other publicly available resources (see Methods). The size of the dot represents the proportion of cells expressing a gene. Colour denotes the expression level. d, Gating strategy for FACS-based human MuSC sorting. e, Proportional changes of FACS-sorted human MuSC (4 young vs. 4 aged) in aging. p value: unpaired two-tailed t-test. **, p < 0.01. f, Complete membrane images corresponding to the blots shown in Fig. 2i. g, h β-Galactosidase (β-Gal) staining (g) and qPCR (h, 3 biological repeats per group) of SASP genes in cultured human primary myoblasts. Experiments in h were performed twice with similar results. Scale bar in g: 50 µm. p value: unpaired two-tailed t-test. *, p < 0.05; **, p < 0.01. i, FACS-based scatter plots (4 donors) of TNF+, ICA+ and Main MuSC. j, FACS-based scatter plots (4 young vs. 4 aged donors) of ICA+ MuSC and their proportion changes in aging. p value: unpaired two-tailed t-test. k, Set of transcription factors which were inferred to regulate CCL2 expression in MuSCs using pySCENIC algorithm. l, Schematic diagram illustrating change in positive (CHUK) and negative (TNFAIP3 and NFKBIZ) NF-kB regulators in ICA+ MuSC during aging and their putative influence on CCL2 expression. All data presented in bar plots (e, g, j) are expressed as mean ± s.e.m. with individual data points shown. The exact p values were shown in the Source Data. Source data
Extended Data Fig. 4
Extended Data Fig. 4. Integrated myonuclei and myocytes atlas and their ageing change.
a, UMAP visualisation of myofiber populations obtained from integrated sn- and scRNA-seq dataset, coloured according to the six main populations (left) and dot plot showing their marker genes (right). Dot size represents the proportion of cells expressing a gene, colour indicates scaled expression level. b,c, Bar plots illustrating the average ratio of spliced vs. unspliced transcripts in the main myofiber populations (b) and subpopulations (c). d, Dot plot showing marker genes for myofiber populations derived from sn- (blue) and scRNA-seq (orange) data. Dot size represents the proportion of cells expressing a gene, colour indicates scaled expression level, bar plots indicate absolute number of cells. e,f, Boxplots illustrating the proportion of each myonuclei type, relative to all nuclei, in aged (n = 7) vs. young (n = 6) donors. The box boundary extends from the 1st quantile (25 percentile) to the 3rd quantile (75 percentile), horizontal line represents median, ‘whiskers’ extend to points that lie within 1.5 IQRs of the lower and upper quartile, observations outside this range are considered ‘outliers’ and marked with a cross. Mann-Whitney-Wilcoxon two-sided test with Benjamini-Hochberg correction was used to quantify the change between aged and young. g, Dot plot showing gene sets enriched in different nuclei populations based on gProfiler over-representation analysis. Colour denotes F score, the size of the dot represents -log10 of adjusted (adj.) p value, significant values highlighted with a red edge. h, Joint immunofluorescence (IF) for MYH7 and RNAscope for TNFRSF12A and OTUD1 (left) as well as RNAscope for MYH2, TNFRSF12A and OTUD1 (right) highlighting I-OTU and II-OTU nuclei populations. i, pySCENIC regulon specificity scores for the NMJ and NMJ accessory population, ordered from highest to lowest (top 10 regulons are labeled). j, Dot plot illustrating regulon activity (accessed using AUCell) for transcription factors specific to NMJ accessory (acc.) vs. NMJ populations (relative to their activity in baseline MF-I and MF-II states). Source data
Extended Data Fig. 5
Extended Data Fig. 5. NMJ accessory nuclei and their putative role in promoting AChRs cluster formation.
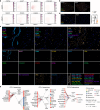
a, IF staining (left) and quantification (right, 26 young vs. 58 aged fields) of human neuromuscular junction structures with age. AChRs: α-BTX; motor neuron axon: anti-NEFH; Schwann cell: anti-S100B. p value: unpaired two-tailed t-test. Scale bar: 50 µm. ***, p < 0.001. b, UMAP visualisation of quadriceps single-nuclei data pre-processed and re-annotated in-house. c, Boxplots illustrating the proportion of each cell type in 11 aged vs. 6 young patients in b. p value: two-sided Mann-Whitney-Wilcoxon test with FDR correction. *, p < 0.05; **, p < 0.01; ***, p < 0.001. The box boundary extends from the 1st quantile (25 percentile) to the 3rd quantile (75 percentile), horizontal line represents median, ‘whiskers’ extend to points that lie within 1.5 IQRs of the lower and upper quartile, observations outside this range are considered ‘outliers’ and marked with a cross. d, Dotplot showing expression of slow and fast-twitch specific genes in young vs. aged NMJ acc. Dot size represents the proportion of cells expressing a gene, colour indicates the scaled expression level. e, Additional examples (one young and 3 aged donors) of NMJ acc. corresponding to Fig. 3k. Scale bar: 10 µm. f, IF (left) and quantifications (right, by Fiji) of AChRs on cultured human myotubes upon SORBS2 knock-down (13 vs. 8 fields). p value: unpaired two-tailed t-test. Scale bar: 50 µm. *, p < 0.05; ***, p < 0.001. Data were presented as mean ± s.e.m. g, Dot plot showcasing expression of denervation markers in NMJ and NMJ acc. as compared to MF-I and MF-II states. Dot size represents the proportion of cells expressing a gene, colour indicates the scaled expression level. The exact p values (a,c,f) are shown in the Source Data. Source data
Extended Data Fig. 6
Extended Data Fig. 6. General ageing changes in myofibers and myonuclei.
a,b, Schematic (a) and Exemplary images (b) illustrating automatic image analysis workflow and segmentation parameters. c,d, Beeswarm plots (c) and histograms (d) showing distribution of myofiber cross-sectional area in young (7 donors) vs. aged (4 donors) patients for MYH7+, MYH2+ and MYH2+MYH1+ myofiber types. Gaussian curve fits for histograms were obtained using the nonlinear regression test. p value: unpaired two-tailed t-test. ***, p < 0.001. e, f, Paired bar plots showing proportion of rare or unclassified myofiber (e) and myonuclei (f) types in young vs. aged individuals. Three snRNA-seq samples that have a high proportion (>75%) of unclassified populations were discarded. g, h, Scanned images of joint IF for MYH7 protein and RNAscope either targeting MYH1 and MYH2 (g, 1 young vs. 2 aged donors) or MYH7 and MYH2 genes (h, one donor section) on FFPE sections. Insets in h highlight exclusive staining of MYH2 gene and MYH7 gene and protein. Scale bar in g: 1000 µm; Scale bar in h: 500 µm. All data in (c-f) are presented as mean ± s.e.m. with individual data points shown in c, e and f. The exact p values are shown in the Source Data. Source data
Extended Data Fig. 7
Extended Data Fig. 7. Mechanisms countering fast-twitch myofiber loss in aging.
a, Additional examples to Fig. 4f. Joint RNAscope (MYH1, MYH2 genes) and IF (MYH7 protein) highlighting emerging expression of fast-type mRNAs (MYH1 and MYH2) in slow-twitch (MYH7+) myofiber nuclei (middle) and cytoplasm (right) in ageing. Scale bar: 20 µm. b, Dot plot illustrating age-associated changes in the glycolysis and mitochondrial biogenesis gene, PPARGC1A, in myofiber fragments and two main types of myonuclei. Dot size indicates proportion of cells expressing the gene in aged group, colour denotes log2 (FC) in gene expression. Significantly up- and down-regulated genes are highlighted with red and blue edges, respectively c. Additional examples to Fig. 4g. Joint RNAscope (MYH1, MYH2 genes) and IF (MYH7 protein) highlighting expression of fast-type IIX mRNAs (MYH1) in fast type IIa (MYH2+) myofiber nuclei (middle) and cytoplasm (on example on the right) in ageing. Scale bar: 20 µm. d, UMAP plot (left) shows MuSCs and myofiber populations from scRNA-seq. Dot plot (right) shows their marker genes, which are presented in the order of their appearance in the myogenesis trajectory. Dot size represents the proportion of cells expressing a gene, colour indicates the expression level. e, Reduced dimensional space showing cellular trajectory between MuSC and myofiber inferred by Monocle2 algorithm coloured according to populations in d. Source data
Extended Data Fig. 8
Extended Data Fig. 8. Cell type composition of human skeletal muscle microenvironment.
ac, UMAP plots showing annotated subpopulations of immune cells (a), fibroblasts and Schwann cells (b), as well as endothelial and smooth muscle cells (c). Cell type abbreviations are explained in Supplementary Table 10. Cell populations marked in grey contained very few cells or (and) were represented in 1-2 individuals, thus were excluded from further analyses. df, Dot plots illustrating marker genes specific for subpopulations of immune cells (d), fibroblasts and Schwann cells (e) as well as vasculature cells (f). Dot size represents the proportion of cells expressing a gene, colour indicates the scaled expression level. Source data
Extended Data Fig. 9
Extended Data Fig. 9. Age-associated changes in the cell types within muscle microenvironment.
a, UMAP plots highlighting expression of terminal Schwann cell markers in non-myelinating Schwann cell cluster. b, Scanned whole sections showing co-IF of CD3 and Laminin on fresh-frozen human young vs. aged skeletal muscles. Staining was performed on 6 young and 4 aged donors. Scale bar: 500 µm. c, An exemplary field of view showing 15-plex RareCyte protein staining on aged FFPE skeletal muscle section. Staining is shown for 5 channels at a time together with Hoechst nuclei staining as well as for each channel separately highlighting various cell types and states. Antibodies used and the corresponding cell types they recognize are provided in Supplementary Table 9. Scale bar: 50 µm. d, RareCyte staining of CD31+ endothelial cells (left) and bar plots (right) illustrating number of CD31+ cells/field in young (10 fields) vs. aged (10 fields) donors. Scale bar: 50 µm. p value: unpaired two-tailed t-test. ***, p < 0.001. Data were presented as mean ± s.e.m. with individual data points shown. e, Putative cell-cell interactions in the aged skeletal muscle mediated via CCL3, CCL4 and CXCL8 chemokines produced by microenvironment cells. Emitter (leftmost) and receiver (rightmost) cell types are marked with circles, which are coloured according to a broad cell type group; ligands and receptors are marked with square nodes. Solid edges connect cell types and ligands, or receptors, which they express; thickness of the line is proportional to the mean expression level of the gene in each cell type. Dotted edges connect putative receptors and their ligands. Source data
Extended Data Fig. 10
Extended Data Fig. 10. Integrated human-mouse skeletal muscle aging atlas.
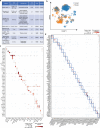
a, Overview table showcasing metadata (age composition, muscle type, 10x chemistry, number of cells, species) for the datasets included into human-mouse skeletal muscle aging atlas. b, UMAP visualisation of human-mouse aging cell atlas coloured according to species. c, d, Dot plot showing species-common (c) and -specific (d) marker genes for each major cell type annotated in the human-mouse skeletal muscle aging atlas. Dot size represents the proportion of cells expressing a gene, colour indicates its expression level. Source data

Similar articles

Cited by

References

    1. Tidball JG. Regulation of muscle growth and regeneration by the immune system. Nat. Rev. Immunol. 2017;17:165–178. doi: 10.1038/nri.2016.150. - DOI - PMC - PubMed
    1. Pedersen BK, Febbraio MA. Muscles, exercise and obesity: skeletal muscle as a secretory organ. Nat. Rev. Endocrinol. 2012;8:457–465. doi: 10.1038/nrendo.2012.49. - DOI - PubMed
    1. Hargreaves M, Spriet LL. Skeletal muscle energy metabolism during exercise. Nat. Metab. 2020;2:817–828. doi: 10.1038/s42255-020-0251-4. - DOI - PubMed
    1. Siparsky PN, Kirkendall DT, Garrett WE., Jr. Muscle changes in aging: understanding sarcopenia. Sports Health. 2014;6:36–40. doi: 10.1177/1941738113502296. - DOI - PMC - PubMed
    1. World Health Organization. Falls. https://www.who.int/news-room/fact-sheets/detail/falls (2021).