. 2024 Jan;395(1):81-103.
doi: 10.1007/s00441-023-03844-9. Epub 2023 Nov 30.

Heterogeneity of endothelial VE-PTP downstream polarization, Tie2 activation, junctional claudin-5, and permeability in the aorta and vena cava

Affiliations

Heterogeneity of endothelial VE-PTP downstream polarization, Tie2 activation, junctional claudin-5, and permeability in the aorta and vena cava

Peter Baluk et al. Cell Tissue Res. 2024 Jan.

Abstract

Endothelial cells of mammalian blood vessels have multiple levels of heterogeneity along the vascular tree and among different organs. Further heterogeneity results from blood flow turbulence and variations in shear stress. In the aorta, vascular endothelial protein tyrosine phosphatase (VE-PTP), which dephosphorylates tyrosine kinase receptor Tie2 in the plasma membrane, undergoes downstream polarization and endocytosis in endothelial cells exposed to laminar flow and high shear stress. VE-PTP sequestration promotes Tie2 phosphorylation at tyrosine992 and endothelial barrier tightening. The present study characterized the heterogeneity of VE-PTP polarization, Tie2-pY992 and total Tie2, and claudin-5 in anatomically defined regions of endothelial cells in the mouse descending thoracic aorta, where laminar flow is variable and IgG extravasation is patchy. We discovered that VE-PTP and Tie2-pY992 had mosaic patterns, unlike the uniform distribution of total Tie2. Claudin-5 at tight junctions also had a mosaic pattern, whereas VE-cadherin at adherens junctions bordered all endothelial cells. Importantly, the amounts of Tie2-pY992 and claudin-5 in aortic endothelial cells correlated with downstream polarization of VE-PTP. VE-PTP and Tie2-pY992 also had mosaic patterns in the vena cava, but claudin-5 was nearly absent and extravasated IgG was ubiquitous. Correlation of Tie2-pY992 and claudin-5 with VE-PTP polarization supports their collective interaction in the regulation of endothelial barrier function in the aorta, yet differences between the aorta and vena cava indicate additional flow-related determinants of permeability. Together, the results highlight new levels of endothelial cell functional mosaicism in the aorta and vena cava, where blood flow dynamics are well known to be heterogeneous.

Keywords: Adherens junctions; Blood flow; C57BL/6 mice; Endothelial barrier function; Immunohistochemistry; Receptor-type protein tyrosine phosphatase beta (PTPRB); Shear stress; Tight junctions; Vascular permeability.


Conflict of interest statement

The authors have no conflicts of interest to declare.

Figures

Fig. 1
Fig. 1
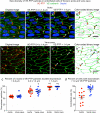
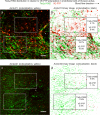
Heterogeneity of VE-PTP downstream polarization in aorta and vena cava. ac Confocal microscopic images of immunohistochemical staining for VE-PTP (red), VE-cadherin, (green), and nuclei (blue, lamin A/C) of endothelial cells in the descending thoracic aorta near an intercostal artery ostium (asterisk) (a, b) and inferior vena cava between the right atrium and diaphragm (c). Blood flow is left to right. VE-PTP is concentrated in the downstream half of endothelial cells, but the amount varies from cell to cell. A conspicuous patch of VE-PTP is located near the downstream tip of some endothelial cells but not in others. Downstream concentrations of VE-PTP are larger in the aorta (a, b) but are more frequent in the vena cava (c). Scale bars: a 50 µm, b, c 20 µm
Fig. 2
Fig. 2
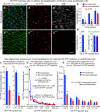
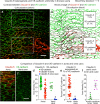
Heterogeneity of VE-PTP particle size and number in aorta and vena cava. aa’’’ Color-coded binary images made from confocal microscopic images of aortic endothelial cells to show 3 sizes of VE-PTP particles separately and together. Blood flow left to right. The smallest particles, < 0.4 µm in diameter (a, black, 1 < 10 pixels), are widely scattered, whereas those 0.4 ≤ 1.4 µm in diameter (a’, blue, 11 ≤ 100 pixels) resemble endosomes and are most abundant in the downstream half of endothelial cells. The largest VE-PTP particles, > 1.4 µm in diameter (a’’, red, > 100 pixels), partially overlap VE-cadherin (green) at the downstream cell tip. VE-PTP colocalized with VE-cadherin is black. Scale bar: 20 µm. b Size comparison of 3 groups of VE-PTP particles in endothelial cells of the aorta and vena cava (VC). VE-PTP particles in the > 1.4 µm group had the greatest variability in size and were significantly larger in the aorta than vena cava. *P < 0.05, by one-way ANOVA followed by Tukey’s multiple comparison test. Mean ± SEM. n = 12 images from 6 mice/group. cc’’ Comparison of number of 3 sizes of VE-PTP particles per endothelial cell. Region-to-region heterogeneity is evident in the aorta and vena cava. Mean ± SEM, n = 12 images from 6 mice/group
Fig. 3
Fig. 3
Size differences in VE-PTP particles polarized downstream in aorta and vena cava. aa’’’ Confocal microscopic images of VE-PTP (red), VE-cadherin (green), and nuclei (blue, lamin A/C) in thoracic aorta comparing the original image (a) to binary images of VE-PTP particles with diameters of 0.4 ≤ 1.4 µm (a’) or > 1.4 µm (a’’) and color-coded composite of the 0.4 < 1.4 µm (blue) and > 1.4 µm (red) binary images (a’’’). Blood flow left to right. VE-PTP particles 0.4 ≤ 1.4 µm in diameter are scattered in the downstream cytoplasm, whereas VE-PTP particles > 1.4 µm are concentrated at the downstream cell tip (arrows). bb’’’ Images of vena cava stained as in (aa’’’). Arrows mark VE-PTP at the downstream cell tip. Scale bars: 10 µm. c Percentages of 3 sizes of VE-PTP particles in the downstream half of endothelial cells in the aorta and vena cava. *P < 0.05 compared to < 0.4-µm group; †P < 0.05 compared to 0.4 ≤ 1.4 µm group, by one-way ANOVA followed by Tukey’s multiple comparison test. Mean ± SEM, n = 12 images from 6 mice/group. d Dot plots showing percentages of endothelial cells with > 1.4 µm VE-PTP particles with significantly larger values for the vena cava than for the aorta. *P < 0.05 by Student’s t test. Mean ± SEM, n = 12 images from 6 mice/group
Fig. 4
Fig. 4
Colocalization of VE-PTP with VE-cadherin in aorta and vena cava. aa’ Confocal microscopic images of aorta (a) and vena cava (a’) showing partial colocalization (white) of the largest VE-PTP particles (> 1.4-µm diameter, red) with VE-cadherin (green) at the downstream tip of endothelial cells (arrows). Blood flow left to right. Scale bar: 10 µm. bb’ Dot plots for aorta (b) and vena cava (b’) comparing percent of the largest VE-PTP particles (> 1.4 µm) colocalized with VE-cadherin (% of VE-PTP, left dot plots) and percent of VE-cadherin colocalized with VE-PTP (% of VE-cadherin, right dot plots). The percent of VE-PTP colocalized with VE-cadherin was significantly greater (asterisks) than VE-cadherin colocalized with VE-PTP, as expected for colocalization limited to focal regions of plasma membrane. *P < 0.05 by one-way ANOVA followed by Tukey’s multiple comparison test. Mean ± SEM, n = 12 images from 6 mice/group. c Plots of van Steensel’s peak cross-correlation coefficient (CCF) (ImageJ/Fiji > JACoP plugin) in an aorta and vena cava showing positive pixel shift values at maximal colocalization, indicating that the VE-PTP image was shifted to the right (toward the downstream plasma membrane) at peak CCF. This feature is evidence that large VE-PTP particles at the cell tip in (a, a’) were composed to two parts, non-colocalized red pixels in the cytoplasm and colocalized white pixels in the plasma membrane. d Heterogeneity of pixel shift values for 12 image pairs having peak CCF values with a right shift averaging +5.3 pixels (0.66 µm) in aorta and +8.7 pixels (1.07 µm) in vena cava. Y-axes show CCF values scaled in micrometers (left) and pixels (right). *P < 0.05 by Student’s t test. Mean ± SEM, n = 12 images from 6 mice/group
Fig. 5
Fig. 5
Number and size of VE-PTP particles in permeabilized and non-permeabilized aortic endothelial cells. aa’’’’’ Confocal microscopic images of VE-PTP (red), Willebrand factor (vWF, blue or white), and VE-cadherin (green) in thoracic aorta endothelial cells with (aa’’) or without (a’’’a’’’’) permeabilization during staining for VE-PTP and vWF. VE-cadherin was stained in the presence of TritonX-100 in all specimens. Permeabilization was required for vWF staining in cytoplasmic organelles. Most small VE-PTP particles required permeabilization for staining, but the largest particles did not. Scale bar: 25 µm. b Area density measurements revealed significantly fewer ≤ 100-pixel VE-PTP particles but similar numbers of larger VE-PTP particles in aortas without permeabilization. b’ As expected, vWF staining required permeabilization, as almost none was found without TritonX-100. VE-cadherin values were similar in the two groups because TritonX-100 was used for VE-cadherin staining in all specimens (blue/red hashed bar). *P < 0.0001 by ANOVA or Student’s t test. c Measurements showed significantly fewer ≤ 10-pixel and 11 ≤ 100-pixel VE-PTP particles per endothelial cell without permeabilization. *P < 0.0001 by Student’s t test. d Line plots of aortas show significantly fewer 101 ≤ 200-pixel VE-PTP particles without permeabilization but similar numbers of > 200-pixel particles, consistent with a cytoplasmic location of most smaller VE-PTP particles and plasma membrane location of larger VE-PTP particles. P < 0.0001 by Kolmogorov-Smirnov 2-sample test. e Comparison of large VE-PTP particles shows significantly fewer 101 ≤ 200-pixel particles without permeabilization. Permeabilization had little effect on VE-PTP particles > 200 pixels, which fit with a plasma membrane location. *P < 0.0001 by two-way ANOVA. Mean ± SEM, n = 12 images from 6 mice/group
Fig. 6
Fig. 6
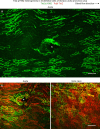
Tie2-pY992 heterogeneity in aorta and vena cava. ac Confocal microscopic images showing the heterogeneous distribution of Tie2-pY922 (green) in endothelial cells of the thoracic aorta and vena cava of mice. The mosaic pattern of Tie2-pY992 consists of clusters of endothelial cells with strong staining surrounded by endothelial cells with little or no staining (a). Blood flow is left to right. b, c Broader distribution of overall Tie2 protein (red) than Tie2-pY992 (green) in the aorta (b) and vena cava (c). In both vessels, Tie2-pY992 staining is strongest at endothelial cell borders, whereas overall Tie2 is widespread. Asterisks mark intercostal artery ostia (a, b). Endothelial cells of the aorta are more elongated than those of the vena cava. Scale bars: 50 µm
Fig. 7
Fig. 7
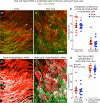
Tie2-pY992 has a restricted distribution in relation to Tie2 in aorta and vena cava. a, a’ Confocal microscopic images of total Tie2 (red) and Tie2-pY922 (green) staining in endothelial cells of the descending thoracic aorta (a) and vena cava (a’). Tie2 is much more widespread than Tie2-pY992, which is restricted to a subset of endothelial cells. Scale bar: 20 µm. b Measurements documenting the broader distribution of Tie2 than Tie2-pY992 and similarity of amounts of both in the aorta and vena cava. c, c’ The same images as in (a, a’), here showing the distribution of Tie2-pY992/Tie2 colocalization (white) in the aorta (c) and vena cava (c’). Scale bar: 20 µm. d Measurements of Tie2-pY992/Tie2 colocalization expressed as the percent of Tie2 colocalized (left dot plots) and percent of Tie2-pY992 colocalized (right dot plots). The plots show that 86% of Tie2-pY992 colocalized with Tie2 (right), but only 29% of Tie2 in aorta and 23% of Tie2 in vena cava colocalized with Tie2-pY992 (left). *P < 0.05 by one-way ANOVA followed by Tukey’s multiple comparison test. Mean ± SEM, n = 12 images from 6 mice/group
Fig. 8
Fig. 8
Tie2-pY992 distribution in relation to VE-PTP polarization in aorta. ad Confocal microscopic images (a, c) of endothelial cells in descending thoracic aorta upstream to intercostal artery ostia (asterisks) and corresponding color-coded binary images (b, d) comparing heterogeneous amounts of Tie2-pY992 staining (green) and VE-PTP polarization (red) in two aortas. Blood flow left to right. Measured fractional areas of Tie2-pY992 and VE-PTP are shown in white boxes (area density, %). a, b Aorta #1: Two regions of endothelium (boxes) with weak Tie2-pY992 and moderate VE-PTP polarization in the upper box and strong Tie2-pY992 and strong VE-PTP polarization in the lower box. c, d Aorta #2: Adjacent regions (boxes), both having moderate Tie2-pY992 and weak VE-PTP polarization in the endothelium of another aorta. Scale bars: 50 µm
Fig. 9
Fig. 9
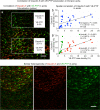
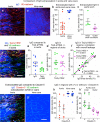
Tie2-pY992 and VE-PTP correlation in endothelial cells of aorta but not vena cava. Confocal microscopic images (ad) and linear regression plots (a’d’) of Tie2-pY992 (green) and VE-PTP (red) in endothelial cells of thoracic aorta (a, a’, b, b’) and vena cava (c, c’, d, d’). a Image of aorta showing heterogeneity of downstream polarization of VE-PTP particles and Tie2-pY992 at intercellular junctions and focal adhesions (arrows). a’ Regression plot showing significant correlation of Tie2-pY992 and VE-PTP area densities. P = 0.04. b Same image as in (a) here showing only > 1.4 µm VE-PTP particles and Tie2-pY992 at cell junctions. b’ Regression plot showing significant correlation between junctional Tie2-pY992 and number of > 1.4 µm VE-PTP particles. P = 0.015, n = 12 images from 5 mice. c Image of inferior vena cava showing heterogeneous Tie2-pY992 staining and VE-PTP polarization in endothelial cells. c’ Regression plot documenting the heterogeneity and lack of correlation between Tie2-pY992 and VE-PTP in the vena cava. P = 0.5. d Same region in (c) here showing only > 1.4 µm VE-PTP particles and Tie2-pY992 at cell junctions. d’ Regression plot showing lack of correlation between junctional Tie2-pY992 and > 1.4 µm VE-PTP particles in the vena cava. P = 0.43, n = 12 images from 6 mice. Scale bar: 20 µm
Fig. 10
Fig. 10
Claudin-5 heterogeneity in aorta and absence in vena cava. a Confocal microscopic image of a region of descending aorta upstream to an intercostal artery ostium (asterisk) illustrating the heterogeneity of claudin-5 (red) and the uniform distribution of VE-cadherin (green) in endothelial cells. Blood flow left to right. Scale bar: 50 µm. b Color-coded binary version of image (a) showing amounts of claudin-5 and VE-cadherin in boxed regions. In the upper box, claudin-5 (area density 7.0%) was only 26% of VE-cadherin (area density 27.1%), but in the lower box claudin-5 (area density 25.1%) was 98% of VE-cadherin (area density 25.5%). c, c’ Confocal microscopic images comparing amounts of claudin-5 (red) and VE-cadherin (green) in thoracic aorta (c) and inferior vena cava (c’). Claudin-5 staining is patchy in the aorta and absent in the vena cava. Scale bar: 20 µm. d Measurements comparing the heterogeneity in amount of claudin-5 and VE-cadherin staining in the aorta and vena cava. e Dot plots showing amount of claudin-5 in the aorta and vena cava expressed as percent of VE-cadherin. *P < 0.0001 by Student’s t test. Mean ± SEM, n = 43 regions of aorta in 10 mice and n = 8 regions of vena cava in 5 mice. f Area density of claudin-5 in the inner and outer curvatures of aortic arch. *P < 0.001 by Student’s t test. Mean ± SEM, n = 5 images of each region of aortic arch and 9 images of vena cava in 5 mice
Fig. 11
Fig. 11
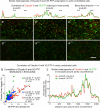
Claudin-5 and VE-PTP correlation in endothelial cells of aorta. a Confocal microscopic image of the aortic region shown in Fig. 10a, here comparing claudin-5 (red) and VE-PTP (green) staining. Upper box shows a region with little claudin-5 or VE-PTP. Lower box shows an adjacent region with abundant claudin-5 and VE-PTP. Claudin-5 and VE-PTP area densities are shown in outlined regions. Scale bar: 50 µm. b, b’ Linear regression plots showing significant correlation of claudin-5 and VE-PTP in endothelial cells in two aortas. b shows values for 32 regions plotted together (P = 0.003). b’ shows the same values plotted separately for the two aortas. Claudin-5 and VE-PTP are significantly correlated in both curves, but the slopes are different. Aorta #1, P < 0.0001, n = 15 regions. Aorta #2, P = 0.0011, n = 17 regions. cc’’ Confocal microscopic image of claudin-5 (red) and VE-PTP (green) in aorta, shown here together (c) and separately (c’ claudin-5, c’’ VE-PTP), to illustrate the similar heterogeneities in another aorta (Aorta #5, Fig. 12a’’, a’’’’’) that was sampled around the entire circumference. Scale bar: 50 µm
Fig. 12
Fig. 12
Similar heterogeneity of claudin-5 and VE-PTP around aortic circumference. aa’’’’’ Confocal microscopic images of claudin-5 (red) and VE-PTP (green) comparing regions with strong (aa’’) and weak (a’’’a’’’’’) staining in the three aortas numbered #3–5 that were sampled around the entire circumference (values for aortas #1–2 are shown in Fig. 11b, b; aorta #5 is also shown in Fig. 11c–c’’). Blood flow left to right. Line plots above the images show similar heterogeneities of fluorescence intensities of claudin-5 (red) and VE-PTP (green) sampled around the entire 2-mm circumference of each aorta. Black lines mark the locations of corresponding images. Scale bar: 20 µm. b Linear regression plots comparing claudin-5 and VE-PTP in endothelial cells around the circumference of the three aortas shown in (aa’’’’’). The plots show significant correlation (P < 0.0001) of claudin-5 and VE-PTP measured in 61–73 regions (1500 × 250 pixels each) sampled sequentially around each aorta. c Line plots showing similarly heterogenous claudin-5 and VE-PTP fluorescence sampled around the circumference of aorta #5 in (a’’, a’’’’’). Claudin-5 and VE-PTP fluorescence intensities were standardized by normalizing values to the respective mean. No significant difference (P > 0.5) by Kolmogorov-Smirnov 2-sample test
Fig. 13
Fig. 13
Heterogeneity of extravasated IgG in aorta and vena cava. a, a’ Confocal microscopic images showing patchy extravasated IgG (blue) in thoracic aorta (a) and widespread IgG in vena cava (a’). VE-cadherin (red). b Heterogeneity of IgG in aorta (mean 31%) and vena cava (mean 92%). n = 16 and 9 images from 6 mice, *P < 0.001 by Student’s t test. c Heterogeneity of IgG in aortic arch inner (mean 52%) and outer curvature (mean 23%). n = 5 images of each from 5 mice, *P < 0.05 by Student’s t test. d Aorta in (a) here showing IgG (blue) in relation to Tie2-pY992 (red) and VE-cadherin (yellow/green). e, e’ Heterogeneity of IgG and Tie2-pY992 in aorta (e) and similar amounts of IgG in regions with or without Tie2-pY992 (e’). n = 11 images from 6 mice. P = 0.65 by Student’s t test. f Linear regression plots showing strong correlation (P < 0.0001) between IgG in regions of aorta with or without Tie2-pY992 (+ vs -, black) and between IgG in regions with (+, green) or without Tie2-pY992 (-, magenta) and total IgG. n = 11 images from 6 mice. Tie2-pY992-positive regions: R2 0.925, P < 0.0001. Tie2-pY992-negative regions: R2 0.997, P < 0.0001. IgG in Tie2-pY992-positive vs. -negative: R2 0.903, P < 0.0001. g, g’ Images contrasting patchy claudin-5 (red) and IgG (blue) in aorta (g) with no claudin-5 and widespread IgG in vena cava (g’). VE-cadherin (green). h, h’ Heterogeneous but roughly equal amounts of IgG in regions with or without claudin-5 in thoracic aorta and vena cava (h) and aortic arch inner and outer curvatures (h’). P < 0.001 by Student’s t test. n = 5 images in thoracic aorta and aortic arch, 9 images in vena cava from 5 mice. Graphs show individual values and mean ± SEM expressed as percent area density. Scale bars: 20 µm

Similar articles

References

    1. Aird WC. Endothelial cell heterogeneity. Cold Spring Harb Perspect Med. 2012;2:a006429. doi: 10.1101/cshperspect.a006429. - DOI - PMC - PubMed
    1. Augustin HG, Koh GY (2017) Organotypic vasculature: From descriptive heterogeneity to functional pathophysiology. Science 357:eaal2379 - PubMed
    1. Baumer S, Keller L, Holtmann A, Funke R, August B, Gamp A, Wolburg H, Wolburg-Buchholz K, Deutsch U, Vestweber D. Vascular endothelial cell-specific phosphotyrosine phosphatase (VE-PTP) activity is required for blood vessel development. Blood. 2006;107:4754–4762. doi: 10.1182/blood-2006-01-0141. - DOI - PubMed
    1. Becker LM, Chen SH, Rodor J, de Rooij L, Baker AH, Carmeliet P (2022) Deciphering endothelial heterogeneity in health and disease at single cell resolution: Progress and perspectives. Cardiovasc Res 18:cvac018 - PMC - PubMed
    1. Betsholtz C. Toward a granular molecular-anatomic map of the blood vasculature - single-cell RNA sequencing makes the leap. Ups J Med Sci. 2022;127:e9051. doi: 10.48101/ujms.v127.9051. - DOI - PMC - PubMed

LinkOut - more resources