. 2023 Aug 1;133(15):e166954.
doi: 10.1172/JCI166954.

Monocyte-derived macrophages orchestrate multiple cell-type interactions to repair necrotic liver lesions in disease models

Affiliations

Monocyte-derived macrophages orchestrate multiple cell-type interactions to repair necrotic liver lesions in disease models

Dechun Feng et al. J Clin Invest. .

Abstract

The liver can fully regenerate after partial resection, and its underlying mechanisms have been extensively studied. The liver can also rapidly regenerate after injury, with most studies focusing on hepatocyte proliferation; however, how hepatic necrotic lesions during acute or chronic liver diseases are eliminated and repaired remains obscure. Here, we demonstrate that monocyte-derived macrophages (MoMFs) were rapidly recruited to and encapsulated necrotic areas during immune-mediated liver injury and that this feature was essential in repairing necrotic lesions. At the early stage of injury, infiltrating MoMFs activated the Jagged1/notch homolog protein 2 (JAG1/NOTCH2) axis to induce cell death-resistant SRY-box transcription factor 9+ (SOX9+) hepatocytes near the necrotic lesions, which acted as a barrier from further injury. Subsequently, necrotic environment (hypoxia and dead cells) induced a cluster of complement 1q-positive (C1q+) MoMFs that promoted necrotic removal and liver repair, while Pdgfb+ MoMFs activated hepatic stellate cells (HSCs) to express α-smooth muscle actin and induce a strong contraction signal (YAP, pMLC) to squeeze and finally eliminate the necrotic lesions. In conclusion, MoMFs play a key role in repairing the necrotic lesions, not only by removing necrotic tissues, but also by inducing cell death-resistant hepatocytes to form a perinecrotic capsule and by activating α-smooth muscle actin-expressing HSCs to facilitate necrotic lesion resolution.

Keywords: Gastroenterology; Hepatitis; Hepatology; Macrophages.


Figures
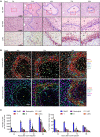
Figure 1
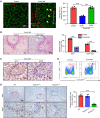
Figure 1. MoMFs and aHSCs are the major cell types encapsulating necrotic lesions after ConA-induced liver injury.
C57BL/6 mice were treated with 12 mg/kg ConA. Liver samples were collected 24, 48, 72, and 96 hours after ConA treatment. (A) Liver sections were stained with CD45 antibody and H&E. Representative images are shown (n = 5). (B and C) Multiplex immunofluorescent staining of several cell markers was performed on liver sections with necrotic lesions. Representative images are shown in B (n = 5). Quantification of number for each cell type identified in the border areas (indicated by dash lines) of necrotic regions is shown in C. The number and percentage of each type of cells are represented as means ± SD (n = 5). N, necrotic area.
Figure 2
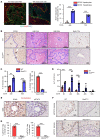
Figure 2. MoMF-derived JAG1 signaling is required for the generation of SOX9+ hepatocytes in the early stages of liver repair after injury.
(A) Representative immunofluorescent staining of SOX9 and β-catenin of liver tissues from ConA-treated mice (48 hours after treatment, n = 4). Red arrows indicate SOX9+ hepatocytes in the ConA-injured liver; yellow arrows indicate normal hepatocytes. β-Catenin shows membrane of hepatocytes. The average sizes of hepatocytes were quantified based on β-catenin staining. (B) Mice were treated with ConA for 24 hours, followed by injecting clodronate liposomes or control liposomes. Liver samples were collected 48 hours after ConA treatment. SOX9 and IBA1 double staining were performed on these samples (n = 5). (C) Mice were treated with ConA for 48 hours, followed by staining of liver tissues with JAG1 and SOX9 antibodies (n = 5). (D) Heterozygous CCR2-RFP mice (CCR2+ MoMFs are labeled with RFP) were treated with ConA. Liver MNCs were isolated and subjected to flow cytometry analyses of JAG1 and RFP (n = 5). (E) WT and hepatocyte-specific Notch1- and Notch2-knockout mice were treated with ConA for 48 hours. SOX9 protein in the liver tissues was stained, and the number of SOX9+ hepatocytes was quantified (n = 6). Representative images are shown in A, B, C, and E. Values in A, B, D, and E are represented as means ± SD. Statistical significance was assessed using 2-tailed Student’s t test for comparing 2 groups (B) and 1-way ANOVA followed by Tukey’s post hoc test for multiple groups (A and E). ***P < 0.001. Dashed lines indicate the borderlines of necrotic areas.
Figure 3
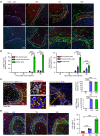
Figure 3. Evidence for the resistance of SOX9+ hepatocytes to cell death.
(A) C57BL/6 mice were treated with ConA for 48 and 72 hours; BrdU was given 2 hours before sacrifice. BrdU and SOX9 double staining of liver tissues (see representative images on the left) (n = 4). Percentages of BrdU+ hepatocytes were quantified (right). (B) WT and Sox9Hep–/– mice were treated with ConA for different times; BrdU was given 2 hours before sacrifice. Representative SOX9, H&E, and BrdU staining of liver tissues is shown (n = 4–5). Arrows indicate SOX9+ BDCs. (C) Percentages of necrotic area and percentages of Brdu+ hepatocytes from B were quantified. (D) Serum ALT levels were analyzed (n = 3–4). (E) C57BL/6 mice were treated with ConA for 48 hours. SOX9 and pSTAT3 staining of serial sections of liver tissues. Representative images are shown (n = 5). (F) WT, Sox9Hep–/–, and Notch2Hep–/– mice were treated with ConA for 48 hours. pSTAT3 was stained for the liver tissues (n = 5). (G) Percentages of pSTAT3+ hepatocytes from F were quantified (n = 5). Dashed lines indicate the borderlines or border areas of necrotic regions. Values in A, C, D, and G are represented as means ± SD. Statistical significance was assessed using 2-tailed Student’s t test for comparing 2 groups (A, C, D and G). **P < 0.01; ***P < 0.001.
Figure 4
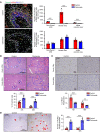
Figure 4. aHSCs aggregate in the border areas of necrosis at the late-stage recovery of live injury.
(A and B) C57BL/6 mice were treated with ConA. BrdU was given 2 hours before sacrifice. Liver tissues were collected and stained with desmin/α-SMA and desmin/BrdU. Representative images are shown in A (n = 4). Quantification of aHSCs and proliferating HSCs in noninjured area, inside necrotic area, and border area in A is shown in B. (C) Liver tissues from ConA-treated mice were stained with desmin/YAP/α-SMA or desmin/PMLC. Representative triple- or double-staining images are shown (n = 5). Quantitation of the percentages of YAP+Desmin+ and pMLC+Desmin+ in border areas was performed. (D) Liver tissues from ConA-treated mice were stained with IBA1/ECE1 (n = 4–5). Dashed lines indicate the border areas of necrotic regions. Quantitation of ECE1+IBA1+/total IBA1+ cells in border areas was performed. Values in BD are represented as means ± SD. Statistical significance was assessed using 1-way ANOVA followed by Tukey’s post hoc test for multiple groups (BD). **P < 0.01; ***P < 0.001.
Figure 5
Figure 5. Depletion of MoMFs after injury abolishes HSC aggregation and exacerbates ConA-induced liver injury.
C57BL/6 mice were treated with ConA. Clodronate liposome or control liposome was given to these mice 24, 48, and 72 hours after ConA injections. Mice were euthanized 96 hours after ConA injection. BrdU was given 2 hours before sacrifice. Liver tissues were stained with IBA desmin and α-SMA (A, n = 4), H&E (B, n = 5-8), BrdU (C, n = 6), and TUNEL (D, n = 6). Arrows indicate TUNEL+ hepatocytes. Representative images are shown. Dashed lines indicate the border areas of necrotic regions. Values are represented as means ± SD. Statistical significance was assessed using 2-tailed Student’s t test for comparing 2 groups (AD). **P < 0.01; ***P < 0.001.
Figure 6
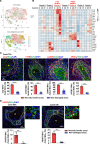
Figure 6. scRNA-Seq identifies 2 clusters of necrosis-associated MoMFs: C1q+ and Pdgfb+ MoMFs.
(A and B) Liver MoMFs were isolated from ConA-treated mice (0-, 48-, and 72-hour time points). These cells were subjected to the 10x Genomics Chromium platform for scRNA-Seq. t-SNE plots of cells from naive (1,106 cells), ConA 48 hours after injection (ConA48) (8,541 cells), and ConA 72 hours after injection (3,575 cells) are shown in A. Heatmap of the signature genes of C1q+ macrophages (cluster 2) and Pdgfb+ macrophages (cluster 4) is shown in B. (C and D) C57BL/6 mice were treated with ConA for 48 or 72 hours. Liver tissues were doubly stained with C1Q/IBA1, CTSB/IBA1, LGMN/IBA1, and APOE/IBA1 (C, n = 5), and PDGFB/IBA1 (D, n = 5). Dashed lines indicate the border areas of necrotic regions. Arrowheads indicate IBA+ cells with PDGFB expression. Representative images and quantitation are shown. Values in C and D are represented as means ± SD. Statistical significance was assessed using 2-tailed Student’s t test for comparing 2 groups (C and D). ***P < 0.001.
Figure 7
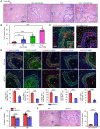
Figure 7. Hypoxia triggers reprogramming of MoMFs in necrotic areas, contributing to the late stages of liver-injury resolution.
(A and B) WT and C1q–/– mice were treated with ConA, followed by treatment with PBS or CA-074 Me 48 and 72 hours after ConA injection. Liver tissues were collected 96 hours after ConA injection. Representative H&E staining of liver tissue is shown (A, n = 4-7). Quantification of necrotic area is shown in B. (C) C57BL/6 mice were treated with ConA for 72 hours. Liver tissues were collected for IBA1/hypoxia probe staining and HIF1α/IBA1 double staining. Representative images are shown (n = 5). (D) WT and Hif1amye–/– mice were treated with ConA for 72 hours. Liver tissues were collected for double staining with various antibodies, as indicated (n = 5). Quantification of the percentage of positive cells is shown. (E) MoMFs from ConA-treated mice were isolated for bead uptake assay (n = 6–7). (F) WT and Hif1amye–/– mice were treated with ConA for 96 hours. Liver tissues were collected for H&E staining, and quantification of necrotic areas is shown on the right (n = 4). Dashed lines indicate the borders of necrotic areas. Values in B, D, E, and F are represented as means ± SD. Statistical significance was assessed using 2-tailed Student’s t test for comparing 2 groups (DF) and 1-way ANOVA followed by Tukey’s post hoc test for multiple groups (B). **P < 0.01; ***P < 0.001.
Figure 8
Figure 8. Myeloid cell–derived PDGFB promotes HSC proliferation and activation.
WT, Pdgfbmye–/–, and PdgfraHSC–/– mice were treated with ConA for 72 or 96 hours. BrdU was given 2 hours before sacrifice. Liver tissues were stained with (A) IBA1 and α-SMA (n = 4), (B) BrdU and desmin (n = 4), and (C) H&E (n = 4). Numbers of aHSCs and BrdU+ HSCs in the border of necrotic areas were quantified and are shown on the right. Dashed lines indicate the border areas of necrotic regions. Values in AC are represented as means ± SD. Statistical significance was assessed using 1-way ANOVA followed by Tukey’s post hoc test for multiple groups (AC). **P < 0.01; ***P < 0.001.
Figure 9
Figure 9. A model depicting the dynamic changes of MoMFs and their interaction with other cells, promoting liver necrotic lesion resolution.
The liver has a great ability to repair and eliminate necrotic lesions after acute immune-mediated liver injury. At the early stage of liver injury, JAG1+ MoMFs, which are induced by hepatocyte-derived CCL2, help build cell death–resistant SOX9+ hepatocyte walls to encapsulate the necrotic areas and subsequently protect the nondamaged hepatocytes from further injury. At the later stage, necrotic environment (hypoxia and dead hepatocytes) induces C1q+ MoMFs and Pdgfb+ MoMFs to encapsulate the necrotic lesions. C1q+ MoMFs play an important role in removing dead cells and necrotic tissues, while Pdgfb+ MoMFs induce activation of α-SMA+ HSCs that squeeze the capsule of the necrotic lesions to facilitate their elimination. Hepatocytes in nondamaged areas proliferate and expand, which may further help contract the capsule of the necrotic lesions. NAFLD, nonalcoholic fatty liver disease.

Similar articles

Cited by

References

    1. Michalopoulos GK, DeFrances MC. Liver regeneration. Science. 1997;276(5309):60–66. doi: 10.1126/science.276.5309.60. - DOI - PubMed
    1. Michalopoulos GK, Bhushan B. Liver regeneration: biological and pathological mechanisms and implications. Nat Rev Gastroenterol Hepatol. 2021;18(1):40–55. doi: 10.1038/s41575-020-0342-4. - DOI - PubMed
    1. Campana L, et al. Liver regeneration and inflammation: from fundamental science to clinical applications. Nat Rev Mol Cell Biol. 2021;22(9):608–624. doi: 10.1038/s41580-021-00373-7. - DOI - PubMed
    1. Krishna M. Patterns of necrosis in liver disease. Clin Liver Dis (Hoboken) 2017;10(2):53–56. doi: 10.1002/cld.653. - DOI - PMC - PubMed
    1. Weng HL, et al. Two sides of one coin: massive hepatic necrosis and progenitor cell-mediated regeneration in acute liver failure. Front Physiol. 2015;6:178. doi: 10.3389/fphys.2015.00178. - DOI - PMC - PubMed

Publication types