. 2023 Jun 8;8(84):eabq7991.
doi: 10.1126/sciimmunol.abq7991. Epub 2023 Jun 2.

Spatial transcriptomics stratifies psoriatic disease severity by emergent cellular ecosystems

Affiliations

Spatial transcriptomics stratifies psoriatic disease severity by emergent cellular ecosystems

Rochelle L Castillo et al. Sci Immunol. .

Abstract

Whereas the cellular and molecular features of human inflammatory skin diseases are well characterized, their tissue context and systemic impact remain poorly understood. We thus profiled human psoriasis (PsO) as a prototypic immune-mediated condition with a high predilection for extracutaneous involvement. Spatial transcriptomics (ST) analyses of 25 healthy, active lesion, and clinically uninvolved skin biopsies and integration with public single-cell transcriptomics data revealed marked differences in immune microniches between healthy and inflamed skin. Tissue-scale cartography further identified core disease features across all active lesions, including the emergence of an inflamed suprabasal epidermal state and the presence of B lymphocytes in lesional skin. Both lesional and distal nonlesional samples were stratified by skin disease severity and not by the presence of systemic disease. This segregation was driven by macrophage-, fibroblast-, and lymphatic-enriched spatial regions with gene signatures associated with metabolic dysfunction. Together, these findings suggest that mild and severe forms of PsO have distinct molecular features and that severe PsO may profoundly alter the cellular and metabolic composition of distal unaffected skin sites. In addition, our study provides a valuable resource for the research community to study spatial gene organization of healthy and inflamed human skin.


Figures
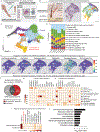
Figure 1.
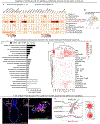
Figure 1.. Spatial transcriptomics analysis of healthy human skin.
(A) Schematic of spatial transcriptomics study workflow. Table S1 contains metadata for each sample. (B) Schematic of skin, representative hematoxylin-eosin (H&E) image and corresponding ST plot (left-to-right). Scale bar = 440μm (C) UMAP visualization of 3,815 spots colored by cluster obtained from healthy skin samples (N=3, n=5). (D) Composition plots displaying relative abundance of each cluster by sample. Note up to two samples (labeled S) were collected from each Healthy Volunteer (HV). Replicate arrays are labeled “R” along the X axis. (E) Integration with a publicly-sourced single cell RNA-seq data set (dataset 1) with a representative ST spatial feature plot. See Figure S4 for UMAP of annotated cell type clusters. SMC=smooth muscle cell. Scale bar = 520μm (F) Multimodal intersection analysis (MIA) of overlap between data from datasets 1 and 2 and our ST-generated clusters. A sample hypergeometric distribution of keratinocyte cluster from dataset 1 and our epidermis cluster (cluster 6). MIA enrichment heatmaps of non-immune cell types in dataset 1 (G) and dataset 2 (H) and ST clusters from healthy skin. The X axis denotes the scRNA seq-identified cell types while the Y axis represents the ST-generated clusters. Differentiated keratinocytes (Diff KC) lymphatic endothelium (LE), proliferating keratinocytes (Prolif KC), vascular endothelium (VE), keratinocyte (KC). (I) MIA heatmap showing the enrichment of scRNA-seq-identified adipose- cell types from Hildreth et al. within pooled healthy skin ST clusters. (J) KEGG pathway analysis of the adipose cluster (cluster 2).
Figure 2.
Figure 2.. Immune cells are enriched in hair follicle and endothelial niches in healthy skin.
MIA enrichment heatmaps of immune cell types from integrated scRNA-seq dataset 1 (A) and dataset 2 (B). The X axis denotes the scRNA seq-identified immune cell types while the Y axis represents the ST-generated clusters. dendritic cell (DC), macrophage (macro), monocyte-derived dendritic cell (moDC), migratory dendritic cell (migDC), monocyte (mono), Inflammatory monocyte (inf. Mono), innate lymphoid cell (ILC), natural killer cell (NK cell), cytotoxic CD8+ T cell (Tc), CD4+ T helper cell (Th), regulatory T cell (Treg). (C) Representative spatial plot highlighting location of clusters 5 and 9 in healthy skin. (D) Kyoto Encyclopedia of Genes and Genomes (KEGG), Gene Ontology – Biological Processes (GO-BP), GO-cellular component (GO-CC) pathway analyses of differentially expressed genes in upper follicle and perifollicular cluster 5. (E) xCell clustered heatmap of immune cells in cluster 5. Map is scaled by cell type fraction of total cells in a given cluster. conventional dendritic cell (cDC), immature dendritic cell (iDC), hematopoietic stem cell (HSC), mesenchymal stem cell (MSC), dendritic cell (DC), natural killer T cell (NKT), activated dendritic cell (aDC), effector memory T cell (Tem), lymphatic (ly), microvascular (mv). (F) Representative image illustrating the perifollicular and perivascular localization of CD4+ (magenta), CD8+ (red), HLA-DR+ (yellow), and FOXP3+ (cyan) immune cells clusters. DAPI nuclei (blue). Hair follicle and CD31+ (white) blood vessel demarcated by white dashed line. Scale bar = 200μm (left), Scale bar = 50μm (right) . (G) Schematic of immune cell activity in healthy skin around the hair follicle and vasculature.
Figure 3.
Figure 3.. ST analyses of psoriatic (PsO) lesional and non lesional skin.
(A) Representative histological image (left) and corresponding ST plots following Harmony batch correction (right) of lesional PsO and non-lesional skin samples. Scale bar = 440μm (B) UMAP visualization of 16,424 spots obtained from combined psoriatic lesional (n=14) and non lesional (n=9), and healthy (n=5) skin samples. Dashed lines around clusters discern region specific clusters. (C) Composition plots indicating the relative abundance of each cluster in healthy volunteer (HV), lesional (L), non-lesional (NL) samples. Asterix denotes significantly expanded clusters (p≤0.05, see D for absolute p values) (D) Box plots depicting frequency of PsO-enriched clusters 4, 7, and 10 in different sample groups. Each black dot represents an individual biopsy sample. P values computed using Wilcoxon rank sum test. (E) Linear regression plots of clusters 4, 7, and 10 percent composition in PsO lesional samples (y-axis) and corresponding sample Psoriasis Area and Severity Index score (x-axis). Each dot represents an individual biopsy sample. n= number of skin sections analysed.
Figure 4.
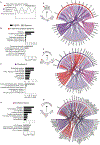
Figure 4.. Pathways and ligand receptor interactions in psoriasis-enriched clusters.
(A) Schematic illustrating spatial locations of psoriasis-enriched (4,7,10) and adjacent cluster (3). (B-D) KEGG and Elsevier pathways analyses of clusters 4, 7, and 10, respectively. (E-G) Circle plots of NicheNet-predicted ligand-receptors interactions in clusters 4, 7, and 10 and ligands in cluster 3. Arrow point from putative ligand/sender to receptor/receiver clusters are denoted on the left of each circle plot. For total Niche-net output see data file S1.
Figure 5.
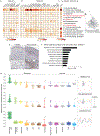
Figure 5.. Psoriatic and healthy skin have distinct immune-fibro cellular neighborhoods.
MIA enrichment heatmaps of psoriatic skin immune cells in dataset 1 (A), dataset 2 (B), and skin T resident memory cell (TRM) signatures from Jaiswal et al (C) with ST-delineated clusters from figure 3. Langerhans cell (LF), dendritic cell (DC), macrophage (macro), monocyte-derived dendritic cell (moDC), migratory dendritic cell (migDC), monocyte (mono), inflammatory monocyte (inf.mono), innate lymphoid cell (ILC), natural killer cell (NK), cytotoxic CD8+ T cell (Tc), CD4+ T helper cell (Th), regulatory T cell (Treg), mast cell (mast), tissue-resident memory T cells (TRM). (D) Spatial plot highlighting location of immune-enriched clusters 1 and 13 in lesional skin. (E) Representative immunohistochemistry images of CD20+ cells PsO lesional skin and healthy skin. Scale bar = 100μm. (F) Significantly enriched pathways in B cells from sc-RNAseq dataset 1. (G) SpaceFold one-dimension projection (left) and summary schematic (right) of cell distribution from dataset 1 on aggregated ST healthy (N=3, n=5), lesional (N=11, n=14) and non lesional samples (N=9, n=9). Y-axis represents tissue position, starting with the lower dermis demarked as position 0 to suprabasal epidermis marked as position 1. Arrows highlight cell types whose relative coordinate is different between healthy and diseased samples. Dashed line represents epidermal-dermal junction, discerned by cell types in the basal epidermal layer (melanocytes and Langerhans cells). Interfollicular epidermis (IFE), Hair follicle and infundibulum (HF/IFN), Vascular Smooth Muscle Cell (VSMC), Lymphatic endothelial cells (LECs), Vascular endothelial cells (VEC). N= number of individuals biopsied, n= number of skin sections analyzed.
Figure 6.
Figure 6.. Psoriasis (PsO) and psoriatic arthritis (PsA) lesional and non-lesional samples stratify by cutaneous disease severity, not by presence or absence of joint disease.
(A) Heatmap with dendrogram showing hierarchical clustering of pseudo-bulked ST samples. Samples have been demarked by presence (PsA) or absence (PsO) of systemic disease and cutaneous disease severity (Psoriasis Area and Severity Index (PASI)). PCA plots of lesional (L) and non-lesional (NL) samples colored by presence or absence of arthritis (B) and by severity (PASI) of cutaneous disease (C). Each spot on the PCA plot represents an individual replicate.
Figure 7.
Figure 7.. Disease severity stratifies by emergent cellular ecosystems in the upper dermis.
SpaceFold one dimensional projection of cell distribution based on cell types from dataset 1 on aggregated ST lesional and non lesional samples from mild (PASIlow) (A) and moderate-severe (PASIhigh) samples (B). Y axis represents tissue position, starting with the lower dermis demarked as position 0 to suprabasal epidermis marked as position 1. Arrows highlight cell types whose position is changed between healthy and diseased samples. Dashed line represents epidermal-dermal junction, discerned by cell types in the basal epidermal layer (melanocytes and Langerhans cells). Interfollicular epidermis (IFE), Hair follicle and infundibulum (HF/IFN),Vascular Smooth Muscle Cell (VSMC), Lymphatic endothelial cells (LECs), Vascular endothelial cells (VEC). n= number of skin sections analyzed.
Figure 8.
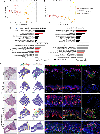
Figure 8.. Macrophage, fibroblast, and lymphatic endothelium-associated spatial clusters distinguish mild and moderate-severe disease endotypes.
Post pseudo-bulking PCA of lesional and non-lesional samples colored by disease severity in spatial clusters 1 (A) and 12 (B). KEGG and Elsevier Pathway analyses of clusters 1 (C) and 12 (D) genes. (E) Representative histological images and corresponding spatial gene expression plots of selected differentially expressed genes (∣log2(FC)∣ ≥ 1.5 and FDR <0.05) in healthy, lesional, and non-lesional samples. Red arrows point to areas of enriched gene expression. Fibroblast growth factor receptor 3 (FGFR3), diacylglycerol O-acyltransferase 2 (DGAT2). Scale bar = 470μm (F) Representative non-lesional moderate-severe skin exhibits robust expression of FGFR3 throughout the epidermis (green, left) and DGAT2 in the epidermis (green, center) and adnexal glands (green, right). Keratin (KRT) 5 (red), DAPI nuclei (blue). Scale bar = 100μm.

Similar articles

Cited by

References

    1. Kim J et al., The Spectrum of Mild to Severe Psoriasis Vulgaris Is Defined by a Common Activation of IL-17 Pathway Genes, but with Key Differences in Immune Regulatory Genes. Journal of Investigative Dermatology 136, 2173–2182 (2016). - PubMed
    1. Coates LC, FitzGerald O, Helliwell PS, Paul C, Psoriasis, psoriatic arthritis, and rheumatoid arthritis: Is all inflammation the same? Semin Arthritis Rheum 46, 291–304 (2016). - PubMed
    1. Husni ME, Merola JF, Davin S, The psychosocial burden of psoriatic arthritis. Seminars in Arthritis and Rheumatism 47, 351–360 (2017). - PubMed
    1. Love TJ, Qureshi AA, Karlson EW, Gelfand JM, Choi HK, Prevalence of the Metabolic Syndrome in Psoriasis: Results From the National Health and Nutrition Examination Survey, 2003-2006. Archives of Dermatology 147, 419–424 (2011). - PMC - PubMed
    1. Husted JA et al., Cardiovascular and other comorbidities in patients with psoriatic arthritis: a comparison with patients with psoriasis. Arthritis Care Res (Hoboken) 63, 1729–1735 (2011). - PubMed

Publication types