. 2023 Apr;24(4):664-675.
doi: 10.1038/s41590-023-01443-y. Epub 2023 Feb 27.

T cell egress via lymphatic vessels is tuned by antigen encounter and limits tumor control

Affiliations

T cell egress via lymphatic vessels is tuned by antigen encounter and limits tumor control

Maria M Steele et al. Nat Immunol. 2023 Apr.

Erratum in

Abstract

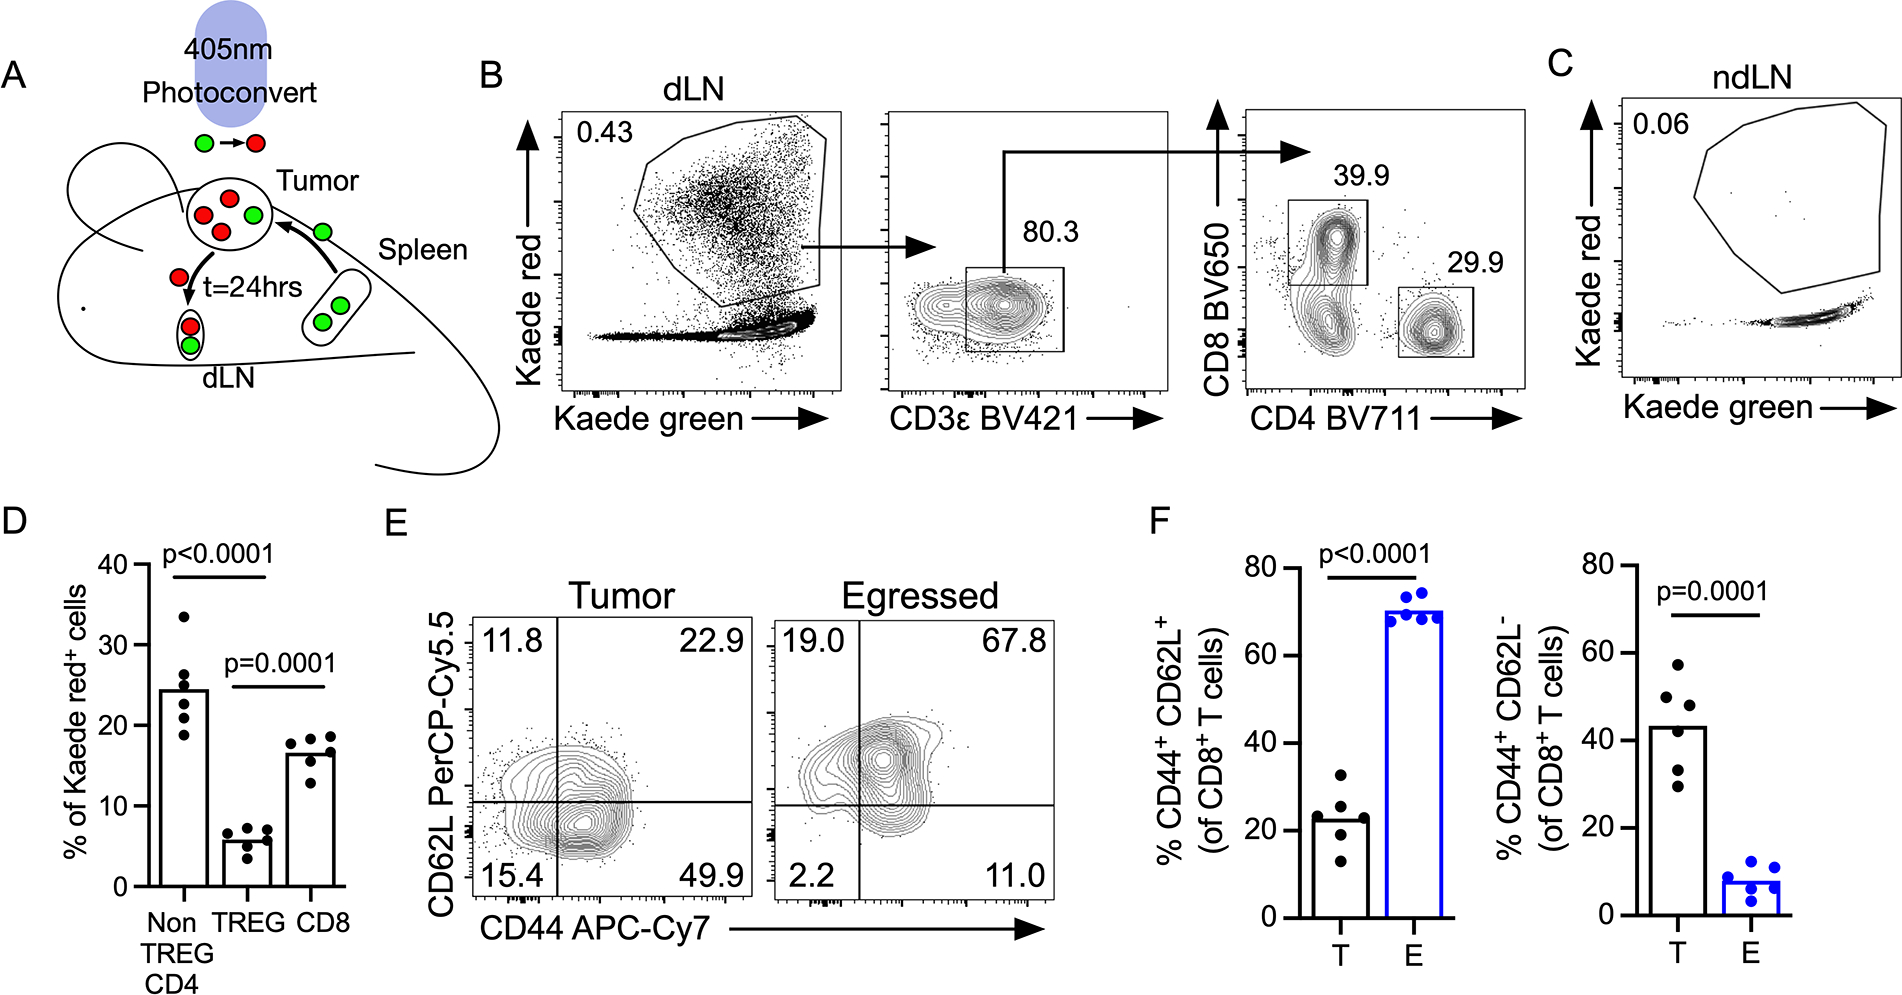
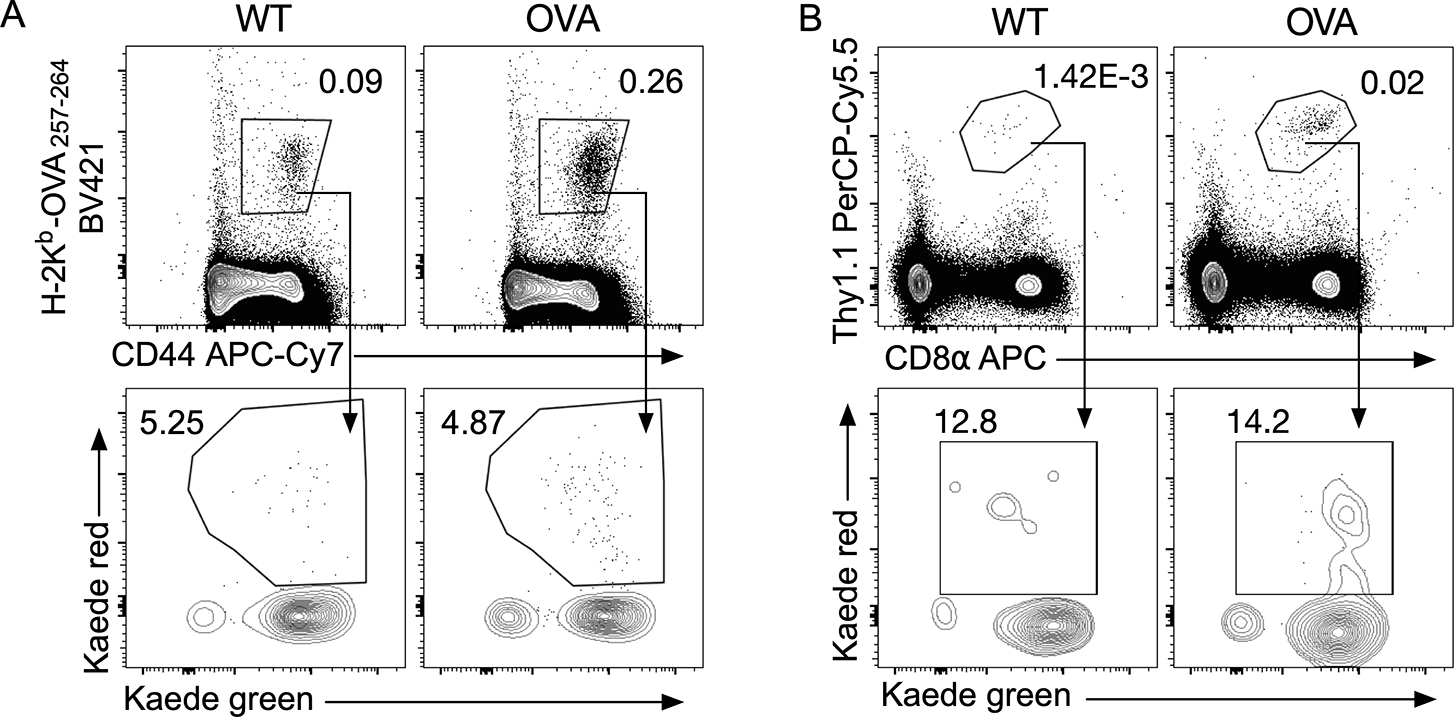
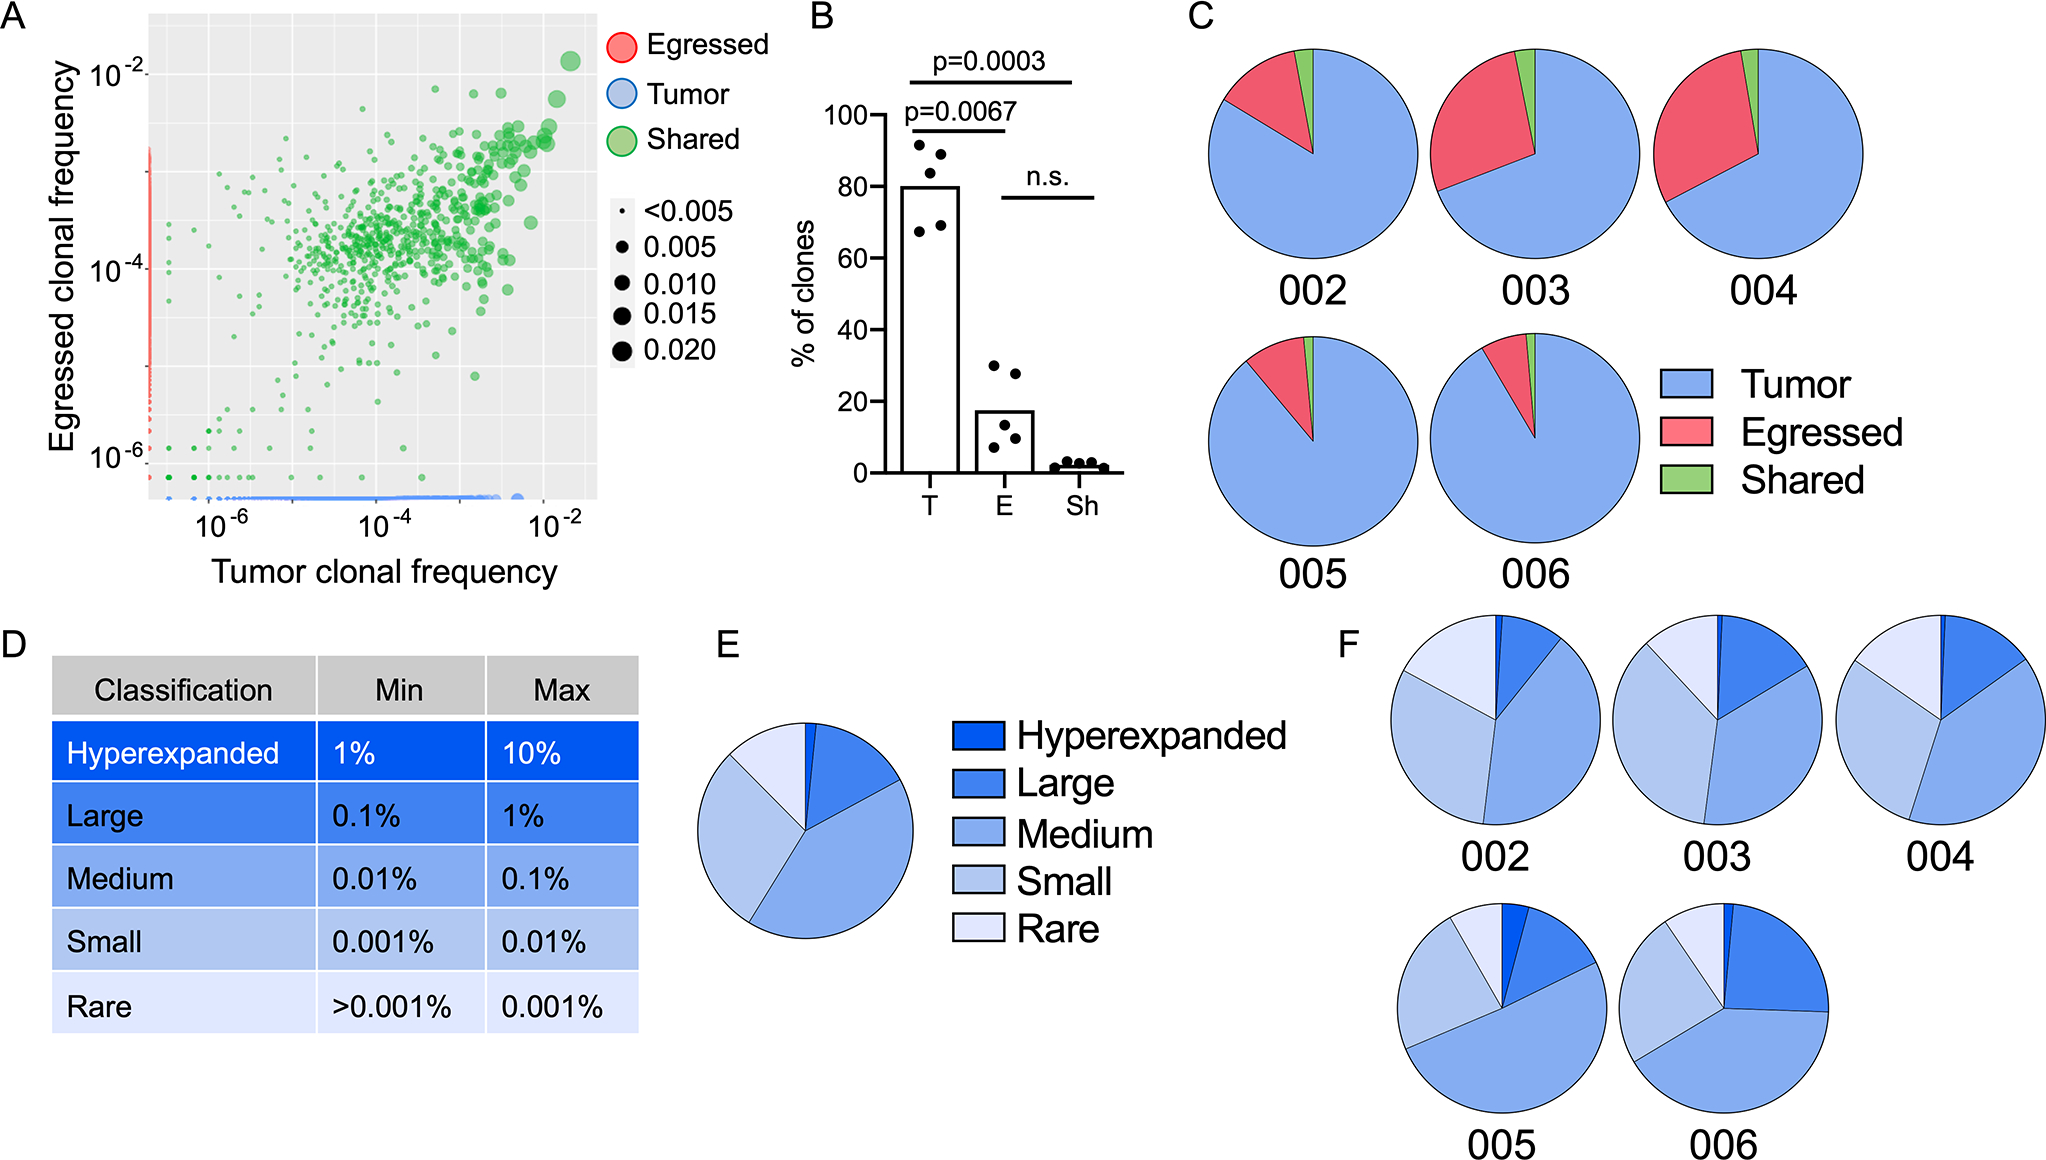
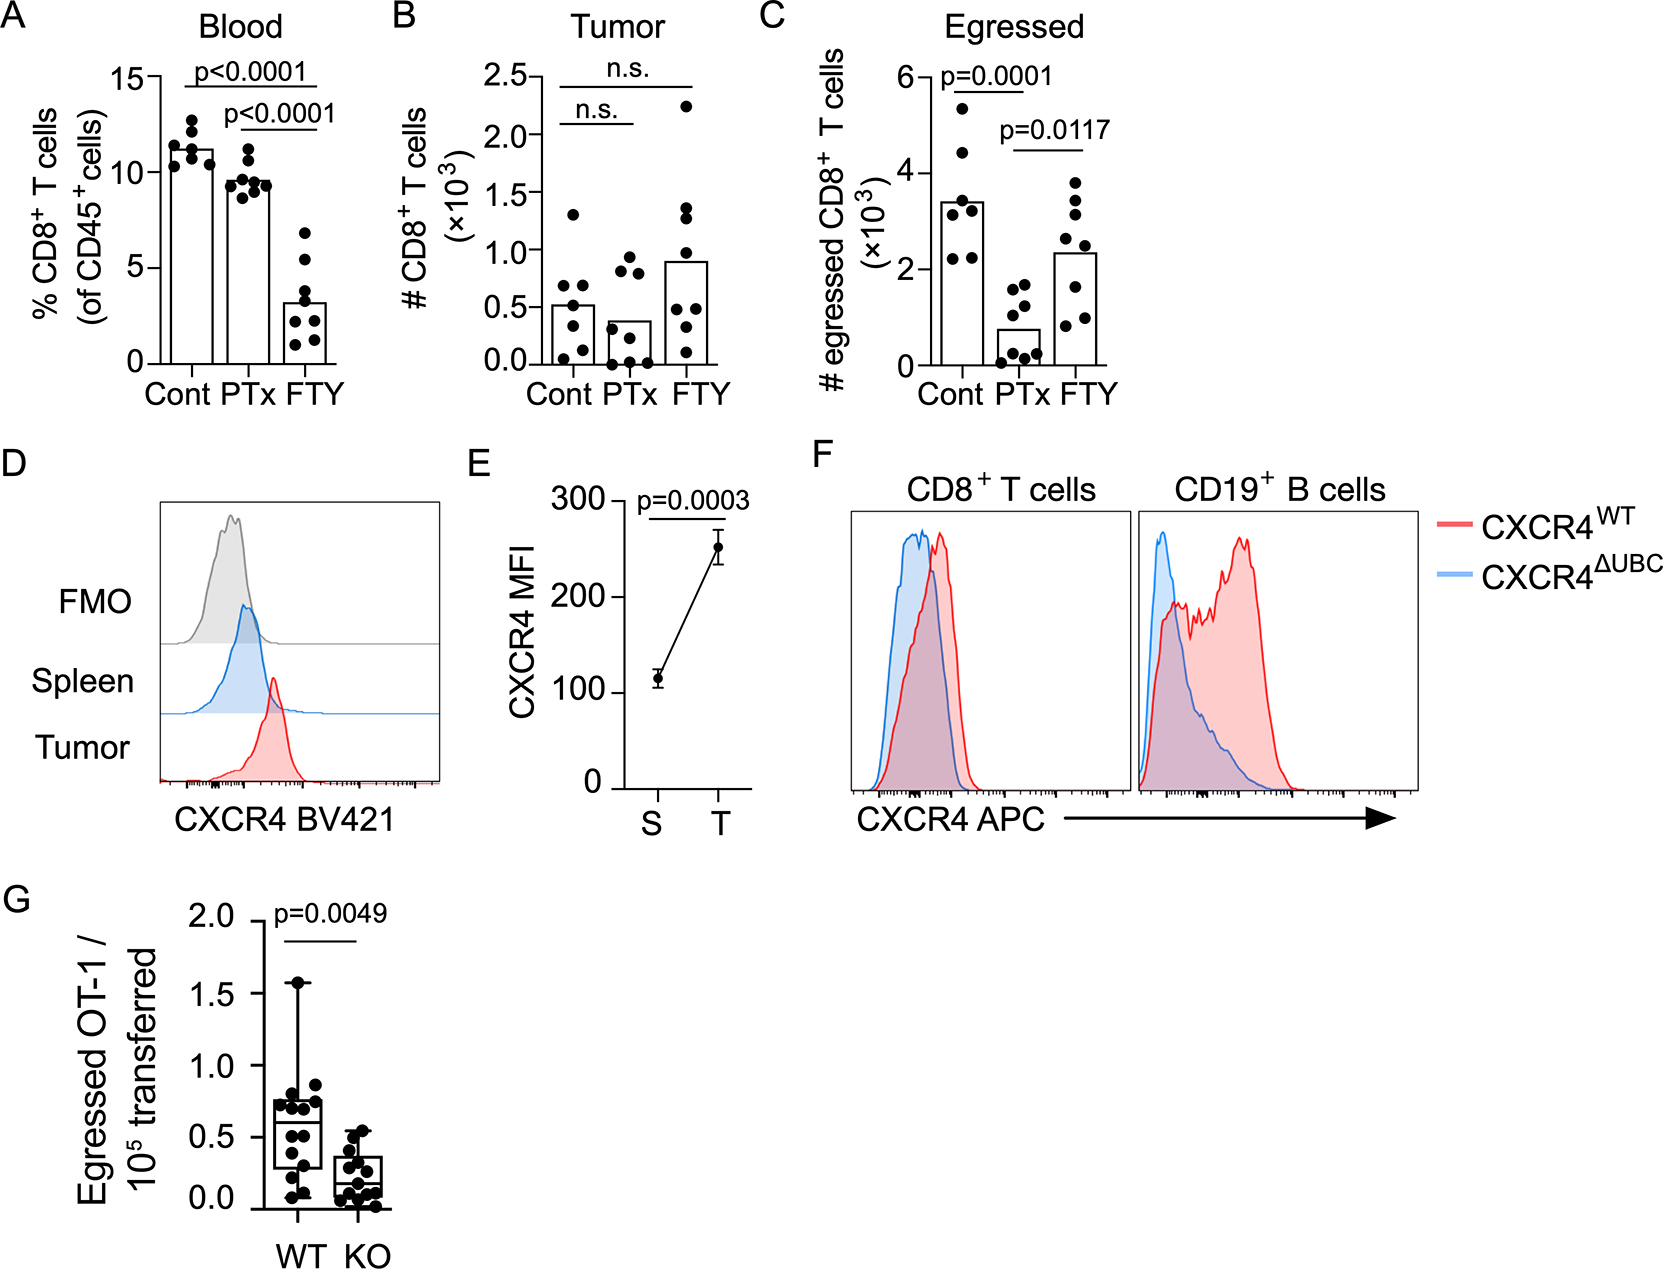
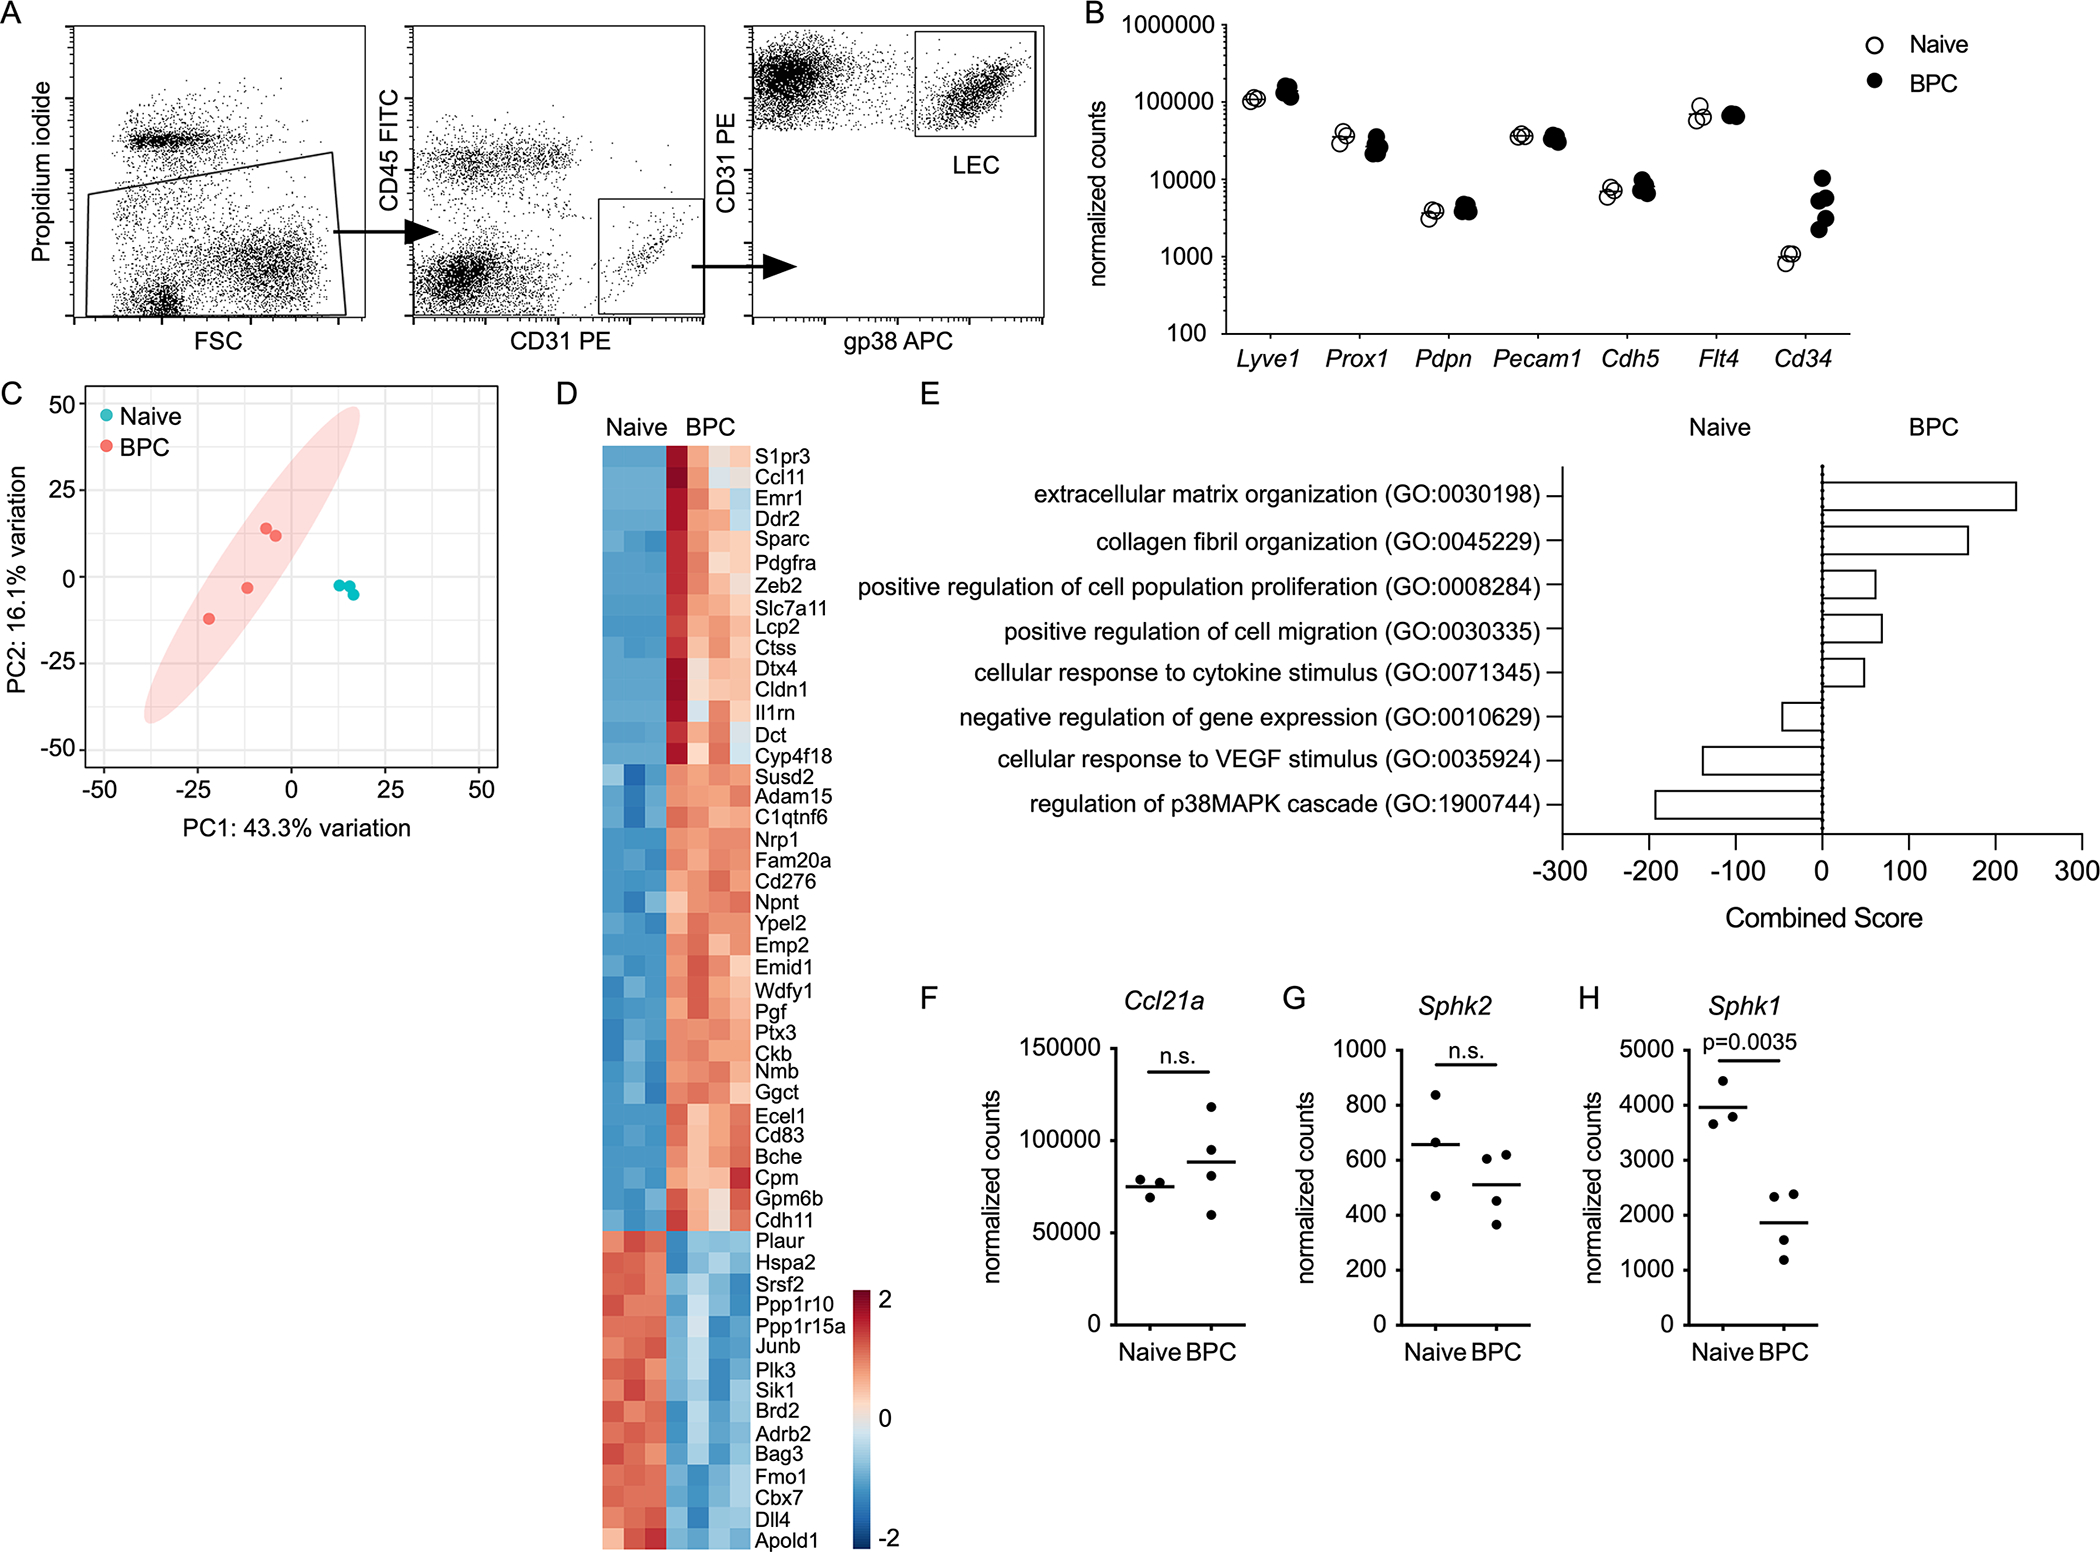
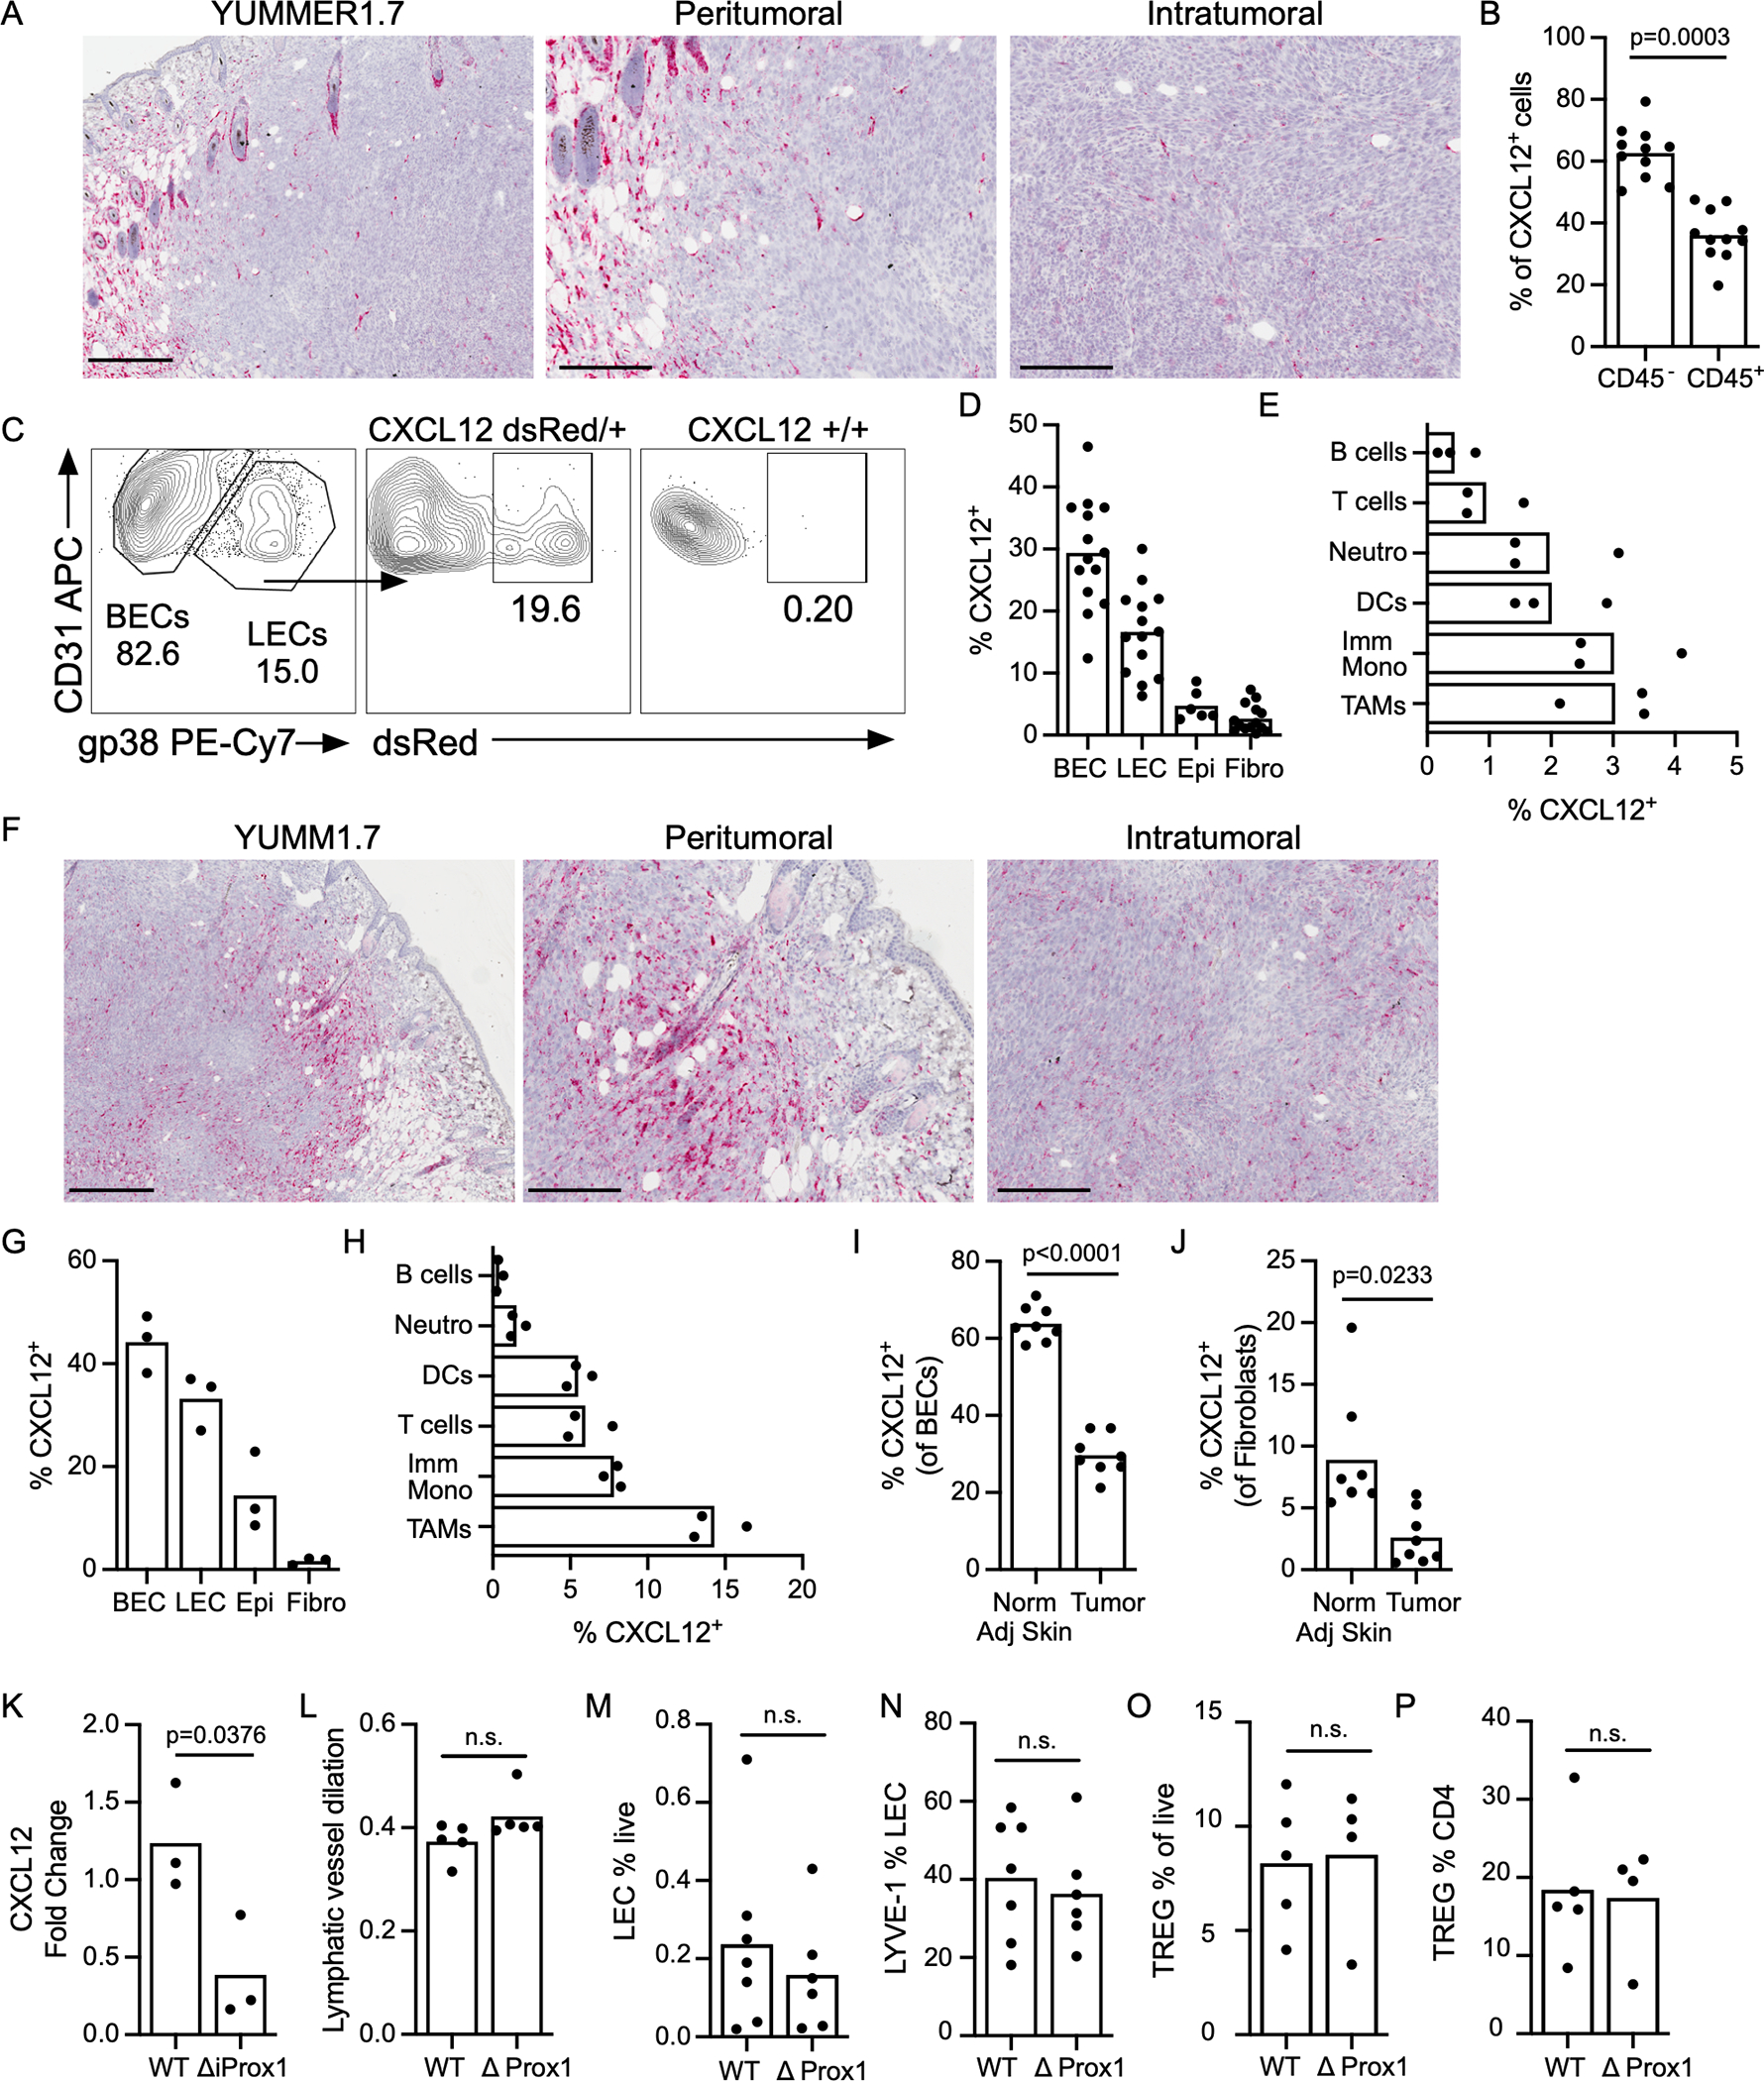
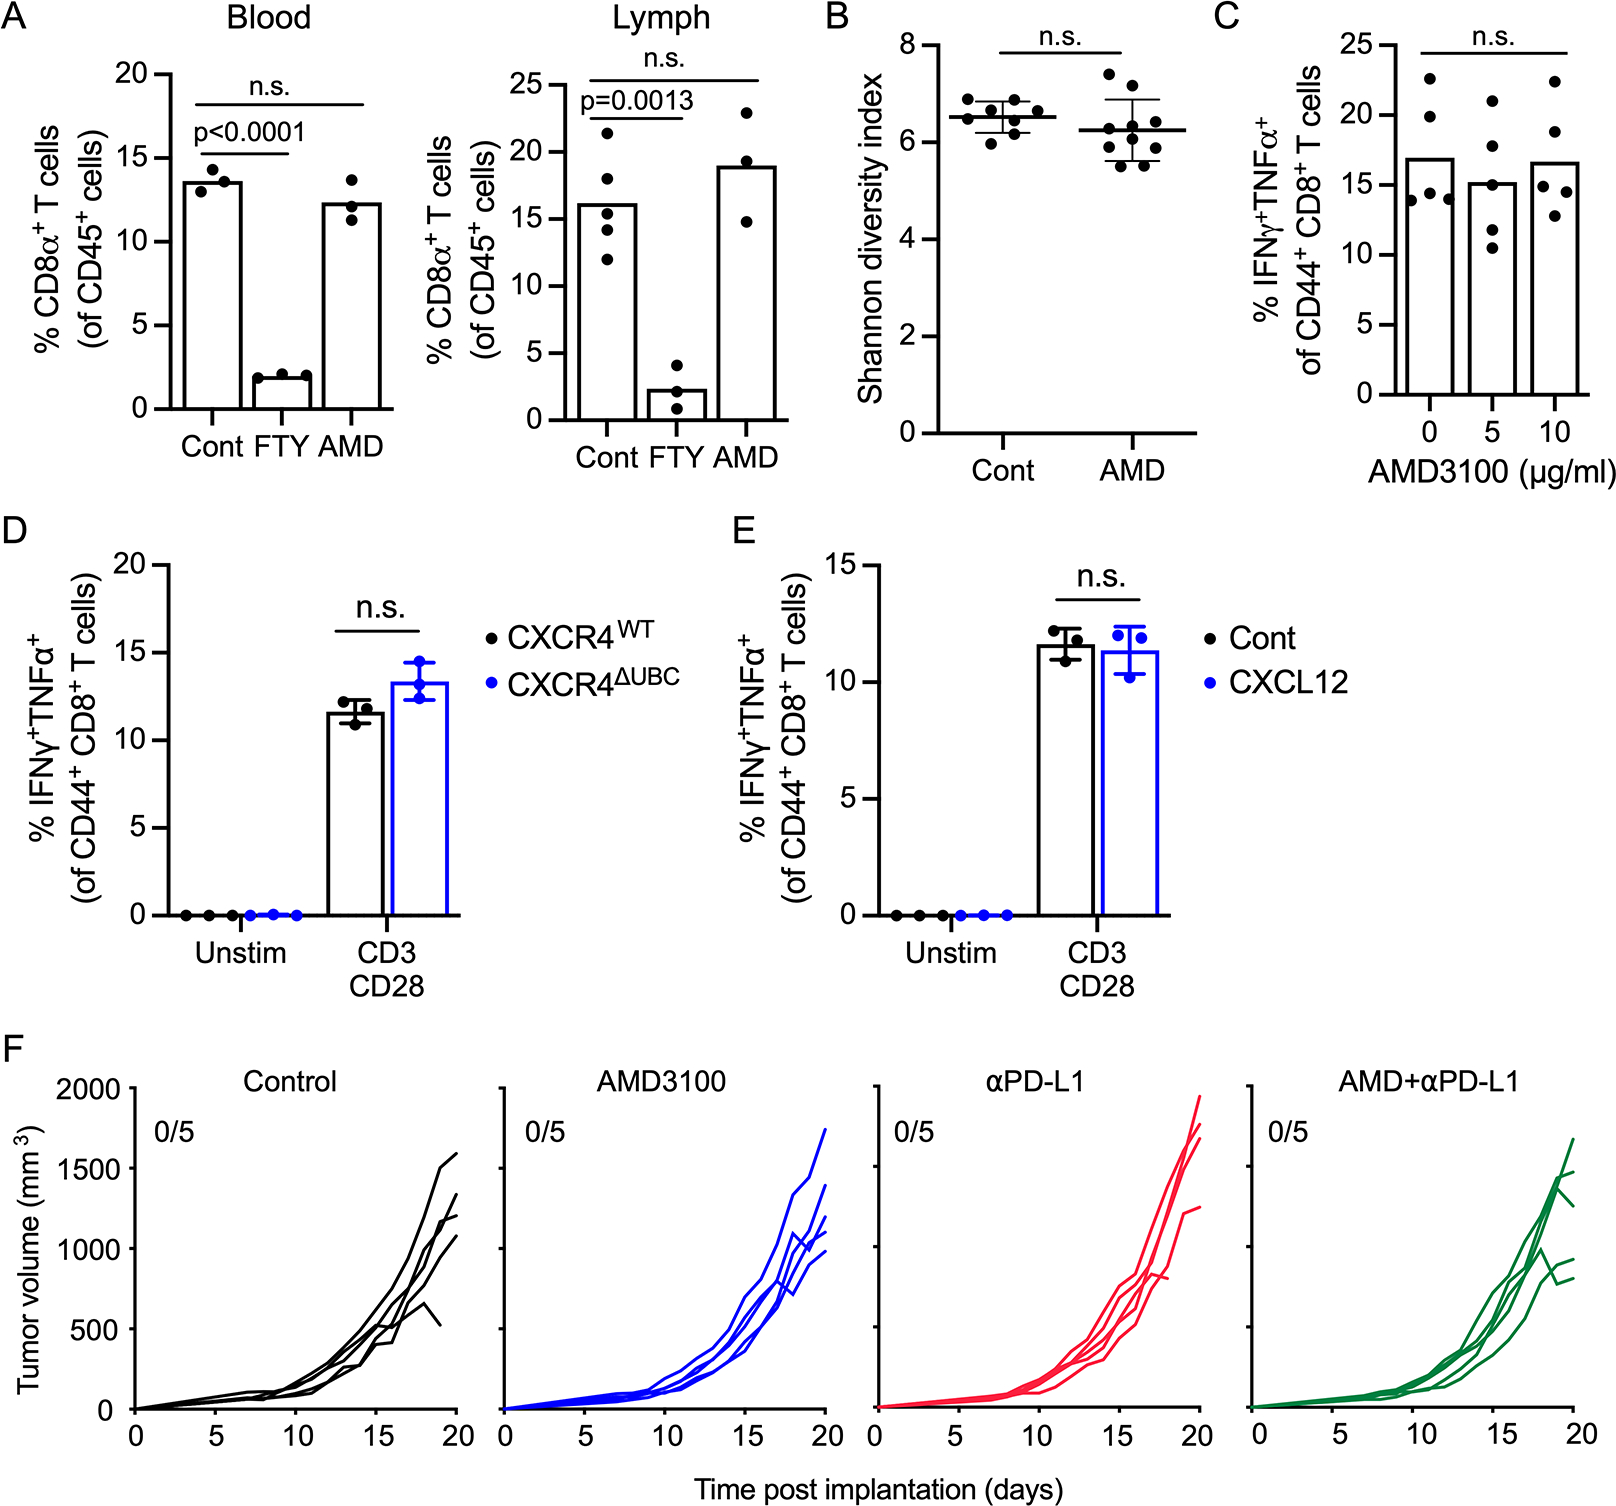
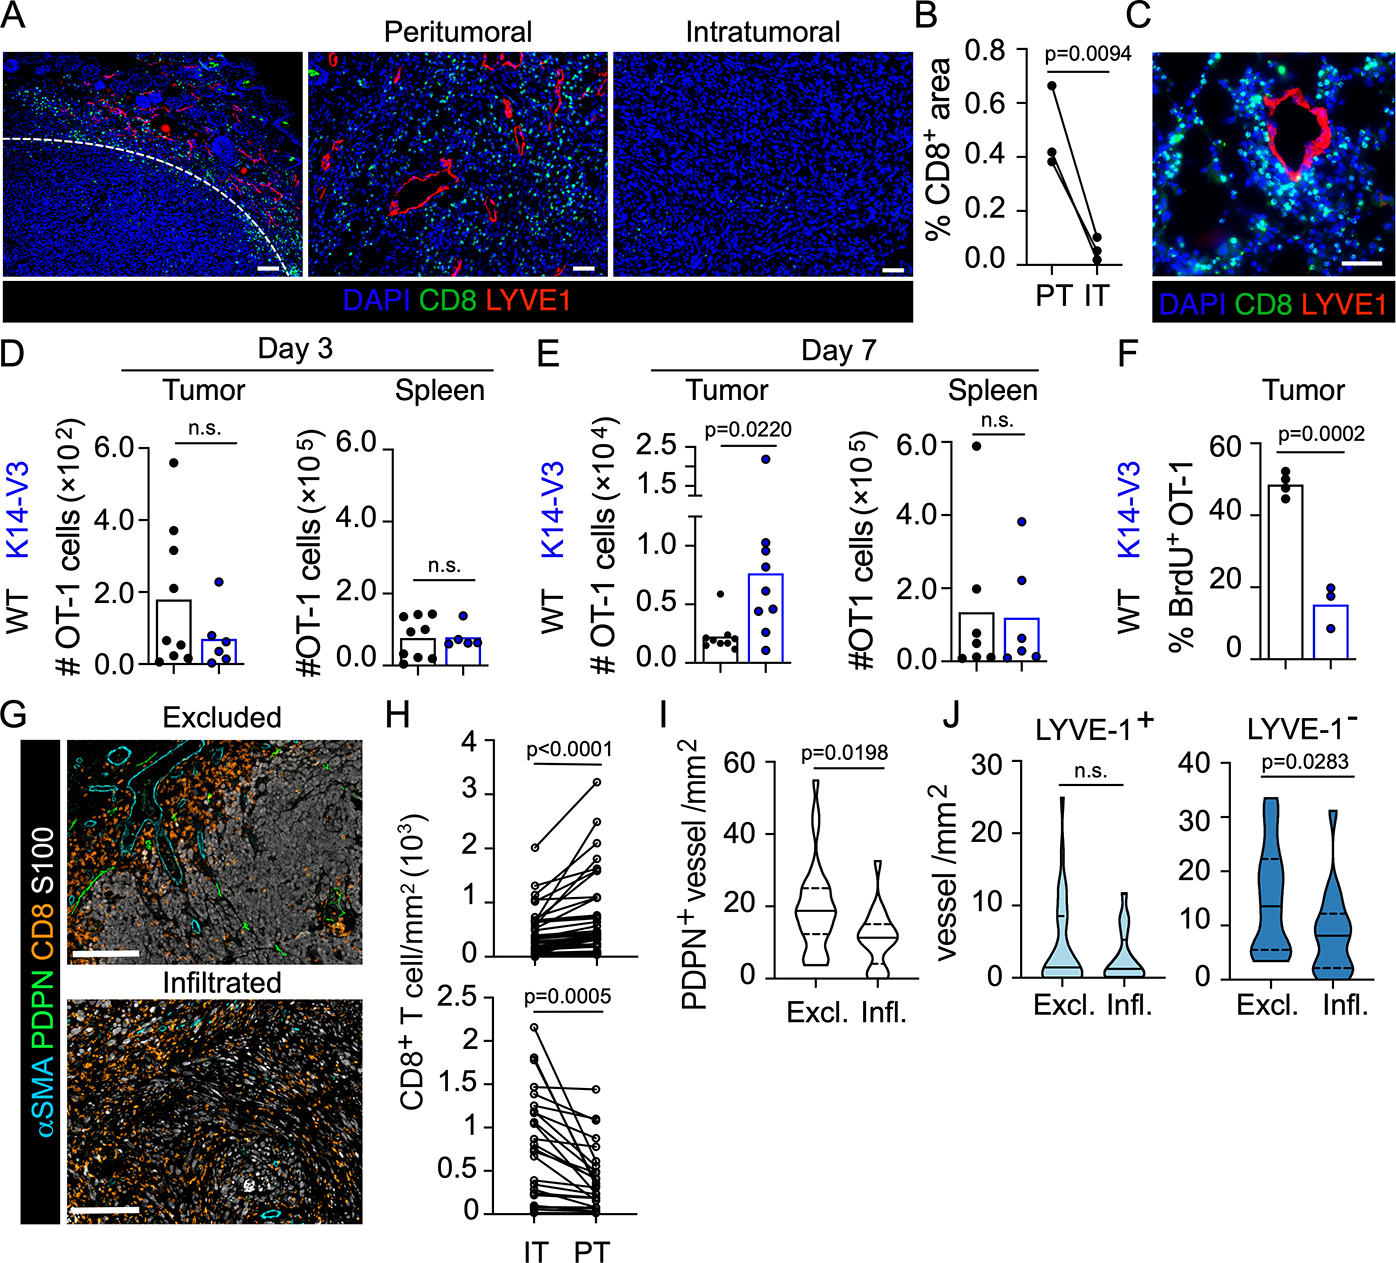
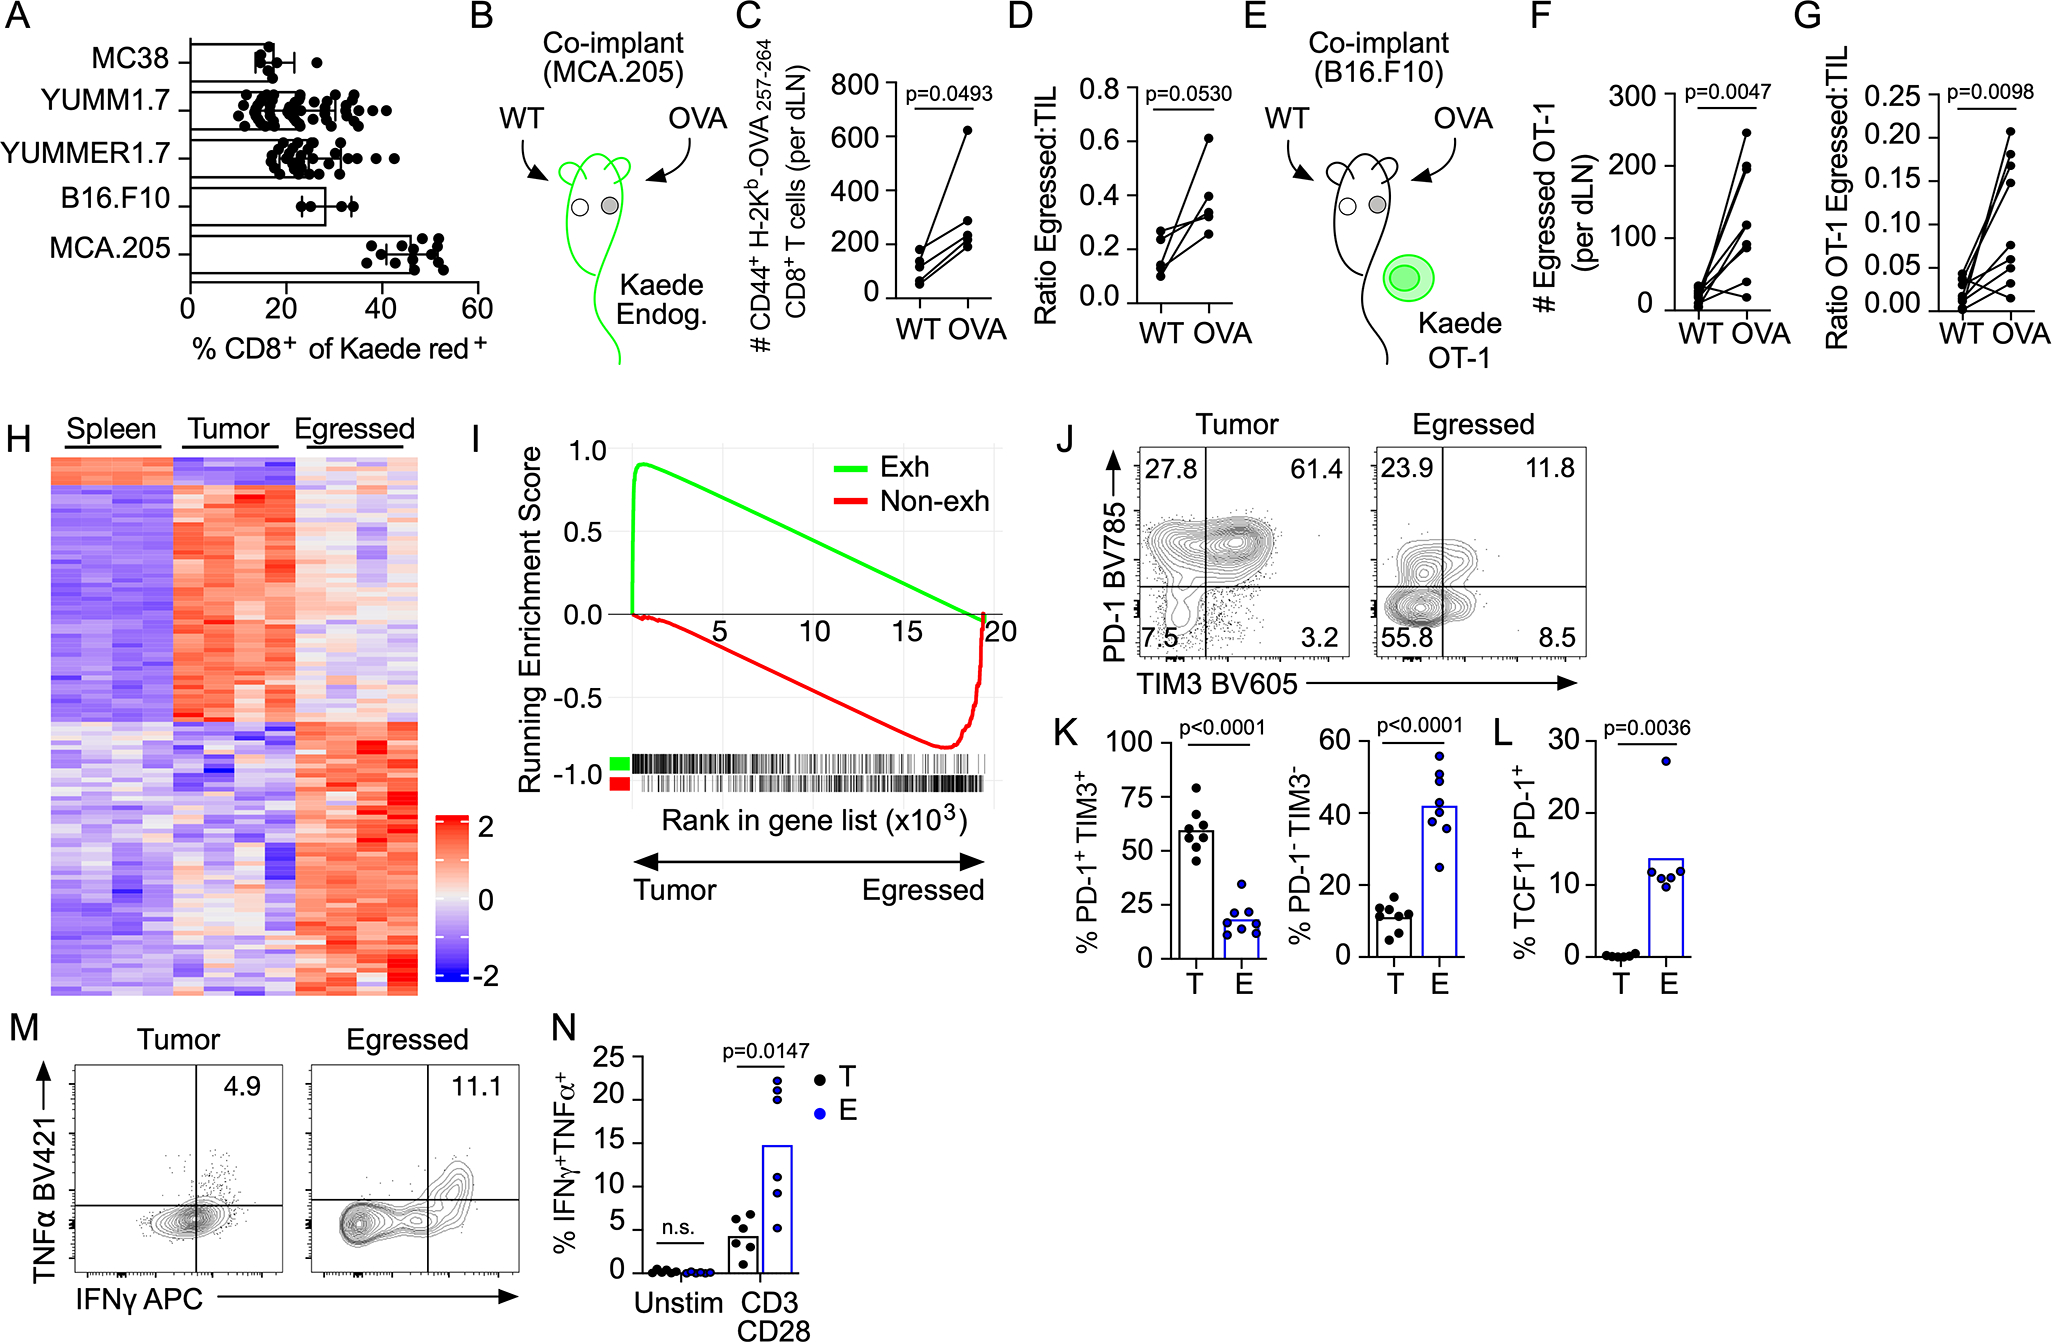
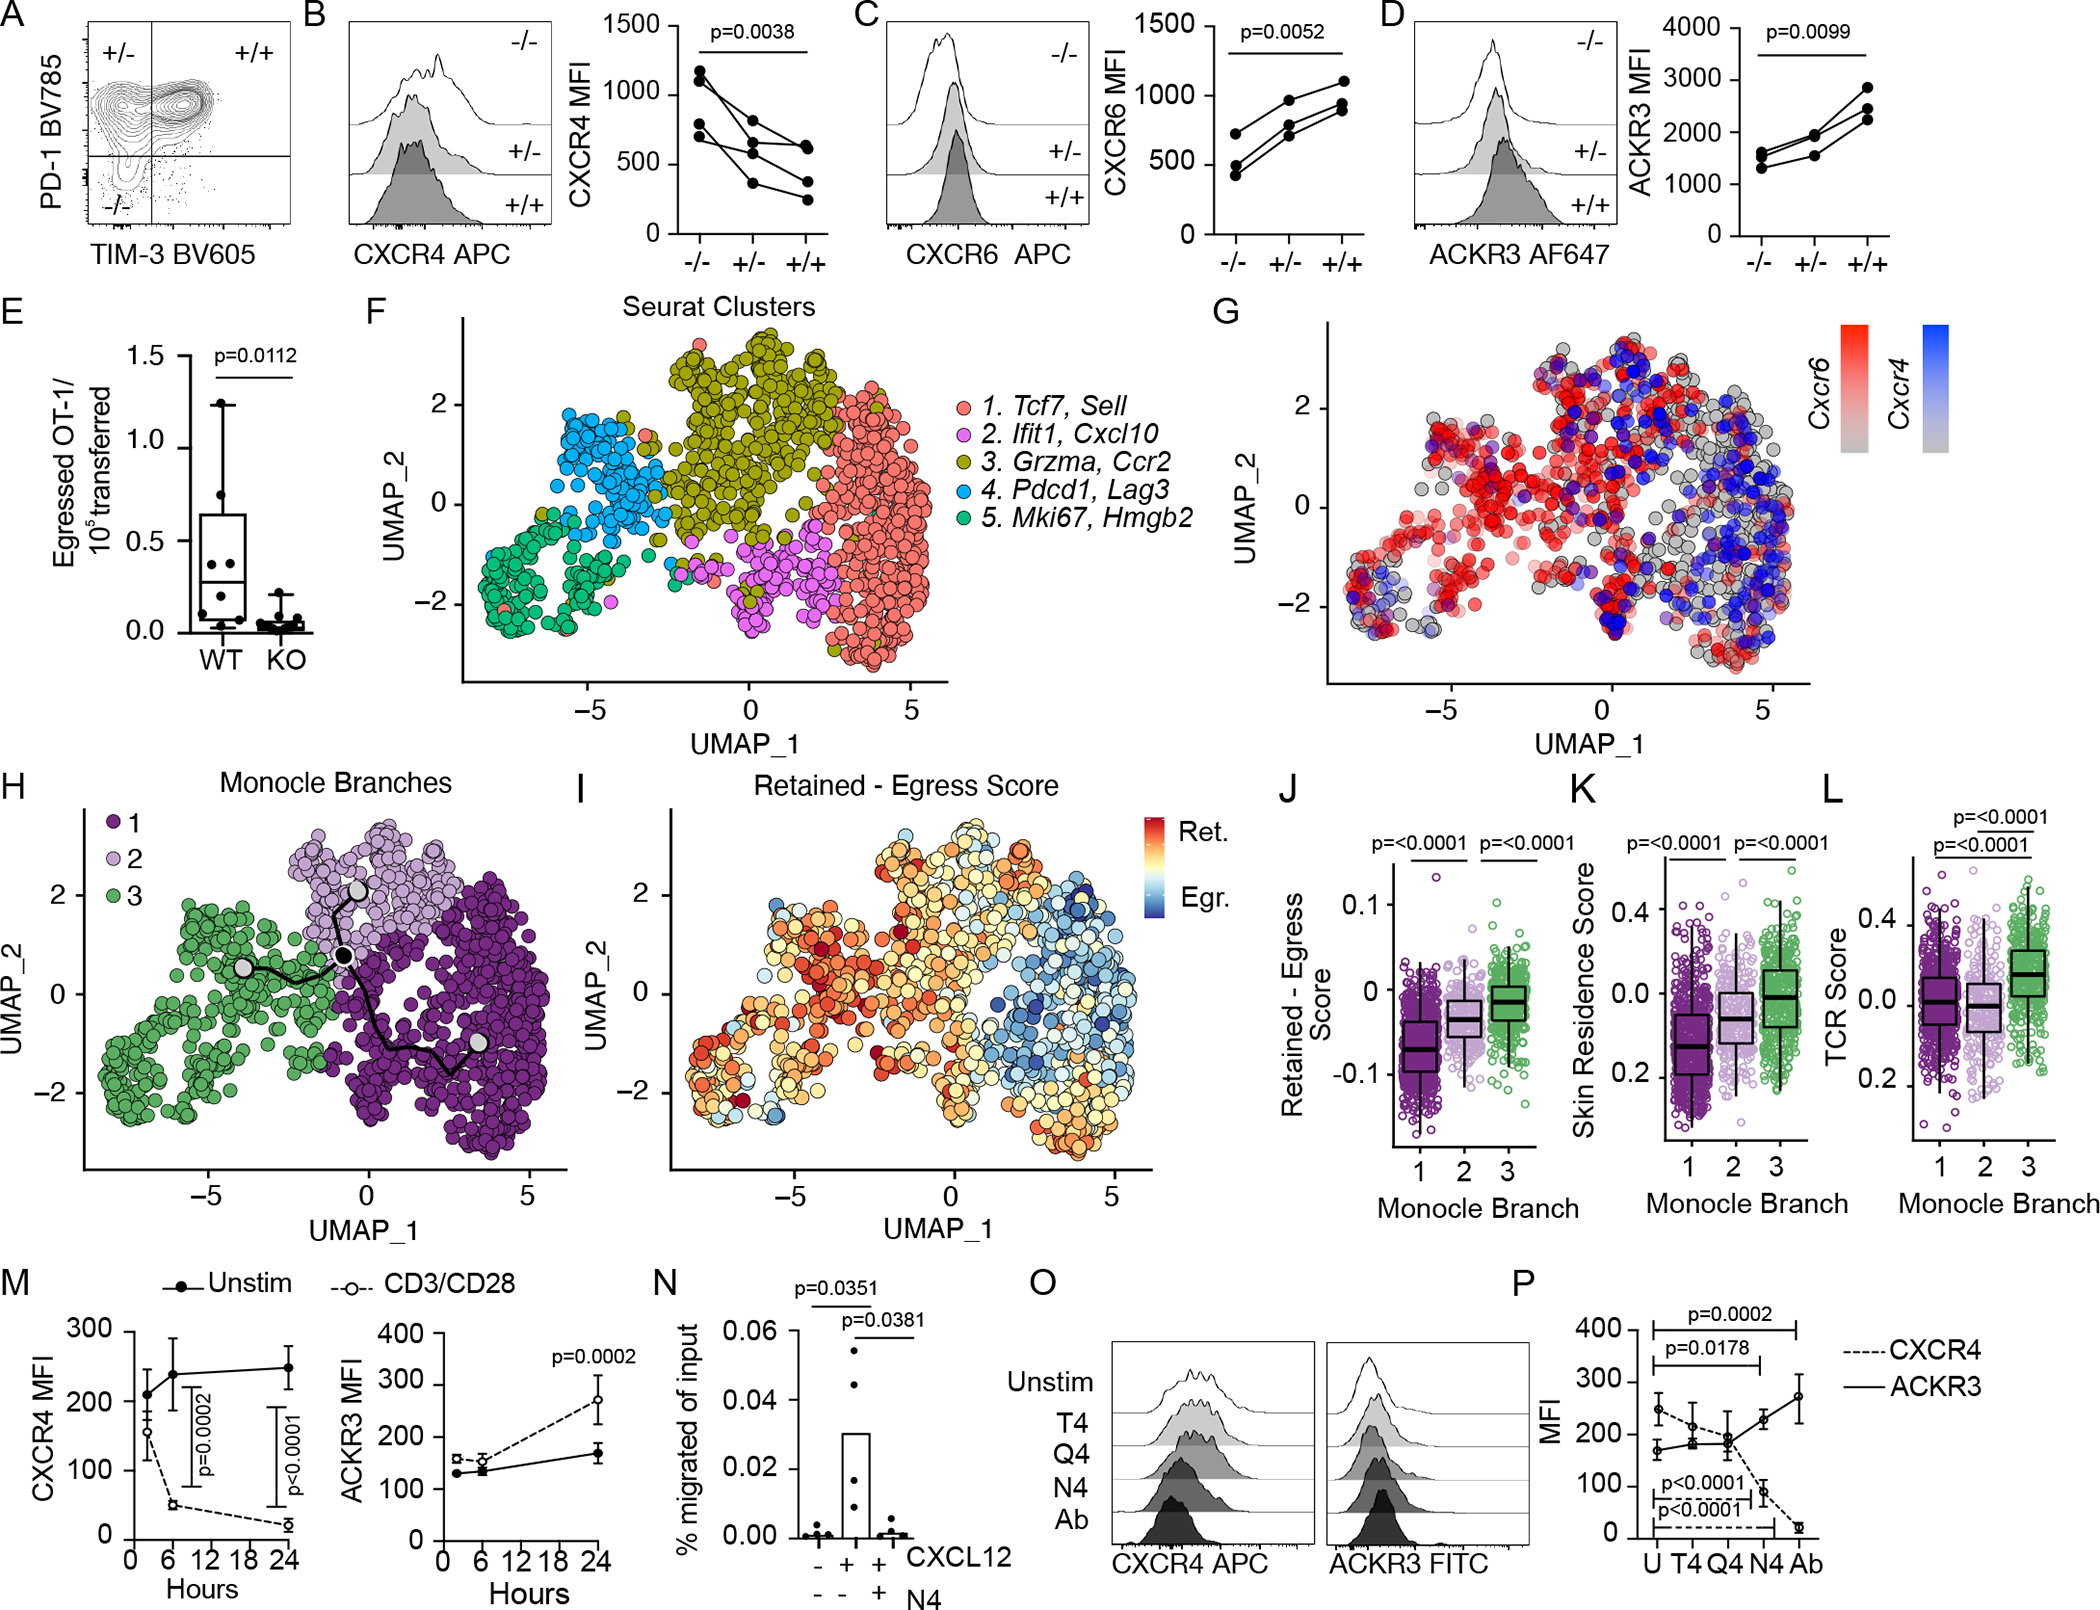
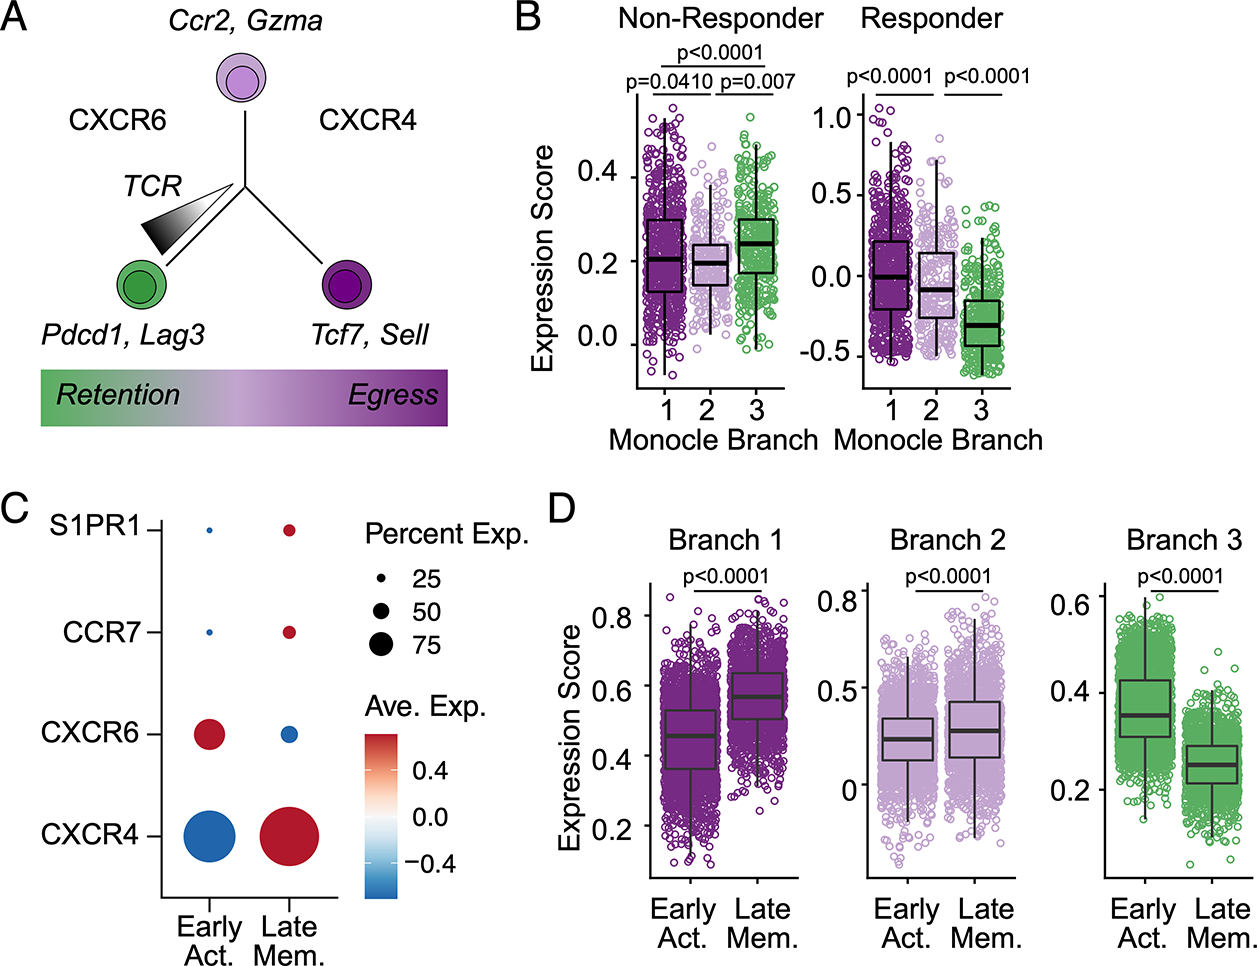
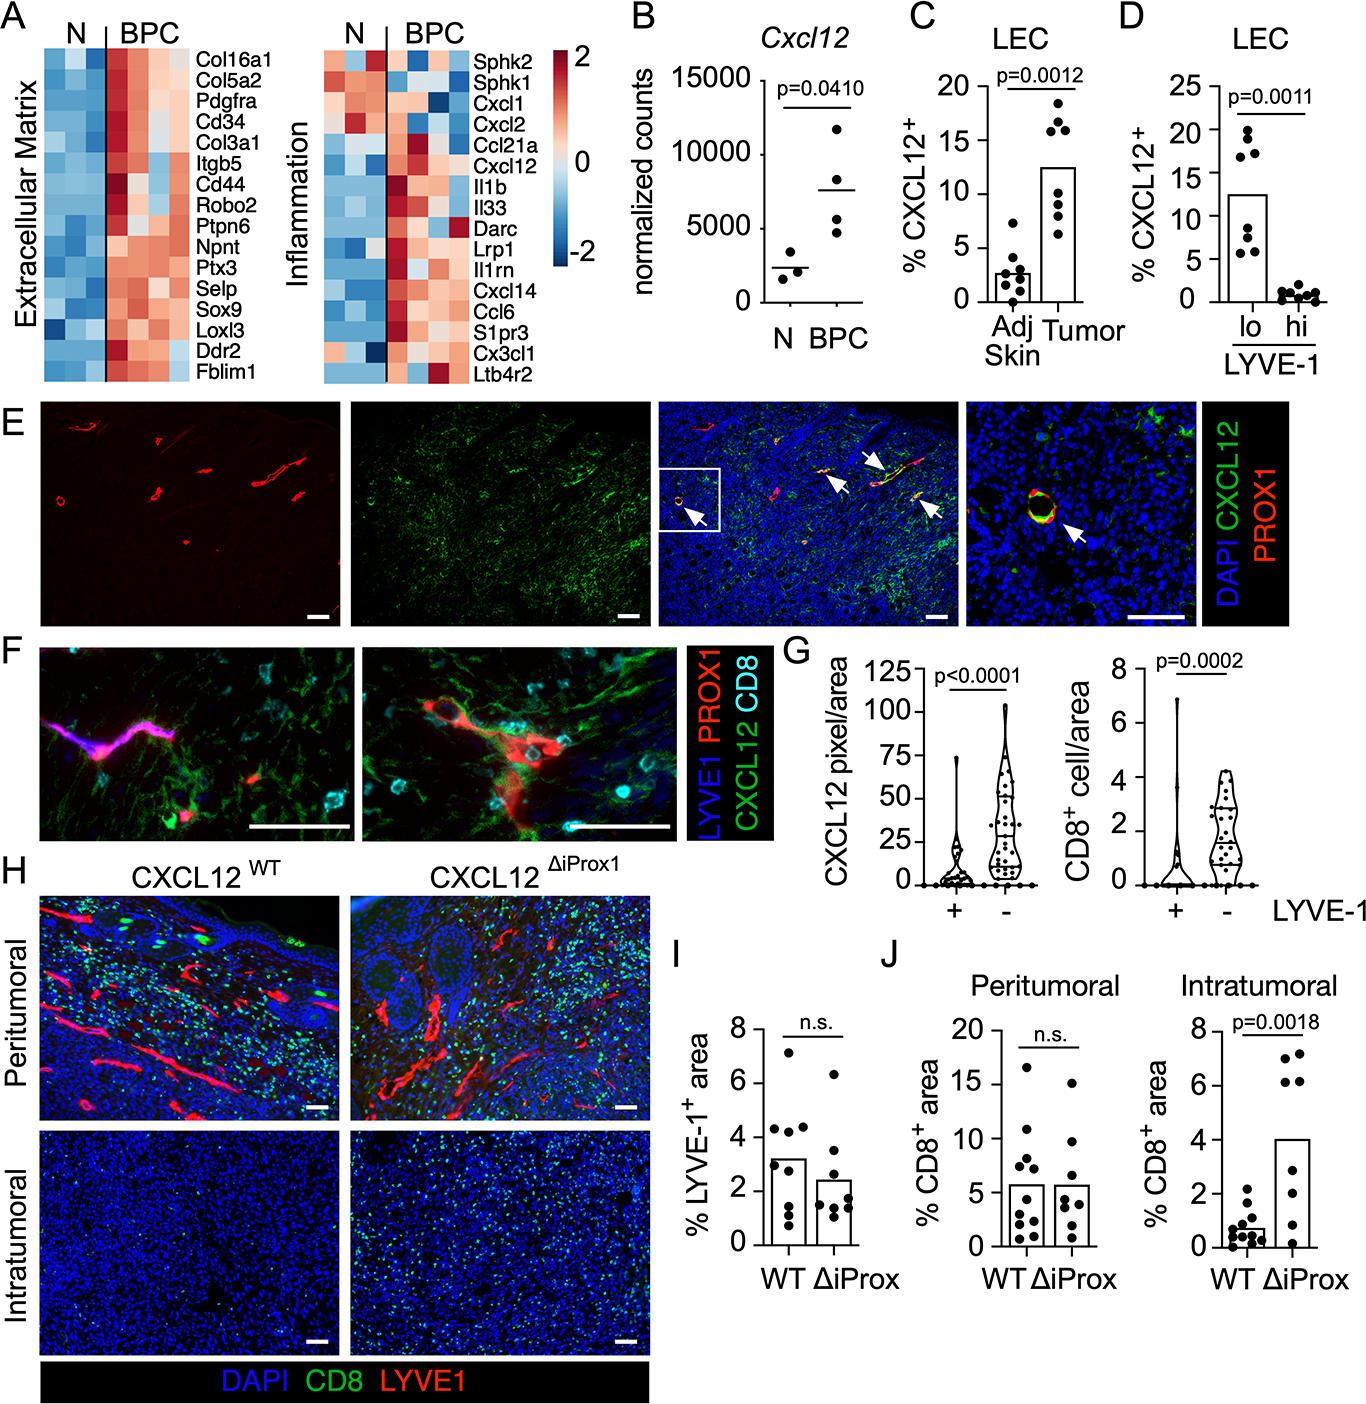
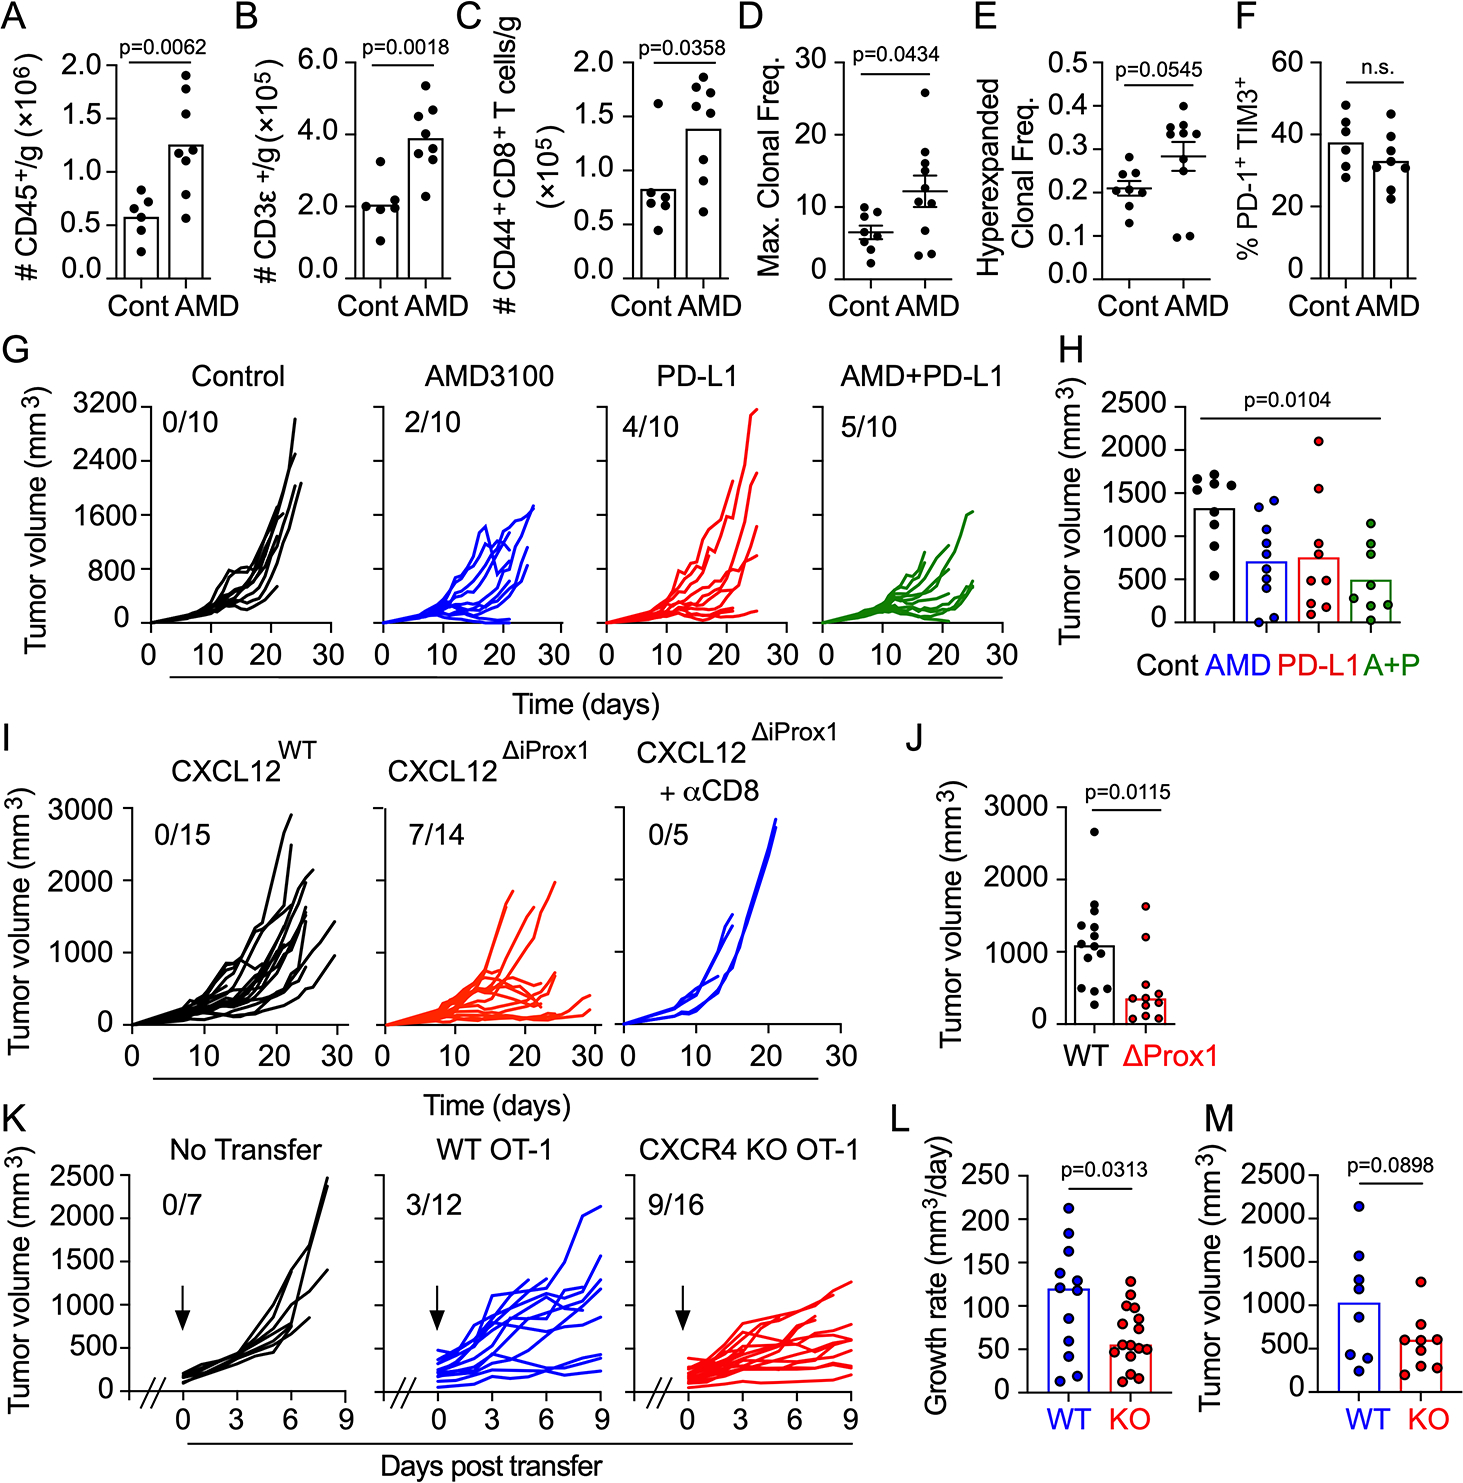
Antigen-specific CD8+ T cell accumulation in tumors is a prerequisite for effective immunotherapy, and yet the mechanisms of lymphocyte transit are not well defined. Here we show that tumor-associated lymphatic vessels control T cell exit from tumors via the chemokine CXCL12, and intratumoral antigen encounter tunes CXCR4 expression by effector CD8+ T cells. Only high-affinity antigen downregulates CXCR4 and upregulates the CXCL12 decoy receptor, ACKR3, thereby reducing CXCL12 sensitivity and promoting T cell retention. A diverse repertoire of functional tumor-specific CD8+ T cells, therefore, exit the tumor, which limits the pool of CD8+ T cells available to exert tumor control. CXCR4 inhibition or loss of lymphatic-specific CXCL12 boosts T cell retention and enhances tumor control. These data indicate that strategies to limit T cell egress might be an approach to boost the quantity and quality of intratumoral T cells and thereby response to immunotherapy.


Conflict of interest statement

Competing interests: A.W.L. reports consulting services for AGS Therapeutics. L.M. Coussens reports consulting services for Cell Signaling Technologies, AbbVie, the Susan G Komen Foundation, and Shasqi, received reagent and/or research support from Cell Signaling Technologies, Syndax Pharmaceuticals, ZelBio Inc., Hibercell Inc., and Acerta Pharma, and has participated in advisory boards for Pharmacyclics, Syndax, Carisma, Verseau, CytomX, Kineta, Hibercell, Cell Signaling Technologies, Alkermes, Zymeworks, Genenta Sciences, Pio Therapeutics Pty Ltd., PDX Pharmaceuticals, the AstraZeneca Partner of Choice Network, the Lustgarten Foundation, and the NIH/NCI-Frederick National Laboratory Advisory Committee. N.A. reports consulting/lecture services for Cellino Biotech, Immunitas, Shennon Biotechnologies, and Janssen. All other authors declare that they have no competing interests.

Figures

Extended Data Fig. 1.
Extended Data Fig. 1.. CD8+ T cells egress from tumors.
(A) Schematic representation of strategy to label and trackendogenous leukocyte egress using the Kaede-Tg mouse model. (B) Representative gating scheme to identify egressedKaede red+CD8+ T cells in tumor draining brachial LNs 24hrs post photoconversion of the tumor. (C) Representative flowplot of non-draining inguinal LNs 24hrs post photoconversion of the tumor. (D) Frequency of CD4+, CD4+CD25+Foxp3+regulatory T cells (Treg), and CD8+ T cells of all photoconverted CD45+ leukocytes in the draining LN 24 hrs postphotoconversion (n=6) (E-F) Representative flow plots (E) and frequencies (F) of CD44/CD62L cell populations amongintratumoral (T) or egressed (E) CD8+ T cells from YUMMER1.7-bearing Kaede-Tg mice (n=6) 24hrs postphotoconversion. For all experiments, each symbol represents one mouse. One-way ANOVA adjusted for multiplecomparisons (D) and two-sided, paired student’s t-test (F).
Extended Data Fig. 2.
Extended Data Fig. 2.. Identification of tumor-specific CD44+CD8+ T cells egressing tumors.
(A) Representative gatingscheme identifying endogenous egressed Kaede red+ H-2Kb-OVA257–264+ CD44+CD8+ T cells in tumor draining brachial LNs24hrs post photoconversion of MCA.205WT (WT) or MCA.205OVA (OVA) tumors. (B) Representative gating schemeidentifying egressed Kaede red+ Thy1.1/1.1CD44+CD8+ OT-1-TCR-Tg T cells in tumor draining brachial LNs 24hrs postphotoconversion of B16.F10WT (WT) or B16.F10OVA (OVA) tumors.
Extended Data Fig. 3.
Extended Data Fig. 3.. TCRb-sequencing indicates clonal overlap between intratumoral and egressed CD8+ T cells.
Kaede red+ CD3e+ T cells were sorted from YUMM1.7 draining LNs 24hrs post photoconversion and submitted for TCRbdeep sequencing along with matched intratumoral YUMM1.7 T cells (n=5). In total, 5 mice were submitted for sequencing(A) Representative bubble plot (mouse 003) identifying clones sequenced in the egressed compartment (red), tumorcompartment (blue), or both (Shared; green). (B) The percentage of sequenced clones detected in the tumor (T) or egressed(E) compartments, or both (shared; Sh). Each symbol represents one mouse. One-way ANOVA adjusted for multiplecomparisons was used to determine statistical significance. (C) Pie charts for each mouse indicating the percentage ofsequenced clones detected in the tumor (blue) or egressed (red) compartments or both (Shared; green). (D) Tabledemonstrating the clonal size criteria for classifying clones as hyperexpanded, large, medium, small, or rare clones. (E) Piechart demonstrating the percentage of shared clones classified as hyperexpanded, large, medium, small, or rare clonesaveraged across all mice. (F) Pie charts demonstrating the percentage of shared clones classified as hyperexpanded, large,medium, small, or rare clones for each individual mouse.
Extended Data Fig. 4.
Extended Data Fig. 4.. Functional effector CD44+CD8+ T cells egress from melanoma microenvironments.
(A)Volcano plot depicting differentially expressed genes (DEGs) between tumor retained and egressed CD8+CD44+ T cells(logFC≥1.5, FDR≤0.1). (B) Pathway analysis of DEGs in (A) using HumanBase integrative analysis. (C and D)Representative flow plots (C) and frequencies (D) of LAG3+ intratumoral (T) or egressed (E) CD44+CD8+ T cells fromYUMMER1.7-bearing Kaede-Tg mice (n=3) 24hrs post photoconversion. (E and F) Representative flow plots (E) andfrequencies (F) of PD-1+TIM3+ and PD-1-TIM3- intratumoral (T) or egressed (E) Thy1.1/1.1 CD44+ OT-1-Kaede-TCR-Tg Tcells from B16.F10OVA-bearing mice (n=4) 24hrs post photoconversion. (G and H) Representative flow plots (G) andfrequencies (G) of PD-1/TCF1 intratumoral (T) or egressed (E) CD44+CD8+ T cells YUMMER1.7-bearing Kaede-Tg mice(n=6) 24hrs post photoconversion. (I) PD-1 MFI of PD-1+CD8+ T cells from (G). (J and K) Representative flow plots (J)and frequency (K) of ex vivo IFNg and TNFa production by intratumoral (T) or egressed (E) CD44+CD8+ T cells fromYUMM1.7 tumors (day 21; n=4) following ex-vivo restimulation. For all graphs, each symbol represents one mouse. Twosided,paired and (D, F, H, and I) and unpaired student’s t-test (K). n.s. = not significant.
Extended Data Fig. 5.
Extended Data Fig. 5.. CD44+CD8+ T cells egress from tumors is G protein-coupled receptor and CXCR4-dependent.
(A-C) YUMM1.7-bearing Kaede-Tg mice were treated with FTY720 (FTY) or pertussis toxin (PTx) the day before and dayof photoconversion. (A) Frequency of CD8+ T cells (among live CD45+ cells) in the blood post treatment with pertussistoxin (PTx) or FTY720 (FTY). (B) Numbers of CD8+ T cells in YUMM1.7 tumors of Kaede-Tg mice post treatment withPTx or FTY720. (C) Numbers of Kaede red+CD8+ T cells in the dLNs of YUMM1.7 tumors of Kaede-Tg mice post treatmentwith PTx or FTY720. n= 7 vehicle control mice; n=8 PTx-treated mice; n=8 FTY-treated mice; each symbol represents onemouse; results of 2 independent experiments. (D) Representative histogram of CXCR4 surface expression on CD44+CD8+T cells from spleen and YUMMER1.7 tumors. FMO = Fluorescence minus one (CXCR4). (E) Quantification of CXCR4MFI in tumor and spleen. n=3 mice; error bars = standard deviation. (F) Histograms confirming CXCR4 knockout on CD8+T cells (left panel) or CD19+ B cells (right panel) from CXCR4WT (red) or CXCR4ΔUBC (blue) mice. (G) Numbers ofCD45.2+CD8+ CXCR4WT (WT; n=14) or CXCR4ΔUBC (KO; n=13) T cells in dLNs of YUMMER1.7 tumors 16–20hrsfollowing intratumoral transfer (per 104 transferred T cells). Each symbol represents one mouse. One-way ANOVA adjustedfor multiple comparisons (A-C) and two-sided, paired (E) or unpaired (G) student’s t-test. n.s. = not significant.
Extended Data Fig. 6.
Extended Data Fig. 6.. CD8+ T cell functional states in murine melanomas.
(A) Heatmap of Seurat cluster defining genesarranged by Monocle Branch. (B-C) Bubble plot representation of key transcripts that distinguish Seurat (B) and Monocleclusters (C). (D) UMAP depicting Seurat clusters and (E) Monocle pseudotime trajectory analysis following cell cycleregression.
Extended Data Fig. 7.
Extended Data Fig. 7.. RNA-Seq of LECs sorted from naïve skin and BPC melanomas.
(A) Gating scheme for FACSof LECs (CD45-CD31+gp38+) from naive skin and BPC tumors. (B) Normalized transcript counts of genes validating LECidentity for CD45-CD31+gp38+ cells sorted from naive skin and BPC tumors. (C) Principal component analysis comparingthe transcriptomes of LECs sorted from naive skin and BPC tumors. (D) Heatmap of top differentially expressed genesamong naive and BPC-associated LECs. (E) Gene set enrichment analysis of pathways enriched in naive vs BPC-associatedLECs. (F-H) Normalized transcript counts for Ccl21a (F), Sphk2 (G), and Sphk1 (H) in naive and BPC-associated LECs.Each symbol represents one mouse; n=3 naive and 4 BPC mice. Two-sided, unpaired student’s t test (G-H); n.s. = notsignificant
Extended Data Fig. 8.
Extended Data Fig. 8.. Expression of Cxcl12 transcripts in YUMMER1.7 and YUMM1.7 tumor microenvironments.
(A) RNAScope of Cxcl12 transcripts in YUMMER1.7 tumors (purple); hematoxylin (blue). Repeated in 3 tumors. Leftimage: scale bar = 400 μm; middle and right images: scale bar = 200 μm (B) Frequency of Cxcl12-dsRed+ cells inYUMMER1.7 tumors (n=11 across 2 independent experiments). (C) Representative flow plots of CD45-CD31+gp38+dsRed+lymphatic endothelial cells (LEC) in Cxcl12-dsRed reporter mice or littermate controls (Cxcl12+/+). (D) Frequency ofCxcl12+ in LECs, blood endothelial cells (CD45-CD31+gp38-, BEC), epithelial cells (CD45-CD31-EpCAM+, Epi),fibroblasts (CD45-CD31-PDGFRa+, Fibro) in YUMMER1.7 tumors of Cxcl12-dsRed reporter mice (n=14; 3 independentexperiments). (E) Frequency of Cxcl12+ in B cells (CD3e-B220+), T cells (CD3e+B220-), neutrophils (CD3e-B220-CD11b+Ly6G+, Neutro), dendritic cells (CD3e-B220-CD11c+MHCII+, DCs), immature monocytes (CD3e-B220-CD11b+Ly6C+, Imm Mono), and macrophages (CD3e-B220-CD11b+Ly6C-F4/80+MHCII+/−, TAMs) in YUMMER1.7tumors of Cxcl12-dsRed reporter mice (n=3). (F) RNAScope of Cxcl12 transcripts in YUMM1.7 tumors (purple);hematoxylin (blue). Repeated in 3 tumors. Left image: scale bar = 400 μm; middle and right images: scale bar = 200 μm(G) Frequency of Cxcl12+ in CD45-stromal cells in YUMM1.7 tumors of Cxcl12-dsRed reporter mice (n=3). (H) Frequencyof Cxcl12+ CD45+ cells in YUMM1.7 tumors of Cxcl12-dsRed reporter mice (n=3). (I and J) Frequency of Cxcl12+ BECs(I) or fibroblasts (J) from normal adjacent skin or YUMMER1.7 tumors in Cxcl12-dsRed reporter mice (n=8; 2 independentexperiments). (K) qRT-PCR of CXCL12 transcript levels from hypoxic LN LECs isolated from CXCL12WT orCXCL12ΔiProx1 mice (n=3). Transcripts normalized to b-actin and represented as fold change from WT. (L) Lymphaticvessel dilation in tumors implanted in CXCL12WT or CXCL12ΔiProx1 mice (n=5). (M and N) Quantification of total LEC aspercent of live (M) and proportion of LYVE-1+ LECs (N); n=6–7 mice. (O and P) Quantification of regulatory T cells(TREG, CD3e+CD4+CD25+Foxp3+) as a percent of live (O) or of CD4+ T cells (P); n=4–5 mice. For all graphs, each symbolrepresents one mouse. Two-sided paired (B, I, and J) and unpaired (K-P) student’s t-test. n.s. = not significant.
Extended Data Fig. 9.
Extended Data Fig. 9.. CXCR4 inhibition does not impact effector circulation or function.
(A) Frequency of CD8+ Tcells in the blood (left) or lymph (right) following acute treatment with FTY720 (FTY) or AMD3100 (AMD). n=3–5 miceper group. (B) Shannon diversity index for TCRb sequences detected in YUMMER1.7 tumors 7 days post treatment withAMD3100 (AMD; n=10) or vehicle control (Cont; n=8). Error bars = standard error; center = mean. (C) Frequency ofIFNg+TNFa+ producing CD44+CD8+ T cells following ex vivo CD3/CD28 restimulation in the presence or absence ofAMD3100. n=5 (D) Frequency of IFNg+TNFa+ producing endogenous CXCR4WT (n=3) or CXCR4ΔUBC (n=3) CD44+CD8+T cells following ex vivo CD3/CD28 restimulation. (E) Frequency of IFNg+TNFa+ producing CD44+CD8+ T cells followingex vivo CD3/CD28 restimulation in the presence (n=3) or absence (n=3) of recombinant murine 100 ng/ml CXCL12. ForD-E, error bars = standard deviation; center = mean. For all graphs, each symbol represents one mouse. One-way ANOVAadjusted for multiple comparisons (A and C), two-sided Mann-Whitney test (B), two-sided, unpaired student’s t-test (D andE). (F) YUMM1.7 tumor growth during treatment with vehicle control (Cont; black; n=5), AMD3100 (AMD; blue; n=5), aPD-L1 (PD-L1; red; n=5), or combination AMD3100+aPD-L1 (A+P; green n=5); one experiment. Fractions indicate rate of tumor control defined as daily growth rate <30mm3 post onset of therapy.
Fig. 1.
Fig. 1.. Dermal lymphatic vessels limit CD8+ T cell accumulation in melanoma.
(A) Representative immunofluorescence images of peritumoral and intratumoral CD8+ T cells (green) and LYVE-1+ (red) lymphatic vessels from YUMMER1.7 tumors. Nuclei stained with DAPI. Left image: scale bar = 100 μm middle and right images: scale bar = 50 μm. (B) Average frequency of CD8+ pixels per peritumoral (PT) or intratumoral (IT) area in YUMMER1.7 tumors. Each dot represents one mouse (n=3). (C) Representative image of CD8+ T cells (green) located around a LYVE-1+ lymphatic vessel (red). Scale bar = 50 μm. Immunofluoresnce staining was performed in 3 rounds with at least 3 independent biological samples per staining round. (D-E) 5×10⁵ congenically labeled, ex vivo activated OT-1 CD8+ T cells were intravenously transferred into B16.F10OVA-bearing WT or K14-VEGFR3-Ig (K14-V3) mice on day 7. Graphs indicate numbers of Thy1.1/1.1 OT-1 T cells in B16.F10OVA tumors and spleens at day 3 (D) and day 7 (E) post-transfer into WT and K14-V3 mice. WT (day 3: n=9; day 7: n=9) and K14-V3 (day 3: n=6; day 7 n=6) across 2–3 independent experiments. (F) Percent BrdU+ of all Thy1.1/1.1 OT-1 T cells in B16.F10OVA tumors on day 7 post transfer (n=3–4). (G) Representative multiplex IHC images of T cell excluded (top image) and infiltrated (bottom image) regions in human cutaneous melanomas. αSMA+ blood vessels (cyan), podoplanin+ lymphatic vessels (PDPN, green), CD8+ T cells (orange), S100+ melanoma (white). Scale bar = 400 μm. (H) Number of CD8+ T cells per mm2 in the intratumoral (IT) vs peritumoral (PT) regions from (G). (I) Number of PDPN+ vessels per mm2 in excluded (Excl.) vs infiltrated (Infl.) regions. (J). Number of LYVE-1+ (left) or LYVE-1 (right) PDPN+ lymphatic vessels per mm2 in excluded vs infiltrated regions. For G-J, across 28 patient samples, 47 ROIs were scored as “excluded” and 25 ROIs were scored as “infiltrated; each symbol represents one ROI. For B and D-F, each symbol represents one mouse. Two-sided, unpaired (B-F and I-J) and paired student’s t-tests (H). n.s.=not significant.
Fig. 2.
Fig. 2.. Functional, tumor-specific effector CD8+ T cells egress from tumor via lymphatic vessels.
(A) Frequency of CD8+ T cells among Kaede red+ CD45+ cells in the dLNs of various tumors 24hrs post-photoconversion of Kaede-Tg mice. MC38: n=7; YUMM1.7: n=54; YUMMER1.7: n=30; B16.F10: n=4; MCA.205: n=14; except for B16.F10 tumors, 2 or more independent experiments; error bars = standard deviation; center = mean. (B) Experimental schematic for (C and D). (C) Total number of Kaede red+ H-2Kb OVA257–264 CD44+CD8+ T cells in dLNs of MCA.205WT (WT) or MCA.205OVA (OVA) tumors 24hrs post photoconversion. n=5. (D) Ratio of the number of egressed to intratumoral H-2Kb OVA257–264 CD44+CD8+ T cells in MCA.205WT (WT) or MCA.205OVA (OVA) tumors and their respective dLNs. n=5. (E) Experimental schematic for (F and G). (F) Total number of Kaede red+Thy1.1/1.1CD44+ OT-1 T cells in dLNs of B16.F10WT or B16.F10OVA tumors 24hrs post photoconversion. n=9 across 2 independent experiments. (G) Ratio of the number of egressed to intratumoral Thy1.1/1.1CD44+ OT-1 T cells in B16.F10WT or B16.F10OVA tumors and their respective dLNs n=9 across 2 independent experiments. (H) Heatmap of differentially expressed genes in circulating (spleen), tumor retained (Kaede red+), and egressed (Kaede red+) CD44+CD8+ T cells of YUMM1.7 tumors. n=4 mice (I) Enrichment scores for gene signatures associated with T cell dysfunction (GSE41867) in tumor versus egressed CD44+CD8+ T cells; up in exhausted (Exh, green); down in exhausted (Non-exh, red). (J) Representative flow plots of PD-1 and TIM3 surface expression on intratumoral and egressed CD44+CD8+ T cells from YUMMER1.7 tumors. (K and L) Frequencies of PD-1+TIM3+, PD-1TIM3 (K; n=8) and TCF1+PD-1+ (L; n=6) cells among tumor (T) and egressed (E) CD44+CD8+ T cells of YUMMER1.7. (M and N) Representative flow plots (M) and frequency (N) of ex vivo IFNγ and TNFα production by CD44+CD8+ T cells tumor retained (T) or egressed (E) YUMMER1.7 tumors (day 21). n=6 across 2 independent experiments. For all experiments, each symbol represents one mouse. Two-sided, paired (C, D, F, G) and unpaired (K, L, N) student’s t-tests.
Fig. 3.
Fig. 3.. Local antigen encounter links T cell function and migratory potential.
(A) Representative plot of intratumoral CD44+CD8+ T cells used in figures B-D: PD-1TIM3 (−/−); PD-1+TIM3 (+/−); PD-1+TIM3+ (+/+). (B-D) Quantification of CXCR4 (B), CXCR6 (C), and ACKR3 (D) on intratumoral PD-1 vs TIM3 CD44+CD8+ T cells from YUMMER1.7 tumors. Each symbol represents one mouse. (E) Number of wild type (WT) (n=8) or CXCR4-deficient (KO) (n=12) effector CD8+ OT-1 TCR-Tg T cells in B16.F10OVA tumor dLNs 20hrs post intratumoral transfer (per 105 transferred cells). For E, 2 independent experiments. (F) UMAP plot depicting Seurat clusters (1269 cells; pooled from 3 mice), (G) feature plot representation of Cxcr4 (blue) and Cxcr6 (red) expression in each cell, (H) and Monocle 3 pseudotime analysis on intratumoral CD8+ T cells from day 21 YUMMER1.7 tumors. (I and J) Scoring of cells with a Retained vs. Egress signature derived from bulk RNAseq (expression of Retained program – Egress program). Scores were visualized on individual cells (I) and compared across Monocle branches (J). Monocle Branch 1 (n=623 cells), Branch 2 (n=260 cells), Branch 3 (n=386 cells). (K) Skin residence (GSE47045) and (L) TCR signaling (Reactome: R-MMU-202424). Boxplots, center represents median, upper and lower box bounds represent upper and lower quartiles respectively, and whiskers represent observations within 1.5*IQR of the upper and lower quartiles. (M) Time course of CXCR4 (left) and ACKR3 (right) surface expression on OVA-specific CD44+CD8+ T cells following ex vivo stimulation in the absence (unstim) or presence of CD3ε/CD28 antibodies. (N) Frequency of OVA-specific CD44+CD8+ T cells migrated toward CXCL12 following stimulation with (+) or without (−) SIINFEKL (N4) peptide. (O and P) Representative histograms (O) and quantification (P) of CXCR4 and ACKR3 on OVA-specific CD44+CD8+ T cells following 24hr ex vivo stimulation in the absence (U) or presence of CD3ε/CD28 antibodies (Ab) or peptides: SIINFEKL (N4), SIITFEKL (T4), or SIIQFEKL (Q4). For M and P, n=4 mice; error bars = standard deviation; for N, n=3 mice; representative graphs from 3 independent experiments. MFI=mean fluorescence intensity. One-way ANOVA adjusted for multiple comparisons (B-D, M-N, P); two-sided, unpaired student’s t-test (E); two sample wilcoxon rank-sum with a two-sided test (J-L).
Fig. 4.
Fig. 4.. Egressing T cell states associate with response to immune checkpoint blockade in patients.
(A) Schematic representation of three distinct intratumoral CD8+ T cell fates and key molecular signals that determine their probability of long-term retention or tumor egress. (B) Scoring of cells in each monocle branch with melanoma patient immune checkpoint blockade (ICB) non-responder vs responder T cell signatures. (C) Bubble plot of chemokine receptor expression in human melanoma CD8+ tumor infiltrating lymphocytes (TIL; GSE120575) early activated subcluster associated with non-response vs a late memory subcluster associated with response to ICB. (D) Scoring of monocle branch-associated gene programs in human melanoma CD8+ TILs subclusters. Early Activation (n=2312 cells), late memory (n=1680 cells). Two sample Wilcoxon rank-sum with a two-sided test test (B,D). For all boxplots, center represents the median, upper and lower box bounds represent the upper and lower quartiles respectively, and whiskers represent observations within 1.5*IQR of the upper and lower quartiles.
Fig. 5.
Fig. 5.. Lymphatic endothelial cell-secreted CXCL12 sequesters CD8+ T cells in the tumor periphery.
(A) Heatmap of select genes differentially expressed by sorted CD45CD31+gp38+ lymphatic endothelial cells (LEC) from naïve skin (N; n= 3 mice) or BPC mouse melanomas (BPC; n= 4 mice). (B) Normalized CXCL12 transcript counts from naïve (n=3 mice) or BPC tumor-associated LECs (n=4 mice). (C) Frequency of CXCL12-dsRed+ cells of CD45CD31+gp38+ LECs from normal adjacent skin or YUMMER.17 tumors in CXCL12-dsRed reporter mice. (D) Frequency of CXCL12-dsRed+ cells of gp38+LYVE-1lo or gp38+LYVE-1hi LECs. For C-D, n=8. (E) Representative images of CXCL12 (green) in YUMMER1.7 tumors implanted in Prox1-TdTomato (red) reporter mice. Nuclei, DAPI (blue). Arrows = CXCL12+ lymphatic vessels; scale bar = 100 μm. Inset, far right; scale bar = 50 μm. Immunofluorescence staining was repeated in 3 independent rounds with at least 3 independent samples per round. (F) Representative images of LYVE-1+ and LYVE-1 lymphatic vessels (LYVE-1, blue; Prox1, red; CXCL12, green; CD8, cyan; Scale bar = 50μm). (G) Quantification of CXCL12 pixel area of (left) and CD8+ T cell density proximal to (right) Prox1+LYVE-1+ and Prox1+LYVE-1 peritumoral lymphatic vessels. Each point is a vessel, sampled over three mice. (H) Representative peritumoral and intratumoral images of CD8+ T cells (green) and LYVE-1+ (red) lymphatic vessels in YUMMER1.7 tumors (day 14) of CXCL12WT or CXCL12ΔiProx1 mice. Nuclei, DAPI (blue). Scale bars = 50 μm. (I) Frequency of LYVE-1+ pixels per image in the peritumoral region of YUMMER1.7 tumors in CXCL12WT (n=9) or CXCL12ΔiProx1 (n=8) mice. (J) Frequency of CD8+ pixels per image in peritumoral and intratumoral regions of YUMMER1.7 tumors in CXCL12WT (n=11) or CXCL12ΔiProx1 (n=8) mice; results of 2 independent experiments. For all experiments, each symbol represents one mouse except in G. Two-sided, unpaired (B, G, and I-J) and paired (C-D) student’s t-tests.
Fig. 6.
Fig. 6.. CXCL12-CXCR4 signaling blockade improves tumor control and immunotherapy efficacy.
(A-C) Number of CD45+ leukocytes (A), CD3ε+ T cells (B), or CD44+CD8+ T cells (C) per gram of tumor after 7 days of treatment with AMD3100 (AMD; n=8)) or vehicle control (Cont; n=6) in mice bearing YUMMER1.7 tumors. (D and E) Maximal clonal frequency of endogenous CD3ε+ T cells (D) and relative levels of hyperexpanded CD3ε+ clones (E) in YUMMER1.7 tumors 7 days post treatment with AMD3100 (n=10) or vehicle control (n=8). Error bars = standard error. (F) Frequency of PD-1+TIM3+ CD44+CD8+ T cells in YUMMER1.7 tumors 7 days post treatment with AMD3100 (n=8) or vehicle control (n=6). (G) YUMMER1.7 tumor growth during treatment with vehicle control (Cont; black; n=10), AMD3100 (AMD; blue; n=10), αPD-L1 (PD-L1; red; n=10), or combination AMD3100+αPD-L1 (A+P; green n=10); 2 independent experiments. (H) YUMMER1.7 tumor volumes at day 21 of treatment. (I) YUMMER1.7 tumor growth in CXCL12WT (n=15) or CXCL12ΔiProx1 (n=14) with and without CD8α-depleting antibody treatment (n=5). (J) YUMMER1.7 tumor volumes at day 21 in CXCL12WT or CXCL12ΔiProx1 mice. (K) B16F10.OVA tumor growth in C57Bl/6 mice either untreated (No Transfer; n=7) or treated with adoptive T cell therapy (CD44+ OT-1 TCR-Tg, 1.0×10⁶) with (wildtype, WT; n=12) or without Cxcr4 (KO, UBCCreERT2;Cxcr4fl/fl; n=16) expression. (L) Rate of growth from day of transfer to endpoint and (M) day 9 tumor volumes for B16.F10OVA tumors post WT or KO OT-1 transfer. Each symbol or line represents one mouse. Fractions indicate rate of tumor control defined as daily growth rate <30 mm3 for YUMMER1.7 and <55mm3 for B16.F10OVA post onset of therapy. Two-sided, unpaired student’s t-test (A-C, F, J, L, and M), two-sided Mann-Whitney test (D-E), and One-way ANOVA adjusted for multiple comparisons (H).

Similar articles

Cited by

References

    1. Steele MM & Lund AW Afferent Lymphatic Transport and Peripheral Tissue Immunity. J.I. 206, 264–272 (2021). - PMC - PubMed
    1. Lund AW et al. Lymphatic vessels regulate immune microenvironments in human and mouse melanoma. Journal of Clinical Investigation 126, 3389–3402 (2016). - PMC - PubMed
    1. Loo CP et al. Lymphatic Vessels Balance Viral Dissemination and Immune Activation following Cutaneous Viral Infection. Cell Reports 20, 3176–3187 (2017). - PMC - PubMed
    1. Alitalo AK et al. VEGF-C and VEGF-D blockade inhibits inflammatory skin carcinogenesis. Cancer Res. 73, 4212–4221 (2013). - PubMed
    1. Lund AW et al. VEGF-C promotes immune tolerance in B16 melanomas and cross-presentation of tumor antigen by lymph node lymphatics. Cell Rep 1, 191–199 (2012). - PubMed

Methods-only References

    1. Ding L & Morrison SJ Haematopoietic stem cells and early lymphoid progenitors occupy distinct bone marrow niches. Nature 495, 231–235 (2013). - PMC - PubMed
    1. Bazigou E et al. Genes regulating lymphangiogenesis control venous valve formation and maintenance in mice. J Clin Invest 121, 2984–2992 (2011). - PMC - PubMed
    1. Meeth K, Wang JX, Micevic G, Damsky W & Bosenberg MW The YUMM lines: a series of congenic mouse melanoma cell lines with defined genetic alterations. Pigment Cell & Melanoma Research 29, 590–597 (2016). - PMC - PubMed
    1. Wang J et al. UV-induced somatic mutations elicit a functional T cell response in the YUMMER1.7 Mouse Melanoma Model. Pigment Cell Melanoma Res 30, 428–435 (2017). - PMC - PubMed
    1. Broggi MAS, Schmaler M, Lagarde N & Rossi SW Isolation of Mouse Lymph Node Stromal Cells. JoVE (Journal of Visualized Experiments) e51803 (2014) doi:10.3791/51803. - DOI - PMC - PubMed

Publication types

Substances