. 2023 Jan 11;14(1):159.
doi: 10.1038/s41467-023-35801-z.

TGFβ1+CCR5+ neutrophil subset increases in bone marrow and causes age-related osteoporosis in male mice

Affiliations

TGFβ1+CCR5+ neutrophil subset increases in bone marrow and causes age-related osteoporosis in male mice

Jinbo Li et al. Nat Commun. .

Abstract

TGFβ1 induces age-related bone loss by promoting degradation of TNF receptor-associated factor 3 (TRAF3), levels of which decrease in murine and human bone during aging. We report that a subset of neutrophils (TGFβ1+CCR5+) is the major source of TGFβ1 in murine bone. Their numbers are increased in bone marrow (BM) of aged wild-type mice and adult mice with TRAF3 conditionally deleted in mesenchymal progenitor cells (MPCs), associated with increased expression in BM of the chemokine, CCL5, suggesting that TRAF3 in MPCs limits TGFβ1+CCR5+ neutrophil numbers in BM of young mice. During aging, TGFβ1-induced TRAF3 degradation in MPCs promotes NF-κB-mediated expression of CCL5 by MPCs, associated with higher TGFβ1+CCR5+ neutrophil numbers in BM where they induce bone loss. TGFβ1+CCR5+ neutrophils decreased bone mass in male mice. The FDA-approved CCR5 antagonist, maraviroc, reduced TGFβ1+CCR5+ neutrophil numbers in BM and increased bone mass in aged mice. 15-mon-old mice with TGFβRII specifically deleted in MPCs had lower numbers of TGFβ1+CCR5+ neutrophils in BM and higher bone volume than wild-type littermates. We propose that pharmacologic reduction of TGFβ1+CCR5+ neutrophil numbers in BM could treat or prevent age-related osteoporosis.


Conflict of interest statement

The authors declare no competing interests.

Figures
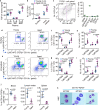
Fig. 1
Fig. 1. Neutrophils are the major cellular source of TGFβ1 in BM from aged mice.
a Expression levels of TGFβ1 in protein lysates from bone (with BM flushed out), BM cells (BMC), and BM plasma from one leg from young (2–4-mon-old) and aged (18–22-mon-old) male C57 mice using ELISA. Mean±SD (n = 7 biologically independent male mice/group). b Surface and intracellular expression of TGFβ1 tested by FACS in BM cells from 4- and 22-mon-old C57 mice. Mean ± SD (n = 7 biologically independent male mice/group). c Enrichment of TGFβ1+ BM cells in CD11b+Gr1+ myeloid cells and percentages of various types of BM cells expressing TGFβ1 in BM. Mean ± SD (n = 4 biologically independent male mice). d, e FACS analysis of Ly6C+ and Ly6G+ subpopulations in TGFβ1+CD11b+ myeloid cells with TGFβ1 surface and intracellular expression in BM from 4- and 22-mon-old C57 mice, and frequencies (f, g) and numbers (h, i) of monocytic (Ly6Chi6G-), granulocytic (Ly6C-6G+) and intermediate-stage (Ly6Clo6G-) cells in TGFβ1+CD11b+ myeloid cells in BM. Mean±SD (n = 7 biologically independent male mice/group). j Frequencies of TGFβ1+CD11b+Ly6C-6G+ cells in peripheral blood, mesenteric lymph nodes, and spleen. Mean ± SD (n = 5 biologically independent male mice/group). k H&E-stained Ly6C+ and Ly6G+ subpopulations from TGFβ1+CD11b+ myeloid cells following FACS and cyto-spinning. Bar = 10 μm. Analyses: Student’s two-sided unpaired t test. Source data are provided as a Source data file.
Fig. 2
Fig. 2. Neutrophils inhibit osteoblast differentiation from MPCs and promote osteoclast formation through TGFβ.
a Mesenchymal progenitor cells (MPCs) co-cultured with Ly6G+ BM cells from 3- and 21-mon-old mice for 4 d and b ALP+ OB area. Mean ± SD (n = 3 biologically independent samples/group). c Active TGFβ1 protein levels in lysates of Ly6G+ BM cells magnetically-isolated from 4- and 22-mon-old mice tested using ELISA. Mean ± SD (n = 5 biologically independent male mice/group). d MPCs from 3-mon-old C57 mice co-cultured with TGFβ1+ neutrophils (TNs) sorted from BM of 3- and 20-mon-old C57 mice and treated with vehicle or the TGFβ neutralizing Ab, 1D11. ALP staining performed for osteoblast measurement. Mean±SD (n = 4 biologically independent samples/group). e MPCs from TGFβRIIfl/fl (WT) and Prx1Cre;TGFβRIIfl/fl (cKO) male mice co-cultured with TNs sorted from 20-mon-old C57 mice (A-TN), and ALP+ stained osteoblasts. Mean ± SD (n = 4 biologically independent samples/group). f, g Osteoclast precursors from 3-mon-old C57 mice co-cultured with TNs from 20-mon-old mice (A-TN) plus addition of vehicle or 1D11, and TRAP-stained. Bar = 100 μm. Mean ± SD (n = 4 biologically independent samples/group). hk MPCs from TGFβRIIfl/fl (WT) and Prx1Cre;TGFβRIIfl/fl (cKO) male mice were implanted subcutaneously into NSG mice along with TNs sorted from 3- (Y) and 24-mon-old (A) mTmG mice. Implants were harvested 1 month later, processed through paraffin, and H&E- and TRAP-stained. G: implanted GelFoam (red). B: newly-formed bone (yellow). h, i Newly generated bone area. Bar = 50 μm. j, k Osteoclast (red) number in newly generated bone. G: implanted GelFoam (blue). B: newly-formed bone (light pink). Bar = 25 μm. Mean ± SD (n = 4 biologically independent male mice/group). Analyses: Student’s two-sided unpaired t test in (c); one-way ANOVA with Tukey’s post hoc test in all others. Source data are provided as a Source data file.
Fig. 3
Fig. 3. NSG mice injected with TGFβ1-expressing neutrophils (TNs) develop osteoporosis.
a μCT 3D reconstruction of trabecular bone and coronal sections of tibial metaphyses of NSG mice injected with PBS (control), TNs sorted from young (Y-TN) or from aged mice (A-TN). Bar = 1 mm. bd Microstructural parameters, including trabecular bone volume (BV/TV) (b), number (Tb.N) (c), and separation (Tb.Sp) (d) in tibial metaphyses. Mean ± SD (n = 3, 4, and 4 biologically independent male recipient mice for control, Y- and A-TN groups, respectively). e Histomorphometric analysis of tibial metaphyseal bone of NSG recipients, and H&E and TRAP staining performed for osteoblast and osteoclast counting, respectively. Bar = 50 μm. fh Osteoblast surfaces (Ob.S/BS) (f), osteoclast surfaces (Oc.S/BS) (g) and numbers (Oc.N/BS) (h) on metaphyseal trabecular bone surfaces. Mean ± SD (n = 3, 4, and 4 biologically independent male recipient mice for control, Y- and A-TN groups, respectively). Analyses: one-way ANOVA with Tukey’s post hoc test. Source data are provided as a Source data file.
Fig. 4
Fig. 4. Mice with TRAF3 deleted in MPCs have increased numbers of TGFβ-expressing neutrophils in BM.
a WBs of TRAF3, RelB, p52, and GAPDH expression in total protein lysate extracted from leg bones (with BM) from 3- (young) and 18-mon-old (aged) C57 mice. b von-Kossa-stained plastic sections of L1 vertebrae from 12-mon-old Prx1Cre;TRAF3fl/fl (P-cKO) mice and WT littermates. Bar = 400 μm. c H&E-stained paraffin sections of L2 vertebrae from 12-mon-old WT and P-cKO mice, and d OB surfaces (Ob.S/B.S). Bar = 400 μm in (c) and 50 μm in (d). Mean ± SD (n = 8 biologically independent male mice/group). e TRAP-stained paraffin sections of L2 vertebrae and OC numbers (Oc.N/B.S). Bar = 50 μm. Mean ± SD (n = 8 biologically independent male mice/group). f, g Frequencies and numbers of TGFβ1+CD11b+Ly6Chi6G- and TGFβ1+CD11b+Ly6C-6G+ in BM from 15-mon-old WT and P-cKO mice. Mean ± SD (n = 5 biologically independent male mice/group). Analyses: Student’s two-sided unpaired t test. Source data are provided as a Source data file.
Fig. 5
Fig. 5. Aged and P-cKO mice have MPCs with increased CCL5 expression and increased numbers of TCNs in BM.
a Heatmap of mouse chemokine levels tested using real-time qPCR in bulk RNA extracted from CD45- cells isolated from BM of 9-mon-old TRAF3fl/fl (WT) and Prx1CreTRAF3fl/fl (P-cKO) mice and 24-mon-old TRAF3fl/fl (WT) mice. n = 4, 3, and 3 biologically independent male mice, respectively. b, c Cytokine array of BM protein lysate from 2- and 18-mon-old male C57 mice (b) and from 9-mon-old WT and P-cKO male mice (c). d Relative levels of Ccl5 mRNA in bulk RNA from 3rd passage BM-MSCs from 3- (young; Y) and 22-mon-old (aged; A) male C57 mice. Mean ± SD (n = 3 biologically independent samples/group). e Relative levels of Ccl5 in bulk RNA from human vertebral specimens. Mean±SD (n = 16 young (Y) and 18 elderly (A) human subjects). f, g Sheared chromatin from WT and P-cKO BdMPCs used to perform DNA IP with RelA and RelB Abs or IgG control. RT-PCR using designed primers with putative κB binding sites in Ccl5 gene promotors, normalized to input. Mean±SD (n = 3 biologically independent samples/group). h TNs sorted from BM of 3- (young) and 22-mon-old (aged) male C57 mice attracted by chemokines, including CCL4, CCL5 and CXCL12. Velocity of TN migration. Mean ± SD (n = 20 biologically independent cells). i Frequencies of CCR5+ cells in Ly6Chi6G- and Ly6C-6G+ cells gated from TGFβ1+CD11b+ BM cells of 22-mon-old male C57 mice. Mean ± SD (n = 5 biologically independent male mice/group). j Mean fluorescence intensity (MFI) of CCR5 expression by Ly6Chi6G- and Ly6C-6G+ subpopulations in TGFβ1+CD11b+ BM cells from 22-mon-old male C57 mice. Mean ± SD (n = 5 biologically independent male mice/group). k Frequencies of CSF-1R+ cells in Ly6Chi6G- and Ly6C-6G+ cells gated from TGFβ1+CD11b+ BM cells of 22-mon-old male C57 mice. Mean ± SD (n = 13 biologically independent male mice/group). l Migration of TNs from 22-mon-old male C57 mice toward WT and P-cKO MPCs upon vehicle or maraviroc treatment tested using a transwell system. Cells maintained in the transwell membrane stained purple and manually marked with black line circles. Bar = 50 μm. m Cells in purple in transwell membrane. Mean ± SD (n = 4 biologically independent samples/group). Analyses: one-way ANOVA with Tukey’s post hoc test in (h) and (m); Student’s two-sided unpaired t test in all others. Source data are provided as a Source data file.
Fig. 6
Fig. 6. Maraviroc prevents bone loss caused by aged TCNs.
a μCT 3D reconstruction of trabecular bone and coronal sections of tibial metaphyses of NSG mice injected with TCNs from aged C57 mice plus vehicle or maraviroc treatment. Bar = 1 mm. bd Analysis of microstructure parameters in trabecular bones in (a), including trabecular bone volume (BV/TV) (b), number (Tb.N) (c) and separation (Tb.Sp) (d), and of bone mineral density (BMD) (e). Mean ± SD (n = 3, 4, and 4 biologically independent male mice for control, A-TCN and A-TCN plus maraviroc groups, respectively). f Representative images of TRAP- and H&E-stained tibial paraffin sections from NSG recipients as in (a) Bar = 50 μm. gi Osteoblast surfaces (Ob.S/BS) (g), osteoclast surfaces (Oc.S/BS) (h), and numbers (Oc.N/BS) (i) on metaphyseal trabecular surfaces. Mean ± SD (n = 3, 4, and 4 biologically independent male mice, respectively). Analyses: one-way ANOVA with Tukey’s post hoc test. Source data are provided as a Source data file.
Fig. 7
Fig. 7. Aged mice treated with maraviroc have fewer TCNs in BM and increased bone mass.
a, b Frequencies (a) and numbers (b) of TCNs in BM of 22-mon-old male C57 mice treated with vehicle or maraviroc (10 mg/kg) once/d s.c. for 1 month. Mean±SD (n = 9 and 10 biologically independent male mice for vehicle and maraviroc-treated groups, respectively). ce μCT 3D reconstruction of L1 vertebrae (c) and values for trabecular bone volume (BV/TV) (d) and thickness (Tb.Th) (e). Bar = 1 mm. Mean ± SD (n = 9 and 10 biologically independent male mice, respectively). fh Horizontal sections of μCT 3D reconstruction of cortical bones of L1 vertebrae (f) and values for cortical bone thickness (Cort.Th) (g) and bone mineral density (BMD) (h). Bar = 1 mm. Mean ± SD (n = 9 and 10 biologically independent male mice, respectively). (i, j) Bone formation parameters including mineral apposition rate (MAR) and bone formation rate (BFR) in L1 vertebrae. Mean ± SD (n = 9 and 10 biologically independent male mice, respectively). k H&E-stained sections of L2 vertebrae and l OB surface values. Bar = 50 μm. Mean ± SD (n = 9 and 10 biologically independent male mice, respectively). m Serum osteocalcin by ELISA. Mean ± SD (n = 5 and 4 biologically independent male mice, respectively). n TRAP-stained paraffin sections as in (k), OC numbers (o), and surfaces (p). Bar = 50 μm. Mean ± SD (n = 9 and 10 biologically independent male mice, respectively). q Serum TRACP-5b by ELISA. Mean ± SD (n = 5 and 4 biologically independent male mice, respectively). Analyses: Student’s two-sided unpaired t test. Source data are provided as a Source data file.
Fig. 8
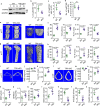
Fig. 8. Mice with TGFβRII deleted specifically in mesenchymal lineage cells have decreased numbers of TCNs in BM and increased bone mass.
a WB of bone protein lysates from 3- (young) and 15-mon-old (old) TGFβRIIfl/fl (WT) and 15-mon-old TGFβRIIfl/fl;Prx1Cre (TRII-cKO) mice. b, c Frequencies (b) and numbers (c) of Ly6C-6G+ cells in TGFβ1+CD11b+ myeloid cells in BM from 15-mon-old WT and TRII-cKO mice. Mean ± SD (n = 5 biologically independent male mice/group). d Ly6Chi6G- cells in TGFβ1+CD11b+ myeloid cells in BM from 15-mon-old WT and TRII-cKO mice. Mean ± SD (n = 5 biologically independent male mice/group). e Representative images of coronal sections of T12-L2 vertebrae and 3D reconstruction of trabecular bone in L1 from TβRII-cKO and WT mice. Bar = 1 mm. f Trabecular bone volume, number, thickness, and separation in L1 from WT and TRII-cKO mice. Mean ± SD (n = 3 female and 5 male biologically independent mice/group). g Sagittal sections and 3D reconstruction of trabecular bone in femora from TRII-cKO and WT mice. Bar = 1 mm. h Trabecular bone volume, number, thickness, and separation within the area 1 mm beneath the growth plate in WT and TRII-cKO mice. Mean ± SD (n = 3 female and 4 male biologically independent mice/group). i Horizontal cross sections of cortical bones of L1. j Measurements of bone mineral density (BMD) and (k) cortical bone thickness. Mean ± SD (n = 3 female and 5 male biologically independent mice/group). l Cross sections of femoral cortices, and BMD values (m) and cortical bone thickness (n). Mean ± SD (n = 3 female and 4 male biologically independent mice/group). o, p Mineral apposition rate (MAR) and bone formation rate (BFR). Mean ± SD (n = 3 female and 4 male biologically independent mice/group). q Osteoblast surface (Ob.S/B.S) from H&E-stained paraffin sections of L3 vertebrae. Bar = 20 μm. Mean ± SD (n = 3 female and 5 male biologically independent mice/group). r Serum levels of osteocalcin tested using ELISA. Mean ± SD (n = 5 biologically independent male mice/group). s, t Osteoclast surface (Oc.S/B.S) and number (Oc.N/B.S) from TRAP-stained paraffin sections. Mean ± SD (n = 3 female and 5 male biologically independent mice/group). u TRACP-5b levels in serum samples in (s) were tested using ELISA. Mean ± SD (n = 5 biologically independent male mice/group). Analyses: Student’s two-sided unpaired t test. Source data are provided as a Source data file.
Fig. 9
Fig. 9. Model for how TGFβ1-TRAF3 axis affects bone mass during aging.
During aging, increased TGFβ1 protein levels in the bone microenvironment cause decreased bone mass. TGFβ1 targets mesenchymal progenitor cells (MPCs) by binding to its receptors to trigger TRAF3 degradation, leading to excessive NF-κB-mediated CCL5 expression by MPCs. TGFβ1+CCR5+ neutrophils (TCNs), the major cellular source of TGFβ1 in BM, are recruited from peripheral blood into BM during aging, associated with increased CCL5 levels, resulting in inhibited osteoblast (OB) differentiation and enhanced osteoclast (OC) formation. As we reported previously, RANKL expression is increased in MPCs because of TRAF3 degradation and enhances osteoclast formation, which promotes release of more TGFβ1 into the bone microenvironment. This model supports a positive feedback loop in which TGFβ1 stimulates TRAF3 degradation and CCL5 expression by MPCs, and recruits more TCNs into BM. Interventions, such as specific deletion of TGFβRII expression by MPCs or CCR5 blockade by maraviroc, interrupt the positive feedback, and thus inhibit osteoclastogenesis and enhance osteoblast formation.

Similar articles

Cited by

References

    1. Franceschi C, Campisi J. Chronic inflammation (inflammaging) and its potential contribution to age-associated diseases. J. Gerontol. A Biol. Sci. Med. Sci. 2014;69:S4–S9. doi: 10.1093/gerona/glu057. - DOI - PubMed
    1. Leonardi GC, Accardi G, Monastero R, Nicoletti F, Libra M. Ageing: from inflammation to cancer. Immun. Ageing. 2018;15:1. doi: 10.1186/s12979-017-0112-5. - DOI - PMC - PubMed
    1. Furman D, et al. Chronic inflammation in the etiology of disease across the life span. Nat. Med. 2019;25:1822–1832. doi: 10.1038/s41591-019-0675-0. - DOI - PMC - PubMed
    1. Robinson WH, et al. Low-grade inflammation as a key mediator of the pathogenesis of osteoarthritis. Nat. Rev. Rheumatol. 2016;12:580–592. doi: 10.1038/nrrheum.2016.136. - DOI - PMC - PubMed
    1. Li J, et al. TNF receptor-associated factor 6 mediates TNFalpha-induced skeletal muscle atrophy in mice during aging. J. Bone Min. Res. 2020 doi: 10.1002/jbmr.4021. - DOI - PMC - PubMed

Publication types