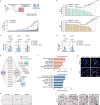
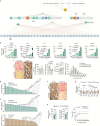
. 2023 Jan;613(7942):169-178.
doi: 10.1038/s41586-022-05535-x. Epub 2022 Dec 21.

Senescence atlas reveals an aged-like inflamed niche that blunts muscle regeneration

Affiliations

Senescence atlas reveals an aged-like inflamed niche that blunts muscle regeneration

Victoria Moiseeva et al. Nature. 2023 Jan.

Erratum in

Abstract

Tissue regeneration requires coordination between resident stem cells and local niche cells1,2. Here we identify that senescent cells are integral components of the skeletal muscle regenerative niche that repress regeneration at all stages of life. The technical limitation of senescent-cell scarcity3 was overcome by combining single-cell transcriptomics and a senescent-cell enrichment sorting protocol. We identified and isolated different senescent cell types from damaged muscles of young and old mice. Deeper transcriptome, chromatin and pathway analyses revealed conservation of cell identity traits as well as two universal senescence hallmarks (inflammation and fibrosis) across cell type, regeneration time and ageing. Senescent cells create an aged-like inflamed niche that mirrors inflammation associated with ageing (inflammageing4) and arrests stem cell proliferation and regeneration. Reducing the burden of senescent cells, or reducing their inflammatory secretome through CD36 neutralization, accelerates regeneration in young and old mice. By contrast, transplantation of senescent cells delays regeneration. Our results provide a technique for isolating in vivo senescent cells, define a senescence blueprint for muscle, and uncover unproductive functional interactions between senescent cells and stem cells in regenerative niches that can be overcome. As senescent cells also accumulate in human muscles, our findings open potential paths for improving muscle repair throughout life.


Conflict of interest statement

The authors declare no competing interests.

Figures

Fig. 1
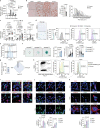
Fig. 1. Senescent cells in regenerating muscle of young and old mice.
ae, Representative images and quantification. a, Luciferase activity in the muscles of young (3–6 months) p16-3MR mice at the indicated d.p.i. with CTX. p s−1, photons per second. n = 18 muscles from 12 mice (basal), 7 muscles from 5 mice (3 d.p.i.), 7 muscles from 6 mice (7 d.p.i.) and 4 muscles from 3 mice (14 d.p.i. and 21 d.p.i.). b, SA-β-gal+ cells in the TA of young mice (n = 5 (0, 3 and 21 d.p.i.), n = 7 (7 d.p.i.) and n = 9 (14 d.p.i.) mice) or old mice (aged more than 28 months; n = 4 (0 and 3 d.p.i.), n = 9 (7 d.p.i.) and n = 3 (14 and 21 d.p.i.) mice). c, cells with telomeric DDR (telo) in basal and 3 d.p.i. TA from young mice (n = 5 (basal) and n = 7 (3 d.p.i.) mice) and old mice (n = 5 (basal) and n = 8 (3 d.p.i.) mice). d, SA-β-gal and CDKN2A+ immunohistochemistry of uninjured or damaged human muscle samples (n = 5 samples per group; aged 81 ± 7.5 years). The arrows show double-positive cells. e, Ki-67 positivity (n = 4 mice per group) and γH2AX intensity (n = 4 mice per group) in SPiDER+ and SPiDER cells in 4 d.p.i. TA. AU, arbitrary units; MFI, mean fluorescence intensity. f, Complete 21,449-cell transcriptomic atlas from SPiDER+ and SPiDER samples of 3 d.p.i. young muscles (right). Data are shown as a uniform manifold approximation and projection (UMAP) to visualize variation in single-cell transcriptomes. Unsupervised clustering resolved at least eight cell types (colour coded). Left, SPiDER+ cells ascribed to main populations. APC, antigen-presenting cell; DCs, dendritic cells; NK, natural killer. g, The overlap between differentially expressed genes in SCs, FAPs and MCs at 3 d.p.i. from scRNA-seq (Sen versus NSen, false-discovery rate (FDR) < 0.05). Scale bars, 50 μm (b and d, low magnification), 10 μm (c and e, low magnification) and 5 μm (ce, high magnification). For ae, data are mean ± s.e.m. P values were calculated using Tukey’s tests (a) and Mann–Whitney U-tests (be). Source data
Fig. 2
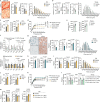
Fig. 2. Cellular senescence hampers muscle regeneration throughout life.
a, Representative images and quantification of the cross-sectional area (CSA) of embryonic myosin heavy chain (MYH3)-positive fibres in regenerating TA from vehicle- or GCV-treated old (n = 5 TA from 3 mice (vehicle) and n = 6 TA from 3 mice (GCV)) and young (n = 6 TA from 4 mice (vehicle) and n = 8 TA from 4 mice (GCV)) p16-3MR mice at 7 d.p.i. b, Specific force–frequency curves of EDL muscles of vehicle- or GCV-treated young (n = 11 EDL from 7 mice (vehicle) and n = 9 EDL from 7 mice (GCV)) and old (n = 5 EDL from 4 mice (vehicle) and n = 7 EDL from 5 mice (GCV)) p16-3MR mice at 10 d.p.i. c, Specific force–frequency curves as described in b, but for vehicle- and D+Q-treated young (n = 8 EDL from 5 mice (vehicle) and n = 7 EDL from 5 mice (D+Q)) and old (n = 5 EDL from 3 mice (vehicle) and n = 7 EDL from 5 mice (D+Q group)) mice at 10 d.p.i. d, An equal number of SPiDER+ or SPiDER cells from young 3 d.p.i. regenerating muscles were stained with Dil and transplanted into the preinjured TA of young recipient mice for 4 days. n = 4 mice per group. Strategy schematic, representative images and quantification of the CSA of MYH3+ fibres are shown. The schematic in d was created using Servier Medical Art, CC BY 3.0. Scale bars, 50 μm (a and d). For ad, data are mean ± s.e.m. P values were calculated using two-way analysis of variance (ANOVA) and mixed-effects analysis (b and c) and Mann–Whitney U-tests (a and d). Source data
Fig. 3
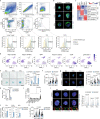
Fig. 3. Tissue injury and ageing prime niche cells for senescence through oxidative stress and DNA damage.
a, Common upregulated and downregulated gene sets (gene set enrichment analysis (GSEA), FDR < 0.25) related to the indicated functions in Sen versus NSen SCs, FAPs and MCs from young and old mice at 3 d.p.i. b, Representative images of γH2AX and quantification of γH2AX (n = 24 SCs (basal), 91 SCs (NSen), 78 SCs (Sen), 26 FAPs (basal), 34 FAPs (NSen), 35 FAPs (Sen), 20 MCs (basal), 22 MCs (NSen) and 29 MCs (Sen)) and CellRox levels (n = 24 SCs (basal), 95 SCs (NSen), 98 SCs (Sen), 26 FAPs (basal), 81 FAPs (NSen), 104 FAPs (Sen), 20 MCs (basal), 93 MCs (NSen) and 97 MCs (Sen)) in sorted SC, FAP and MC populations from basal and regenerating muscles at 3 d.p.i. c, Quantification of 8-oxoguanine (8-oxoG) levels in sorted ROShigh and ROSlow SCs and FAPs from young muscle at 1 d.p.i. (n = 27 SCs (ROSlow), n = 40 SCs (ROShigh), n = 66 FAPs (ROSlow) and n = 50 FAPs (ROShigh)). d, ROShigh and ROSlow SCs and FAPs were isolated from regenerating muscle at 1 d.p.i., and were cultured in vitro for 3 days with or without NAC. Quantification of SA-β-gal+ cells in each population compared with basal cells. n = 3 mice per group. e, Young p16-3MR mice were injured with CTX and treated with NAC during regeneration. Left, Renilla luciferase activity in the TA at 4 d.p.i. n = 6 TA muscles from 6 mice (vehicle) and n = 8 TA muscles from 4 mice (NAC group). Right, quantification of SA-β-gal+ cells. n = 5 TA muscles from 4 mice in each group. For b, scale bar, 10 μm. For b, d and e, data are mean ± s.e.m. P values were calculated using Tukey’s tests (d) and Mann–Whitney U-tests (b, c and e). Source data
Fig. 4
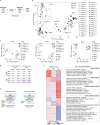
Fig. 4. Two major common hallmarks define senescent cells across cell types, regeneration stage and lifespan.
a, Clusters of gene sets (GSEA) differentially enriched from Sen versus NSen SCs, FAPs and MCs from young or old mice at 3 or 7 d.p.i. Gene sets were considered to be common with FDR < 0.25 in at least 8 out of 12 comparisons. Node size is proportional to the number of genes identified in each gene set. The grey edges indicate gene overlap. b, Common clusters of gene sets (GSEA) from Sen versus NSen and Sen versus basal SCs, FAPs and MCs from young or old mice at 3 or 7 d.p.i. Gene sets were considered to be common with FDR < 0.25 in at least 8 out of 12 comparisons for Sen versus NSen and Sen versus basal. c, Chord diagram showing transcription factors that regulate the differentially expressed genes in Sen versus NSen and their categories. The green-to-orange scale indicates the average predicted transcription factor activity. The blue-to-red scale indicates the average base 2 logarithm fold change (log2[FC]) of a transcription factor target in Sen versus NSen cells. Chord width is proportional to the significance (−log10[FDR]) of canonical pathway and Gene Ontology biological process (GO:BP) enrichment (gprofiler2) within a given functional category. Source data
Fig. 5
Fig. 5. Senescent cells create an aged-like microenvironment in young regenerative niches through pro-inflammatory and pro-fibrotic factor secretion.
a, SASP-related gene set enriched clusters from Sen SCs, FAPs and MCs of young mice at 3 d.p.i. (FDR < 0.05). The grey edges indicate gene overlap. Differentially upregulated genes (FDR < 0.05) were considered to be SASP genes when overexpressed in Sen versus their NSen populations. b, Comparison of enrichments for differential RNA expression in tissues from aged mice, rats, humans, killifish and senescent populations from young 3 d.p.i. muscles. Cbm, cerebellum. c, The overlap between secreted proteins in cells of young and aged muscle. d, Chord diagram showing transcription factors that regulate SASP genes and their categories in Sen versus NSen. Chord width is proportional to the significance (−log10[FDR]) of GO molecular function (GO:MF) cluster enrichment. ECM, extracellular matrix. e, SPiDER+ and SPiDER cells from 3 d.p.i. young muscle were stained with Dil and transplanted into the preinjured TA of recipient mice for 4 days. n = 4 mice per group. Quantification of SA-β-gal+ and CD11b+ cells, and Sirius Red staining. f, As described in e, but senescent and non-senescent C2C12 cells were transplanted into young p16-3MR mice for 5 days. Images and quantification of luciferase-activity. n = 4 mice (non-senescent) and n = 5 mice (senescent). g, As described in e, but quantification of γH2AX in Pax7+ cells (n = 109 cells (SPiDER) and n = 100 cells (SPiDER+)). h, CTX-injured p16-3MR mice were treated daily with GCV or vehicle until 4 d.p.i. (n = 5 TA muscles from 3 mice (vehicle) and n = 6 TA muscles from 3 mice (GCV)). Left, images and quantification of EdU or Pax7 staining. Right, BrdU incorporation in SCs in vitro. At 3 d.p.i., SCs were sorted and cultured for 3 days. n = 4 mice per group. i, SPiDER SCs were isolated from 3 d.p.i. muscles, and cultured for 3 days in Transwells with total SPiDER+ or SPiDER cells or culture medium, and analysed for BrdU incorporation. n = 3 mice per group. j, EDL muscles from WT or p16-3MR-donor mice were transplanted into WT or p16-3MR recipient mice (or vice versa). The recipient mice were treated daily with GCV, and regeneration was analysed at 7 d.p.i. The CSA of MYH3+ fibres (n = 8 (WT/WT), n = 6 (p16-3MR/WT) and n = 7 (other groups) mice) and SA-β-gal+ cells (n = 7 mice per group). k, SPiDER+ and SPiDER SCs, FAPs or MCs (n = 5 mice (SCs) and n = 4 mice (FAPs and MCs)) transplanted as in e. The CSA of MYH3+ fibres. For ek, data are mean ± s.e.m. P values were calculated using Tukey’s tests (i and j) and Mann–Whitney U-tests (eh and k). Source data
Fig. 6
Fig. 6. CD36 neutralization improves muscle regeneration through a senomorphic action.
a, SPiDER+ and SPiDER populations from 3 d.p.i. muscle stained with Oil Red O and haematoxylin. Images and lipid-droplet quantification. n = 90 SCs (NSen), 51 SCs (Sen), 89 FAPs (NSen), 90 FAPs (Sen), 45 MCs (NSen) and 94 MCs (Sen). b, Heat map showing lipid-transport-related genes that are differentially expressed in at least 3 out of 12 comparisons between Sen and NSen cells. The colour indicates the log2-transformed fold change in expression. c, Images and CD36 quantification in SPiDER+ and SPiDER populations from 3 d.p.i. muscles. n = 44 SCs (NSen), 50 SCs (Sen), 56 FAPs (NSen), 62 FAPs (Sen), 55 MCs (NSen) and 56 MCs (Sen). d, SA-β-gal+ cells in the injured TA area of aged mice (treated with anti-CD36 antibodies or control IgA). n = 8 TA from 4 mice for both groups. e, The overlap between SASP-upregulated genes in 7 d.p.i. senescent populations of old mice, and those reduced by anti-CD36 treatment. f, The CSA and frequency distribution of MYH3+ fibre size (n = 6 TA from 4 mice for both groups) and Sirius Red staining (n = 8 TA from 4 mice for both groups) of 7 d.p.i. TA from old mice treated with anti-CD36-antibody antibodies or control IgA. g, Injured EDL of old mice treated with anti-CD36 antibodies or control IgA. (n = 6 EDL from 3 mice (IgA) and n = 5 EDL from 4 mice (anti-CD36)). Force–frequency curves are shown. h, SPiDER+ and SPiDER cells from 3 d.p.i. muscles were transfected with siCd36 or siScramble, stained with Dil and transplanted into the preinjured recipient TA. Images and the CSA of MYH3+ fibres 4 days after transplantation. n = 6 (siScramble-treated SPiDER+ and SPiDER cells) and n = 4 (siCd36-treated SPiDER+ and SPiDER cells) mice. i, SCs (from 3 d.p.i. muscles) were cultured for 3 days in Transwells with senescent or non-senescent C2C12 cells that were previously treated with siCd36 or siScramble, or without cells. BrdU incorporation is shown. n = 4 (empty Transwell) and n = 3 (other groups) mice. Scale bars, 10 μm (a and c) and 50 μm (h). For a, c, d and fi, data are mean ± s.e.m. P values were calculated using Mann–Whitney U-tests (a, c and f), mixed-effects analysis (g) and Tukey’s tests (h and i); NS, not significant. Source data
Extended Data Fig. 1
Extended Data Fig. 1. Characteristics of senescent cells in regenerating muscle of young and old mice.
a) Quantification of Renilla luciferase activity in regenerating muscle from young and old mice at the indicated d.p.i. The luciferase activities are normalized to the activity of basal young muscle (n = 6 mice for young basal, 8 muscles from 6 mice for young 3 d.p.i., 8 muscles from 4 mice for young 7 d.p.i., 7 muscles from 5 mice for young 10 d.p.i., 5 mice for old basal, 5 muscles from 4 mice for old 3 d.p.i., 6 muscles from 4 mice for old 7 d.p.i., and 7 muscles from 4 mice for old 10 d.p.i.). b) Representative images and quantification of CSA and frequency distribution analysis of MYH3+ fibre size in TA muscles from young and old mice at 7 d.p.i. (n = 9 TA from 6 mice for young and 5 mice for old). c) RT-qPCR of mRFP, Cdkn2a, and p19ARF in young and old muscle tissue from p16-3MR mice at the indicated d.p.i. (n = 4 mice in mRFP and Cdkn2a for old 3 d.p.i., 5 TA from 3 mice for old 7 d.p.i., 5 TA from 4 mice for young 7 d.p.i., 5 mice in mRFP, for young basal and 3 d.p.i. and Cdkn2a for young 3 d.p.i., 6 TA from 5 mice in p19ARF for old 3 d.p.i., 6 mice in Cdkn2a and p19ARF for young basal and p19ARF for young 3 d.p.i., and 8 mice for old basal). d) Freshly isolated SCs were obtained from skeletal muscle tissue and cultured in the presence of etoposide (1 μM) or DMSO for 4 days. Cells were stained with SPiDER, C12FDG, or SA-β-gal staining in parallel and analysed by flow cytometry or microscopy to assess their entry into senescence (n = 4 mice/group). Unstained samples were used to determine the threshold for C12FDG and SPiDER populations. Histogram representation of SPiDER intensity, representative images of SA-β-gal and quantification are shown. e) Histogram representation of SPiDER-β-gal staining and gating strategy employed for isolation of SPiDERLow, SPiDERMedium, and SPiDERHigh populations from injured skeletal muscle at 3 d.p.i. f) Representative images and quantification of SA-β-gal staining (n = 4 mice/group), cell area (n = 205 SPiDERLow cells, 168 SPiDERMedium cells, and 220 SPiDERHigh cells), and lamin B1 expression (n = 36 SPiDERLow cells, 33 SPiDERMedium and SPiDERHigh cells) in freshly sorted SPiDERLow, SPiDERMedium, and SPiDERHigh from regenerating muscles at 3 d.p.i. g) Graphs representing multimarker senescence scoring in freshly sorted SPiDER+ population from 3 d.p.i. regenerating tissue of young mice. Scoring was calculated with cell size, SA-β-gal, lamin B1, and proliferation rate (Fig. 1e and Extended Data Fig. 1f; see Methods). h) Gating strategy used to isolate SPiDER+ cells from regenerating muscle tissue of young mice at 3 d.p.i. Cells were divided into two major populations with anti-CD45 antibodies to overcome differences in auto-fluorescence of hematopoietic and non-hematopoietic populations. Fluorescence Minus One (FMO) and samples from non-injured muscle tissue were used to set the threshold for SPiDER+ staining within each cell population. i) Representative immunofluorescence images showing CDKN2A+ and γH2Ax+ cells in proximity to SCs, FAPs and MCs identified with anti-Pax7, anti-PDGFRα and anti-F4/80 antibodies, respectively, in regenerating muscles of young mice at 4 d.p.i.. Arrows indicate CDKN2A+ and γH2Ax+ cells. j) Representative images and quantification of CDKN2A+ cells (n = 4 mice/group) and γH2Ax+ cells (n = 5 mice for SCs, 3 mice for FAPs, and 4 mice for MCs) in regenerating muscles from young mice at 4 d.p.i. Each cell type was labelled with indicated antibodies and nuclei with 4,6-diaminido-2-phenylindole (DAPI). Arrows indicate CDKN2A+ cells. k) Representative images and quantification of 53BP1+ cells in regenerating human muscle. Each cell type was labelled with indicated antibodies, and nuclei with DAPI (n = 4 samples/group, from persons aged 81±7.5 years old). Scale bars: 50 μm (b); 10 μm (d, f, i, j, and k low magnification) and 5 μm (k high magnification). Results are displayed as means±s.e.m; P values were calculated by Mann–Whitney U-test (a between ages, c between ages, b and d), and Tukey’s test (a between d.p.i., c between d.p.i., f, j, and k). Source data
Extended Data Fig. 2
Extended Data Fig. 2. Removal of senescent cells improves skeletal muscle regeneration after acute damage throughout life.
Young and old p16-3MR mice were subjected to CTX injury, treated with vehicle or GCV during the course of regeneration and analysed at 7 d.p.i. a) Representative images of Sirius Red staining and quantification of SA-β-gal+ cells in damaged area (n = 5 TA from 4 mice for vehicle and 6 TA from 3 mice for GCV), Sirius Red staining (n = 4 TA from 3 mice for vehicle and 5 TA from 3 mice for GCV), and frequency distribution analysis of positive MYH3 fibre size (n = 3 mice/group) in cryosections from old p16-3MR mice. b) Quantification of in vivo Renilla luminescence activity (n = 6 TA from 3 mice for vehicle and 10 TA from 5 mice for GCV), SA-β-gal+ cells (n = 6 TA from 4 mice for vehicle and 8 TA from 4 mice for GCV), Sirius Red staining (n = 8 TA from 5 mice for vehicle and 10 mice from 5 mice for GCV), and frequency distribution analysis of positive MYH3 fibre size (n = 4 mice/group) in cryosections from vehicle- and GCV-treated young p16-3MR mice. c) Force measurements in EDL muscles of vehicle- or GCV-treated old p16-3MR mice at 10 d.p.i. (n = 5 EDL muscles from 4 mice for vehicle and 7 EDL from 5 mice for GCV). d) Force-frequency curves measured in EDL muscles of vehicle- or GCV-treated young (n = 11 EDL from 7 mice in vehicle and 9 EDL from 7 mice in GCV group) and old (n = 5 EDL from 4 mice in vehicle and 7 EDL from 5 mice in GCV group) p16-3MR mice at 10 d.p.i. e) Force measurements in EDL muscles of vehicle- or GCV-treated young p16-3MR mice at 10 d.p.i. (n = 11 EDL muscles from 8 mice for vehicle and 9 EDL from 7 mice for GCV). f) RT-qPCR of Il6, Il1b, Tnf, Il12, Ccl2, Il18, and Ifng in muscle tissue from young (top, n = 5 TA muscles in Tnf, Il12 and Ccl2, and 6 TA muscles in Il6, Il1b, Il18 and Ifng from 4 mice for vehicle and 4 mice for GCV) and old (bottom, n = 4 TA muscles from 3 mice for vehicle and 6 TA muscles in Tnf and 5 TA in Il6, Il1b, Il12, Ccl2, Il18, Ifng from 3 mice for GCV) p16-3MR mice. g) Muscles of young WT mice were injured with CTX and treated with vehicle or senolytics during regeneration and analysed at 7 d.p.i. Representative images, SA-β-gal staining (n = 10 TA from 5 mice for vehicle and 6 TA from 3 mice for D+Q), mean CSA (n = 9 TA from 6 mice for vehicle and 5 TA from 3 mice for D+Q) and frequency distribution analysis (n = 3 mice/group) of MYH3+ fibres, and Sirius Red quantification (n = 6 TA from 3 mice for both groups) in TA cryosections from young WT mice. h) Force measurements in EDL muscles of vehicle- and D+Q-treated young mice at 10 d.p.i. (n = 8 EDL from 5 mice in vehicle and 7 EDL from 5 mice in D+Q group). i) As in g, SA-β-gal staining, mean CSA and frequency distribution analysis of MYH3+ fibres and Sirius Red quantification in TA cryosections from old WT mice (n = 5 mice/group) . j) As in h, force measurements in EDL muscles of vehicle- and D+Q-treated old mice at 10 d.p.i. (n = 5 EDL from 3 mice in vehicle and 7 EDL from 5 mice in D+Q group). k) Force-frequency curves measured in EDL muscles of vehicle- and D+Q-treated young (n = 8 EDL from 5 mice in vehicle and 7 EDL from 5 mice in D+Q group), and old (n = 5 EDL from 3 mice in vehicle and 7 EDL from 5 mice in D+Q group) mice at 10 d.p.i. l) SA-β-gal+ cells and mean CSA in vehicle- or GCV-treated young p16-3MR mice after 4-days or 7-days treatment at 7 d.p.i. (n = 6 muscles from 4 mice for vehicle (3 to 7), 8 muscles from 4 mice GCV (3 to 7), 4 mice for vehicle (0 to 7), and 5 mice for GCV (0 to 7)). m) Quantification of SA-β-gal, Sirius Red staining (n = 5 mice for vehicle and D+Q (3 to 7) and 8 muscles from 4 mice for D+Q (0 to 7)), and mean CSA of MYH3+ fibres (n = 5 mice for vehicle and D+Q (3 to 7) and 6 muscles from 3 mice for D+Q (0 to 7)) in vehicle- and D+Q- treated old mice after 4-days or 7-days treatment at 7 d.p.i. (n = 5–8 muscles from 4-5 mice). Treatments were administered from 3 to 7 d.p.i. in b, g, and i, from 0 to 7 d.p.i. in a, b, and f and from 3 to 10 d.p.i. in c, d, e, h, j and k. Scale bars 50 μm. Results are displayed as mean ± s.e.m.; P values were calculated by two-way ANOVA and Mixed-effects analysis (d and k) and Mann–Whitney U-test (a, b, c, e, f, g, h, i, j, l and m). Source data
Extended Data Fig. 3
Extended Data Fig. 3. Removal of senescent cells improves skeletal muscle regeneration after microdamage and after chronic damage.
a) Quantification of in vivo Renilla luciferase activity in young p16-3MR mice at the indicated days after injury by micropunctures (n = 13 mice for Basal, 3 mice for 3 d.p.i., 5 mice for 7 d.p.i., and 4 mice for 12 d.p.i.). b) Representative images of SA-β-gal and MYH3 staining in cryosections of TA muscles from young WT mice at the indicated days after injury by micropunctures and quantification of SA-β-gal are shown (n = 5 mice for basal, 6 mice for 3 d.p.i. and 5 d.p.i., and 4 mice for 7 d.p.i.). c) Young p16-3MR mice were subjected to micropunctures in TA muscles and treated for 7 days with GCV, starting from the day of injury, sacrificed at 7 d.p.i. and TA muscles were analysed. Representative images of hematoxylin and eosin (H/E) staining and quantification of in vivo Renilla luminescence activity in TA (n = 6 TA from 4 mice for vehicle and 8 TA from 4 mice for GCV), SA-β-gal+ cells (n = 6 TA from 4 mice for both groups), CSA of centrally nucleated fibres and Sirius Red staining (n = 4 mice/group). d) Young WT mice were subjected to micropunctures injury in TA muscles and treated for 7 days with D+Q, starting from the day of injury. Quantification of SA-β-gal+ cells (n = 4 mice/group), CSA of centrally nucleated fibres in cryosections (n = 9 TA from 5 mice for vehicle and 10 TA from 5 mice for D+Q), Sirius Red staining (n = 8 TA from 4 mice for vehicle and 10 TA from 5 mice for D+Q). e) As in c, mRNA quantification of the indicated genes by RT-qPCR in TA muscles (n = 5 mice in Il6, Il1b, and Tnf and 6 mice in, Il12, Ccl2, and Il18 for vehicle and 5 TA from 4 mice for GCV). f) Quantification of SA-β-gal+ cells in uninjured TA muscles from WT and mdx mice at indicated age (n = 9 mice WT3months and mdx5–7months, 3 mice WT5–7months, and 8 mice mdx3months). g) In vivo quantification of Renilla luminescence activity in basal muscles of p16-3MR and mdx/p16-3MR mice at indicated age (n = 6 mice p16-3MR3months and p16-3MR5–7months and 5 muscles from 3 mice mdx3months and mdx5–7months). h) mRNA quantification of the indicated genes by RT-qPCR in TA muscles from young WT and mdx/p16-3MR mice of 5 months of age (n = 5 mice in Ifng and Ccl2 and 6 mice for the rest of the genes for WT and 4 mice in p19ARF and 5 mice for the rest of the genes for mdx/p16-3MR). i) Representative images of SA-β-gal and MYH3 staining in cryosections of TA muscles from young WT and mdx mice. j) Young mdx/p16-3MR mice received GCV twice a week for 2 months and were sacrificed at 5 months of age. Representative images are shown for Sirius Red staining as well as for quantification of SA-β-gal+ cells, Sirius Red staining, CSA and frequency distribution of regenerating fibres in TA muscles of vehicle- or GCV-treated mdx/p16-3MR mice (n = 6 mice for vehicle and 4 mice for GCV). k) Young mdx/p16-3MR mice were treated with GCV of vehicle for 2 months and force measurements were performed in EDL muscles at 5 months of age. Graphs represent maximum and specific force parameters and force-frequency curves (n = 9 EDL from 6 mice for vehicle and 5 EDL from 3 mice for GCV). l) Young mdx mice received D+Q twice a week for 2 months and muscle samples were collected at 5 months of age. Maximum and specific force parameters and force-frequency curves in EDL muscles are represented (n = 8 EDL muscles from 5 mice for vehicle and 7 EDL from 6 mice for D+Q). m) Quantifications of SA-β-gal+ cells, mean CSA and frequency distribution of regenerating fibres and Sirius Red staining in muscle cryosections (n = 5 mice/group) of vehicle- and D+Q-treated mdx mice after 2 months of treatment. Scale bars 50 μm. Results are displayed as mean ± s.e.m.; P values were calculated by Tukey’s test (a and b), two-way ANOVA and Mixed-effects analysis in (k and l force-frequency curves) and Mann–Whitney U-test (c, d, e, f, g, h, j, k, l and m). Source data
Extended Data Fig. 4
Extended Data Fig. 4. Isolation and characterization of different senescent cell types.
a) Gating strategy used to simultaneously isolate SCs, FAPs, and MCs from WT mice. Representative histogram plots from cytofluorimetric analysis are employed to assess SPiDER levels in the cell populations. FMO controls and non-injured samples were used to determine the threshold for SPiDER within each cell population. b) Representative pictures of Pax7, TCF4 and CD11b expression in sorted SCs, FAPs and MCs respectively. c) Heatmap of gene expression levels of the indicated genes in basal, NSen and Sen SCs, FAPs and MCs. d) Single-cell expression levels for select gene markers. e) Representative images and quantification of SA-β-gal staining of freshly sorted SPiDER+ and SPiDER SCs, FAPs, and MCs from regenerating muscles at 3 d.p.i. (n = 3 mice/group). f) As in e, quantification of the cell area (n = 79 SCsNSen, 55 SCsSen, 94 FAPsNSen, 75 FAPsSen, 106 MCsNSen, and 66 MCsSen). g) Representative images and quantification of lamin B1 expression of freshly sorted SPiDER+ and SPiDER SCs, FAPs, and MCs from regenerating muscles at 3 d.p.i., (n = 20 SCsNSen, 15 SCsSen, 33 FAPsNSen, 35 FAPsSen, 21 MCsNSen, and 30 MCsSen; arbitrary units: AU). h) BrdU incorporation was quantified in cells obtained at 7 d.p.i. and cultured for 3 days (n = 4 mice in SCsNSen and SCsSen, 7 mice in FAPsNSen, and 6 mice in FAPsSen). i) Quantification of TUNEL assay in freshly sorted SPiDER+ and SPiDER SCs, FAPs and MCs. Cells treated with DNase were used as a positive control (n = 64 SCsNSen, 63 SCsSen, 55 FAPsNSen, 73 FAPsSen, 67 MCsNSen, 56 MCsSen, 32 neg. control and 101 pos. control cells). j) RT-qPCR of Cdkn2a in freshly sorted SPiDER+ and SPiDER SCs, FAPs, and MCs from regenerating muscles at 3 d.p.i. (n = 4 mice/group). k) As in e, quantification of 8-oxoG (n = 47 SCsNSen, 49 SCsSen, 60 FAPsNSen, 74 FAPsSen, 65 MCsNSen, and 65 MCsSen). l) Representative images and quantification of telomeric DDR in SPiDER+ and SPiDER sorted cells from regenerating muscle of young mice at 3 d.p.i. (n = 53 SCsNSen, 64 SCsSen, 45 FAPsNSen, 47 FAPsSen, 46 MCsNSen, and 45 MCsSen). Scale bars, 10 μm (e and g), 5 μm (l low magnification), and 1 μm (b and l high magnification). Results are displayed as mean ± s.e.m.; P values from multiple t-tests (e), Tukey’s test (i), and Mann–Whitney U-test (f, g, h, j, k and l). Source data
Extended Data Fig. 5
Extended Data Fig. 5. RNAseq analysis of the different senescent cell types throughout life.
a) Scheme showing 36 different conditions (3 cell types x 12 conditions) assessed by RNA-seq. b) Principal component analysis (PCA) of the full transcriptome of senescent (Sen), non-senescent (NSen), and Basal SCs, FAPs, and MCs isolated from resting (Basal) and regenerating muscles of young and old mice at 3 and 7 d.p.i. c) PCA of Sen, NSen, and Basal SCs, FAPs, and MCs from basal and regenerating muscles at 3 d.p.i. of young and old mice. d) Scheme indicating the number of differentially expressed genes in Sen vs NSen SCs, FAPs, and MCs from young and old mice at 3 and 7 d.p.i. (FDR <0.05). e) Venn-diagram showing the overlap between differentially expressed genes in SCs, FAPs, and MCs from young mice at 3 d.p.i. (Sen vs NSen were compared, FDR <0.05). f) Heatmap of genes that were differentially expressed (DE) uniquely by one population of interest and the corresponding canonical pathways enrichment (CP) analysis (g:Profiler web server). The heatmap shows log2FC for Sen versus (vs) their NSen counterparts isolated from regenerating muscles of young mice at 3 d.p.i. Source data
Extended Data Fig. 6
Extended Data Fig. 6. Further RNAseq analysis of the different senescent cell types.
a) (top) Heatmap of unique and common differentially expressed genes in young (Y) or old (O) Sen FAPs and CP enrichment (g:Profiler web server) of exclusively differentially expressed genes in G conditions. (bottom) Venn-diagram showing the overlap between differentially expressed genes of Sen FAPs from young and old mice at 3 d.p.i. b) As in a for MCs. c) As in a for SCs. d) Clusters of gene sets (GSEA) differentially enriched at 3 d.p.i. in old Sen populations, but not in young Sen populations. Gene sets were considered common with FDR < 0.25 for all 3 old Sen populations with the exclusion of gene sets common for at least 2 young Sen populations. Node size is proportional to the number of genes identified in each gene set. Grey edges indicate gene overlap. Source data
Extended Data Fig. 7
Extended Data Fig. 7. Comparison of the senescence and basal transcriptomes, and of the basal transcriptomes throughout life. Fibrosis and inflammation inold muscles.
a) Clusters of gene sets (GSEA) differentially enriched from Sen vs Basal SCs, FAPs, and MCs from young and old mice at 3 d.p.i. Gene sets were considered common with FDR < 0.25 in at least 5/6 comparisons. Node size is proportional to the number of genes identified in each gene set. Grey edges indicate gene overlap. b) Heatmap of gene sets enriched in DE genes from Old vs Young SCs, FAPs, and MCs (g:Profiler web server, FDR < 0.05) isolated from non-injured muscle tissue. c) Quantification of Sirius Red in TA muscles from young and old mice (n = 3 mice in young and 5 mice in old). d) mRNA quantification by RT-qPCR of indicated genes in TA muscles from young and old mice (n = 6 mice in Cdkn2a, p19ARF, Il1b and Tnf and 5 mice in the rest of genes for young group, 7 mice in Cdkn2a and Il1b and 8 mice in the rest of genes for old group). Results are displayed as mean ± s.e.m.; P values were calculated using a Mann–Whitney U-test (c and d). Source data
Extended Data Fig. 8
Extended Data Fig. 8. Commonly differentially expressed genes in senescence transcriptomes and qPCR validation of selected genes.
a) Venn-diagram showing the overlap between differentially expressed genes in SCs, FAPs, and MCs from old mice at 3 d.p.i. (Sen vs NSen were compared, FDR < 0.05). b) Heatmap of commonly regulated genes in Sen SCs, FAPs, and MCs from young and old mice at 3 and 7 d.p.i. (FDR <0.05 in at least 8/12 comparisons). c) mRNA quantification by RT-qPCR of indicated genes in SPiDER+ and SPIDER SCs, FAPs, and MCs isolated from regenerating muscles of young (n = 4 mice in Ccl2 for SCsNSen, 5 mice in Ccl8, Cxcl10, Apoe, Igfbp7, Col3a1 for SCsNSen, Ccl2, Ccl8, Igfbp7 for SCsSen, 6 mice in Igfbp4, Col6a3, Timp2 for SCsNSen, Cxcl10, Apoe, Col3a1, Col6a3, Timp2 for SCsSen, Cxcl10 for FAPsNSen, Ccl2, Cxcl10, Igfbp4 for FAPsSen, Ccl2, Cxcl10, Igfbp4, Igfbp7, Col6a3 for MCsNSen, Cxcl10, Col3a1, Col6a3 for MCsSen and 7 mice for the rest of the genes and groups) and old mice (n = 4 mice in Cxcl10 and Igfbp7 for SCsSen and Igfbp7 for MCsNSen, 5 mice in Igfbp7 for SCsNSen, Ccl2, Ccl8, Apoe, Igfbp4, Col3a1, Col6a3, and Timp2 for SCsSen, Igfbp4 for MCsNSen and all genes for FAPsSen, 7 mice for Ccl2, Ccl8, Cxcl10, Apoe, Igfbp4, Col3a1, and Col6a3 for SCsNSen, Ccl2, Apoe, Igfbp4, Igfbp7, Col3a1, Col6a3, Timp2 for MCsSen, and 6 mice for the rest of the genes and groups) at 3 d.p.i. d) Common clusters of gene sets (GSEA) from Sen vs NSen and Sen vs basal SCs, FAPs and MCs from young and old mice at 3 and 7 d.p.i. Gene sets were considered common with FDR < 0.25 in at least 8/12 comparisons for Sen vs NSen and Sen vs basal. Node size is proportional to the number of genes identified in each gene set. Grey edges indicate gene overlap. Results are displayed as mean ± s.e.m.; P values were calculated by Mann–Whitney U-test (c). Source data
Extended Data Fig. 9
Extended Data Fig. 9. ATACseq analysis of the different senescent cell types throughout life.
a) Differential ATAC-seq peaks for Sen vs NSen SCs, FAPs, and MCs from old mice at 3 and 7 d.p.i. Left: log2FC plotted against log2-transformed average peak intensity (peak score); the green line shows the position of each average peak score on the log2FC axis; the number of peaks with log2FC >1 or ≤1 is indicated. b) Normalized ATAC-seq signal profiles in the indicated gene regions from Sen vs NSen SCs, FAPs, and MCs from young and old mice at 7 d.p.i. c) Heatmap representing transcription factors and co-regulators of transcription enriched in at least 11/12 comparisons for Sen vs NSen with average Trust score > 1 (see Methods). Colour codes reflect the activity predicted based on analysis of differential expression (DESeq2), upstream regulators analysis (QIAGEN’s IPA) and motif enrichment analysis in RNA-seq and ATAC-seq data. Source data
Extended Data Fig. 10
Extended Data Fig. 10. SASP transcriptome and SASP cytokine array analyses of the different senescent cell types throughout life.
a) Scheme indicating the number of upregulated SASP genes in SCs, FAPs, and MCs from young and old mice at 3 and 7 d.p.i. (FDR <0.05). b) Clusters of gene sets enriched in SASP-related genes from Sen SCs, FAPs, and MCs from old mice at 3 d.p.i. (g:Profiler web server, FDR <0.05). Node size is proportional to the number of genes identified in each gene set. Grey edges indicate gene overlap. SASP genes were identified using different published databases (see methods). Differentially upregulated genes (FDR < 0.05) were considered as “SASP genes” when overexpressed in Sen populations vs their NSen counterparts. c) Heatmap of upregulated SASP genes in Sen SCs, FAPs and MCs from young and old mice at 3 and 7 d.p.i. (FDR <0.05 in at least 8/12 comparisons). d) SPiDER+ and SPiDER SCs, FAPs and MCs, freshly sorted from regenerating muscle tissue at 3 d.p.i., were cultured for 24 h in serum-deprived media, conditioned media collected, and protein levels assessed by cytokine array (n = pool of 4 mice/group). Graphs show the top 10 proteins whose levels were increased in SPiDER+ cells (compared to the SPiDER). e) Cytokine array of freshly sorted SPiDER+ or SPiDER cells from regenerating muscle at 3 d.p.i. from young or old mice cultured for 24 hours in serum-deprived media, then the conditioned media were collected and the levels of the indicated protein were assessed. Graphs represent the top 10 proteins whose levels were increased in the comparison (n = pool of 4 mice/group). f) (left) Cytokine array analysis of whole muscle secretome from (top) resting (basal) muscles comparing old and young mice, and (bottom) injured compared to basal muscles from young mice (n = pool of 2 mice/group). Graphs represent the top 10 proteins whose levels were increased in the comparison. (right) Venn-diagram showing the overlap between secreted proteins during ageing, injury-induced regeneration and secreted proteins by isolated young SPiDER+ cells in e. Common secreted proteins are indicated. Source data
Extended Data Fig. 11
Extended Data Fig. 11. Role of NF-κB and Smad3 in the inflammatory SASP in regenerating muscles. Analysis of SASP and its effect on muscle stem-cell expansion.
a) Mice were subjected to CTX injury and treated with either vehicle, bortezomib or SIS3 during the course of regeneration and analysed at 5 d.p.i.. Strategy schematic and cytokine array of freshly sorted SPiDER+ or SPiDER cells from regenerating muscle at 5 d.p.i. are shown (n = pool of 4 mice/group). Graphs represent the top 10 proteins whose levels were increased in the comparison. b) Cytokine array of freshly sorted SPiDER+ or SPiDER cells from regenerating muscle at 5 d.p.i. from mice treated with SIS3, bortezomib or vehicle (n = pool of 4 mice/group for vehicle and SIS3 and pool of 3 mice/group for bortezomib). Graphs represent the top 10 proteins whose levels were decreased in the comparison. c) Expression levels of the indicated genes analysed by RT-qPCR in vehicle- and SIS3-treated mice (n = 5 mice in Col6a1 and Col6a3 for SPiDER++SIS3, 7 mice in Col1a2 and Col6a3 for SPiDER, and 6 mice for the rest of the genes and groups). d) Expression levels of the indicated genes analysed by RT-qPCR in vehicle and bortezomib-treated mice (n = 5 mice in Cxcl10 for SPiDER++bortezomib, 8 mice in Cxcl9 for SPiDER+, and 6 mice for the rest of the genes and groups). e) Cytoscape network showing ligand-receptor (L-R) interactions between Sen populations and NSen SCs from old mice at 3 d.p.i. predicted by a modified version of FunRes. f) Major activated and inhibited KEGG pathways predicted by SPIA in NSen SCs downstream the predicted interactions showed in e. Ratio of interactions represents the proportion of L-R that induce the pathway of interest. g) p16-3MR mice were injured with CTX and daily treated with vehicle or GCV from the day of injury to 4 d.p.i. Representative images of EdU and Pax7 staining, arrows indicate double-positive cells (related to Fig. 5h). h) SPiDER SCs were isolated at 3 d.p.i. from regenerating muscles of young mice, then cultured for 3 days in transwells with total SPiDER+, SPiDER cells, or culture medium. After 3 days of culture, SC proliferation was assessed by BrdU incorporation. Representative images of BrdU staining are shown (related to Fig. 5i). i) EDL from either WT or p16-3MR donor mice were transplanted into WT or p16-3MR recipient mice or vice versa. Recipient mice were treated every day with GCV, and muscle regeneration was analysed at 7 d.p.i. Representative images of MYH3 staining are shown (related to Fig. 5j). Scale bars: 20 μm (g and i); 10 μm (h). Results are displayed as mean ± s.e.m.; P values were calculated by Tukey’s test (c and d). Source data
Extended Data Fig. 12
Extended Data Fig. 12. Analysis of the CD36 role in SASP production. Effects of CD36 inhibition.
a) Subnetwork of significant Cd36 upstream and downstream signalling interactions pulled out from FunRes global signalling interaction network for Sen SCs population at 3 d.p.i. Green nodes are related to NF-κB cascade, orange to MAPK signalling and violet to interferon regulatory factors (IRFs). b) C2C12 cells were treated with etoposide to induce cellular senescence and harvested at the indicated time points. Graphs show relative mRNA expression levels of Cd36 and SASP-related genes normalized to untreated C2C12 cells at different times after etoposide treatment (n = 3 experiments). c) TA muscles of young mice were subjected to CTX injury and mice were treated with control IgA or anti-CD36 antibody from 3 to 7 d.p.i. once per day. Representative images of MYH3 and Sirius Red staining and quantification of SA-β-gal+ cells (n = 8 TA from 7 mice for IgA, 6 TA from 4 mice for anti-CD3610μg, and 8 TA from 4 mice for anti-CD3620μg), mean CSA (n = 11 TA from 7 mice for IgA, 8 TA from 4 mice for anti-CD3610μg, and 6 TA from 4 mice for anti-CD3620μg) and frequency distribution analysis of MYH3+ fibres (n = 7 mice for IgA, 4 mice for anti-CD3610μg, and 4 mice for anti-CD3620μg) and Sirius Red staining (n = 10 TA from 6 mice for IgA, 8 TA from 4 mice for anti-CD3610μg and anti-CD3620μg) in muscle cryosections. d) Freshly sorted SPiDER+ cells from IgA or anti-CD36 antibody-treated old mice at 7 d.p.i. were cultured for 24 h in serum-deprived media, conditioned media was collected and protein levels were assessed by cytokine array. Quantification showing the proteins whose levels were reduced by 30% in the presence of anti-CD36 antibody (n = pool of 4 mice/group). e) Cytokine array analysis of whole muscle secretome from p16-3MR mice treated with (top) IgA or anti-CD36 antibody or (bottom) GCV or vehicle, as indicated before (n = pool of 3 mice for anti-CD36 and pool of 2 mice for the rest of the groups). Graphs represent the top 10 proteins whose levels were decreased in the comparison. f) Representative pictures of MYH3 and Sirius Red staining of regenerating TA muscles from IgA or anti-CD36 antibody-treated old mice at 7 d.p.i. (related to Fig. 6f). g) As in c, mRNA expression levels of the indicated genes by RT-qPCR (n = 6 TA from 3 mice in Il6 and Ifng for anti-CD36, 6 TA from 4 mice in Tnf and Ccl2 for anti-CD36, 7 TA from 4 mice in Il1b, Il12, Il18 for anti-CD36 and Ccl2 and Il12 for IgA and 8 TA from 4 mice for the rest of the genes and groups). h) EDL muscles of old mice were injured with CTX and mice were treated with IgA or anti-CD36 antibodies from 3 to 10 d.p.i. Maximum and specific force measurements and force-frequency curve are shown (n = 6 EDL from 3 mice for IgA Ab-treated and 5 EDL from 4 mice for anti-CD36-treated). Scale bars 50 μm. Results are displayed as mean ± s.e.m.; P values were calculated by Dunnet’s test (b), Tukey’s test (c), two-way ANOVA (h, force-frequency curve) and Mann–Whitney U-test (g and h). Source data

Comment in

Similar articles

Cited by

References

    1. Fuchs E, Blau HM. Tissue stem cells: architects of their niches. Cell Stem Cell. 2020;27:532–556. - PMC - PubMed
    1. Sousa-Victor P, Garcia-Prat L, Munoz-Canoves P. Control of satellite cell function in muscle regeneration and its disruption in ageing. Nat. Rev. Mol. Cell Biol. 2022;23:204–226. - PubMed
    1. Roy AL, et al. A blueprint for characterizing senescence. Cell. 2020;183:1143–1146. - PMC - PubMed
    1. Franceschi C, Campisi J. Chronic inflammation (inflammaging) and its potential contribution to age-associated diseases. J. Gerontol. A. 2014;69:S4–S9. - PubMed
    1. Sousa-Victor P, et al. Geriatric muscle stem cells switch reversible quiescence into senescence. Nature. 2014;506:316–321. - PubMed

Publication types