. 2022 Aug 5;79(8):468.
doi: 10.1007/s00018-022-04481-1.

CD69-oxLDL ligand engagement induces Programmed Cell Death 1 (PD-1) expression in human CD4 + T lymphocytes

Affiliations

CD69-oxLDL ligand engagement induces Programmed Cell Death 1 (PD-1) expression in human CD4 + T lymphocytes

María Jiménez-Fernández et al. Cell Mol Life Sci. .

Abstract

The mechanisms that control the inflammatory-immune response play a key role in tissue remodelling in cardiovascular diseases. T cell activation receptor CD69 binds to oxidized low-density lipoprotein (oxLDL), inducing the expression of anti-inflammatory NR4A nuclear receptors and modulating inflammation in atherosclerosis. To understand the downstream T cell responses triggered by the CD69-oxLDL binding, we incubated CD69-expressing Jurkat T cells with oxLDL. RNA sequencing revealed a differential gene expression profile dependent on the presence of CD69 and the degree of LDL oxidation. CD69-oxLDL binding induced the expression of NR4A receptors (NR4A1 and NR4A3), but also of PD-1. These results were confirmed using oxLDL and a monoclonal antibody against CD69 in CD69-expressing Jurkat and primary CD4 + lymphocytes. CD69-mediated induction of PD-1 and NR4A3 was dependent on NFAT activation. Silencing NR4A3 slightly increased PD-1 levels, suggesting a potential regulation of PD-1 by this receptor. Moreover, expression of PD-1, CD69 and NR4A3 was increased in human arteries with chronic inflammation compared to healthy controls, with a strong correlation between PD-1 and CD69 mRNA expression (r = 0.655 P < 0.0001). Moreover, PD-1 was expressed in areas enriched in CD3 infiltrating T cells. Our results underscore a novel mechanism of PD-1 induction independent of TCR signalling that might contribute to the role of CD69 in the modulation of inflammation and vascular remodelling in cardiovascular diseases.

Keywords: Anti-inflammatory response; CD69 leucocyte activation receptor; Cardiovascular disease; Inflamed aorta; Programmed Death 1 (PD-1); oxLDL.


Conflict of interest statement

The authors have no conflict of interest to declare.

Figures

Fig. 1
Fig. 1
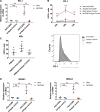
OxLDL-CD69 binding induces a differential transcriptional response increasing the PD-1 expression. A Principal component analysis (PCA) performed using the up- and downregulated genes from the RNA-Seq data of each incubation condition. The proportion of variability explained by each principal component (PC1 and PC2) are included in the axis. Blue samples correspond to JKwt and red samples to JKCD69. (nLDL: native LDL; moxLDL: moderately oxidized LDL; hoxLDL. highly oxidized LDL). B The oxidation degree of oxLDL induces a differential transcriptomic response. Heatmap based on the fold change of 577 upregulated and 242 downregulated genes in JKCD69 with the higher level of oxLDL. Data are shown as Ln (x + 1) and are clustered using correlation distance and average linkage. Up- and downregulated genes are shown in red and blue respectively. C Relative expression of PD-1 mRNA in JKCD69 and JKwt treated with hoxLDL. Data are mean ± SD (n = 3) and were analysed with two-way ANOVA (Tukey post hoc test). *Indicates significant differences (P < 0.05) with the treatment for each cell line (native vs. oxLDL), # JKCD69 vs. JKwt in the same condition, ◦ significant differences respect the previous time (45’ vs. 4 h, 4 h vs. 8 h). D Mean fluorescence intensity of PD-1 in both cell lines at different time points. Data are mean ± SD (n = 3) and were analysed with two-way ANOVA (Bonferroni post hoc test). *Indicates significant differences (P < 0.05) in the treatment for each cell line (native vs oxLDL), # JKCD69 vs. JKwt in the same condition, ◦ significant differences respect the time. E Histograms of a representative experiment of the induction of PD-1 in JKCD69 and JKwt after 48 h incubated with LDLs
Fig. 2
Fig. 2
CD69 engagement induces the PD-1 mRNA and protein expression. A Relative expression of PD-1 mRNA induced by anti-CD69 TP1/55 antibody in JKCD69 after 4 h of stimulation. JKwt cells response was assessed as a control. An isotype control antibody was also used. Data are mean ± SD (n = 3) and **P < 0.01 differences were determined with two-way ANOVA (Tukey post hoc test). B Percentage of positive cells for PD-1 in both cell lines at different time points after engagement of the CD69 antibody TP1/55. Data are mean ± SD (n = 3), and differences were analysed with two-way ANOVA (Tukey post hoc test). *Indicates significant differences (P < 0.05) with the treatment for each cell line (antibody vs. isotype control), # JKCD69 vs. JKwt in the same condition, ◦ significant differences respect the previous time (24 h vs. 48 h, 48 h vs. 72 h). C Left, percentage of primary human CD4 + T cells expressing PD-1 after 48 h of stimulation. Data are mean ± SD (n = 5), and differences were determined with one-way ANOVA (Tukey post hoc test). **P < 0.01. Right, histogram of a representative experiment after 48 h of treatment. D Relative expression of NR4A1 and NR4A3 mRNA induced by anti-CD69 TP1/55 antibody in JKCD69 after 4 h. Data are mean ± SD (n = 3), and differences were analysed with two-way ANOVA (Bonferroni post hoc test). **P < 0.01. ***P < 0.001
Fig. 3
Fig. 3
NFAT regulates PD-1 expression induced by CD69 engagement in T cells. A Cyclosporine A reduces the expression of PD-1 + in T cells. JKCD69 cells were incubated with crosslinked anti-CD69 with or without cyclosporine A (CsA), or phorbol 12-myristate 13-acetate and ionomycin (PMA/Io) stimulated with or without CsA for 48 h. Data are mean ± SD (n = 3), and differences were determined by unpaired t test. * P < 0.05. B Cyclosporine A inhibits CD69-mediated NR4A3 induction. Relative expression of NR4A3 in JKCD69 incubated with anti-CD69 monoclonal antibody, with or without CsA and with CsA in resting cells for 4 h. Data are mean ± SD (n = 3), and differences were analysed with one-way ANOVA (Tukey post hoc test). * P < 0.05, ** P < 0.01. C Induction of NR4A1 is independent of NFAT blockade. Relative expression of NR4A1 in JKCD69 with anti-CD69 antibody, with or without CsA and with CsA in resting cells incubated for 4 h. Data are mean ± SD (n = 3) and were analysed with one-way ANOVA (Tukey post hoc test). *P < 0.05, **P < 0.01. D Relative expression levels of NR4A3 mRNA after siRNA knockdown in resting and anti-CD69 stimulation conditions. Data showed are mean ± SD (n = 3), and differences were determined by unpaired t test. *P < 0.05. ** P<0.01. E siRNA interfering of NR4A3 expression enhances PD-1 + cell population. JKCD69 were stimulated with anti-CD69 or PMA/Io for 48 h. Data are mean ± SD (n = 3), and differences were determined by paired t test. *P < 0.05
Fig. 4
Fig. 4
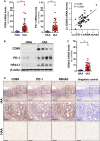
PD-1 and CD69 are highly expressed in inflamed human arteries. A PD-1 and CD69 mRNA levels were measured in inflamed abdominal aortic samples (IAA) from patients undergoing open repair surgery for abdominal aortic aneurysm (n = 49) and healthy abdominal aortic samples (HAA) from donors (n = 11). Data are expressed as mean ± SD *P < 0.05 (Mann–Whitney test). (right panel) Statistically significant positive correlation between CD69 mRNA levels and those corresponding to PD-1 in inflamed aortic samples from patients. The Pearson Product Moment Correlation was applied. B CD69, PD-1 and NR4A3 protein levels were evaluated by western blot in aortic lysates from IAA and HAA samples. Representative immunoblots are shown. C NR4A3 mRNA levels assessed in the samples described in A). Data are expressed as mean ± SD. *P < 0.05 (Mann–Whitney test). D Immunohistochemical analysis of CD69, PD-1 and NR4A3 in haematoxylin counterstained sections from IAA and HAA samples. The indicated areas are shown at high magnification (middle panels). Bar: 100 µm (upper and lower panels) and 50 µm (middle panels). Negative controls in which the primary antibody was omitted are shown on the right

Similar articles

Cited by

References

    1. Cebrián M, Yagüe E, Rincón M, López-botet M, De Landázuri MO, Sánchez-madrid F. Triggering of t cell proliferation through aim, an activation inducer molecule expressed on activated human lymphocytes. J Exp Med. 1988;168:1621–1637. doi: 10.1084/jem.168.5.1621. - DOI - PMC - PubMed
    1. González-Amaro R, Cortés JR, Sánchez-Madrid F, Martín P. Is CD69 an effective brake to control inflammatory diseases? Trends Mol Med. 2013;19:625–632. doi: 10.1016/j.molmed.2013.07.006. - DOI - PMC - PubMed
    1. Radulovic K, Manta C, Rossini V, Holzmann K, Kestler HA, Wegenka UM, Nakayama T, Niess JH. CD69 regulates Type I IFN-induced tolerogenic signals to mucosal CD4 T cells that attenuate their colitogenic potential. J Immunol. 2012;188:2001–2013. doi: 10.4049/jimmunol.1100765. - DOI - PubMed
    1. Sancho D, Gómez M, Viedma F, Esplugues E, Gordón-Alonso M, Angeles García-López M, de la Fuente H, Martínez-A C, Lauzurica P, Sánchez-Madrid F. CD69 downregulates autoimmune reactivity through active transforming growth factor-β production in collagen-induced arthritis. J Clin Invest. 2003;112:872–882. doi: 10.1172/JCI200319112. - DOI - PMC - PubMed
    1. Cortés JR, Sánchez-Díaz R, Bovolenta ER, Barreiro O, Lasarte S, Matesanz-Marín A, Toribio ML, Sánchez-Madrid F, Martín P. Maintenance of immune tolerance by Foxp3+ regulatory T cells requires CD69 expression. J Autoimmun. 2014;55:51–62. doi: 10.1016/j.jaut.2014.05.007. - DOI - PMC - PubMed

MeSH terms