. 2022 Jun 15:14:909222.
doi: 10.3389/fnagi.2022.909222. eCollection 2022.

Identification of miRNA-mRNA Pairs in the Alzheimer's Disease Expression Profile and Explore the Effect of miR-26a-5p/PTGS2 on Amyloid-β Induced Neurotoxicity in Alzheimer's Disease Cell Model

Affiliations

Identification of miRNA-mRNA Pairs in the Alzheimer's Disease Expression Profile and Explore the Effect of miR-26a-5p/PTGS2 on Amyloid-β Induced Neurotoxicity in Alzheimer's Disease Cell Model

Tao Xie et al. Front Aging Neurosci. .

Abstract

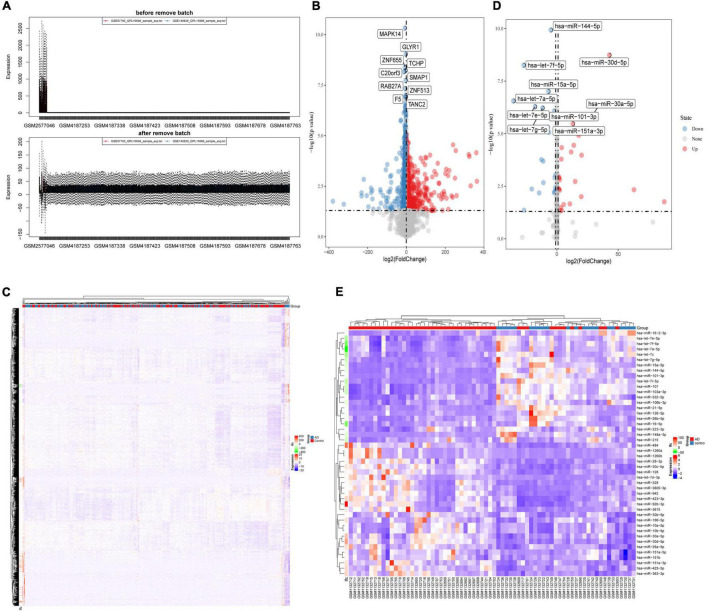
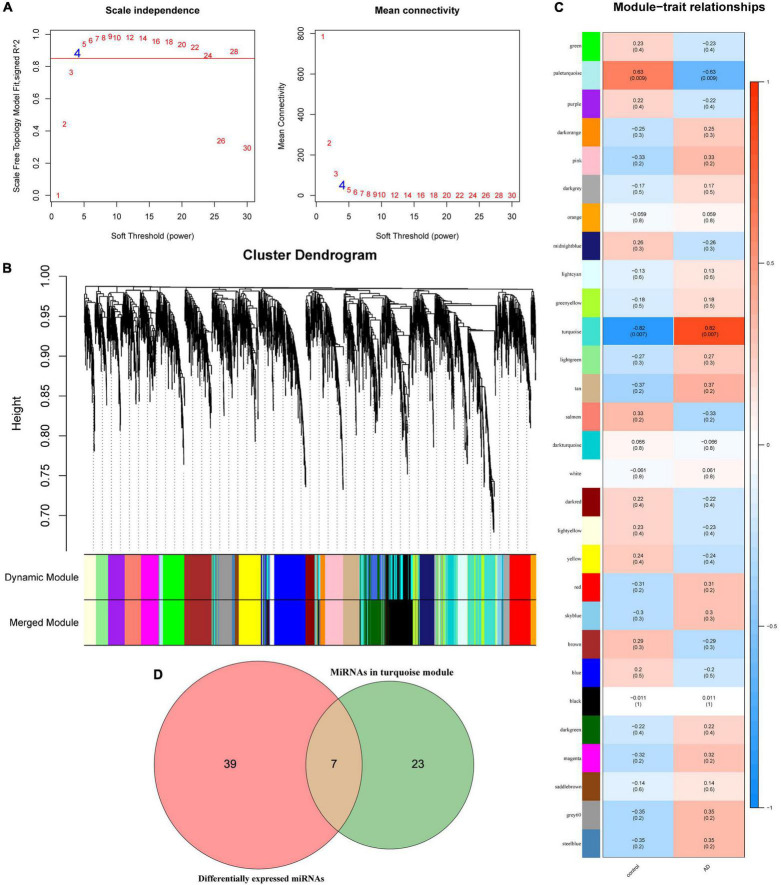
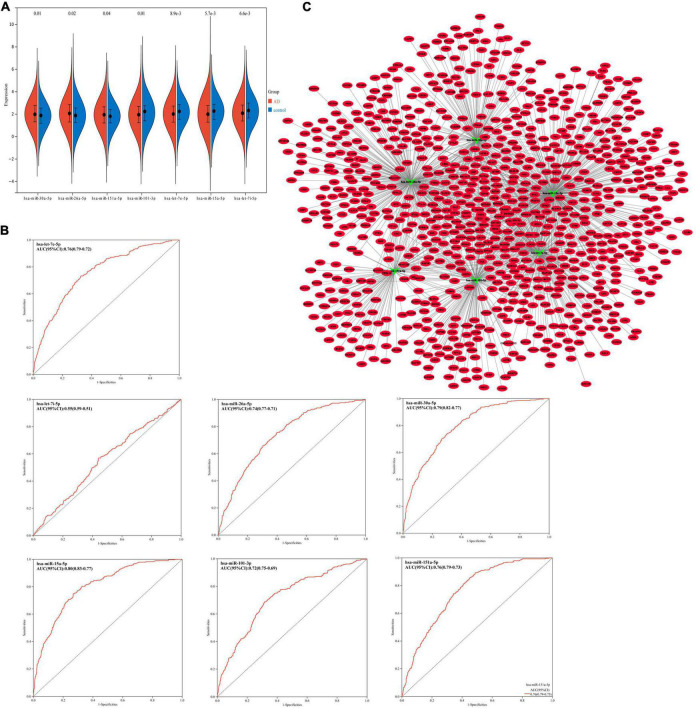
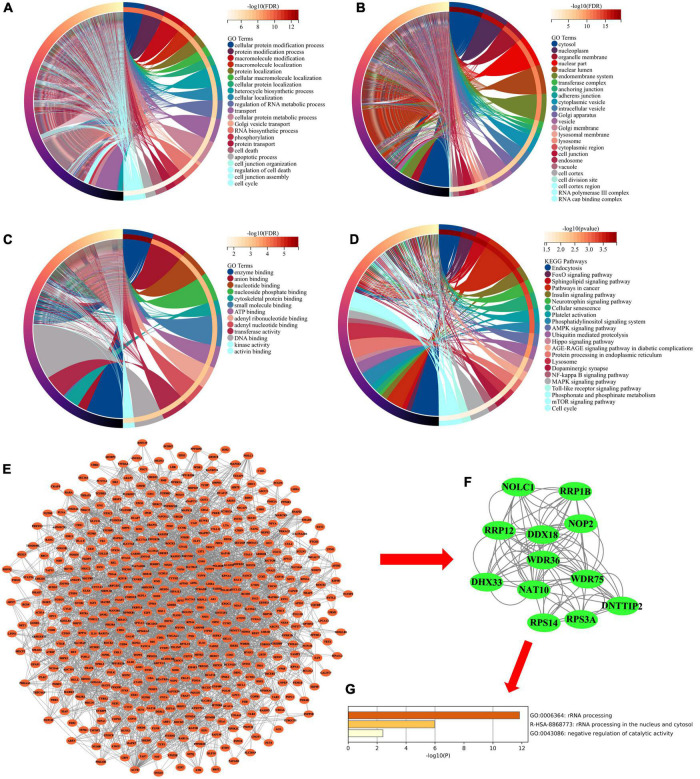
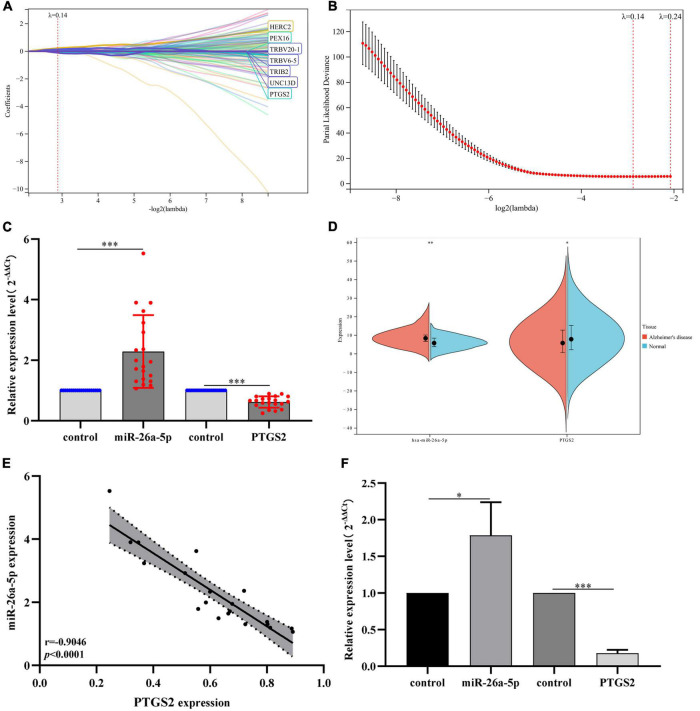
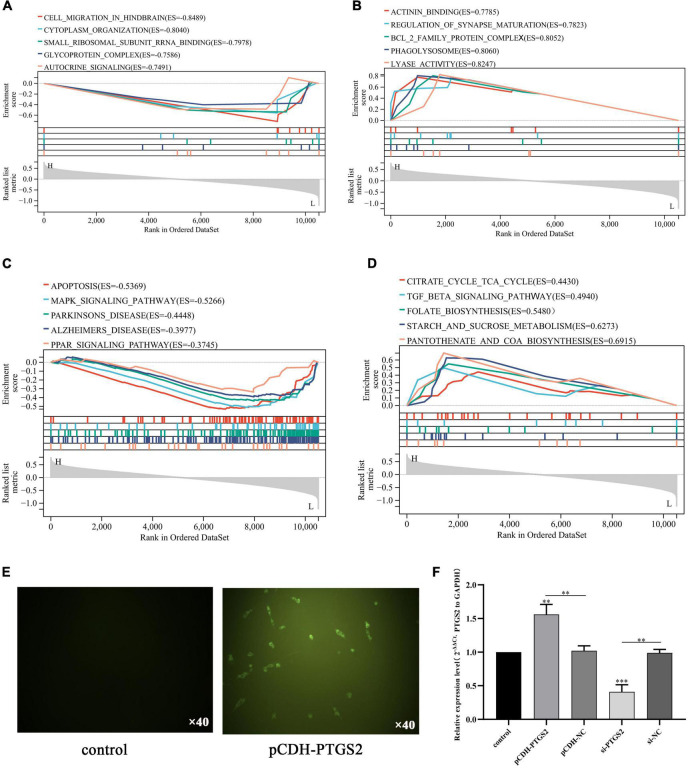
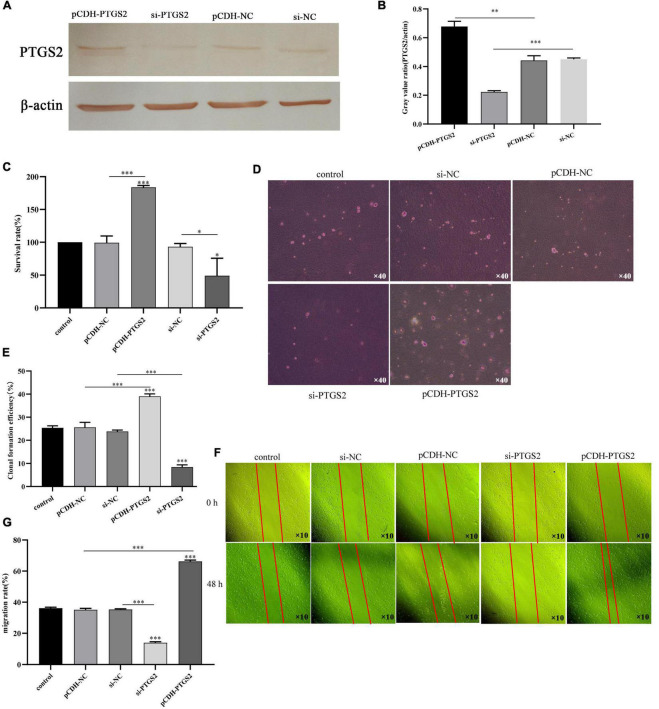
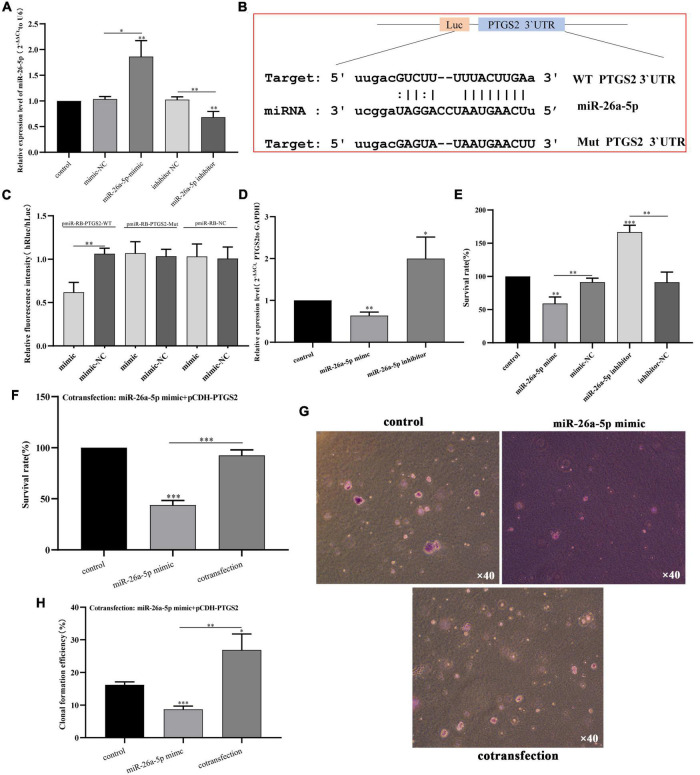
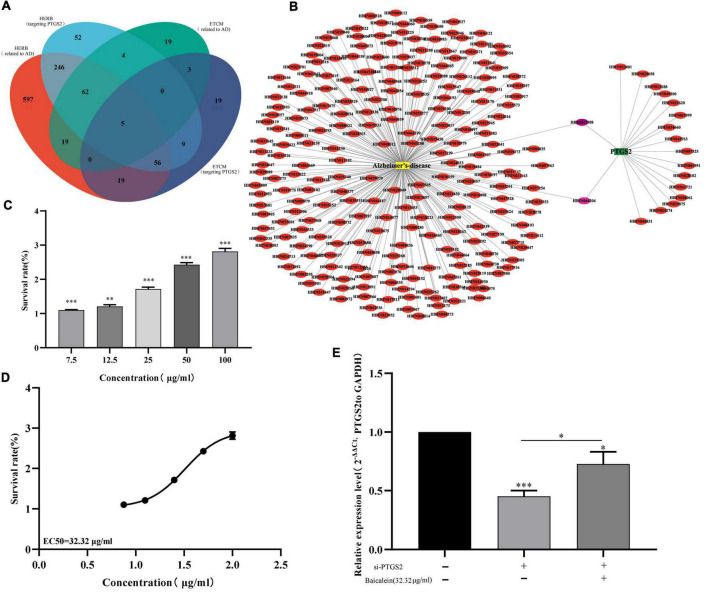
Alzheimer's disease (AD) is a progressive neurodegenerative disease and the most common type of dementia. MicroRNAs (miRNAs) have been extensively studied in many diseases, including AD. To identify the AD-specific differentially expressed miRNAs and mRNAs, we used bioinformatics analysis to study candidate miRNA-mRNA pairs involved in the pathogenesis of AD. These miRNA-mRNAs may serve as promising biomarkers for early diagnosis or targeted therapy of AD patients. In this study, based on the AD mRNA and miRNA expression profile data in Gene Expression Omnibus (GEO), through differential expression analysis, functional annotation and enrichment analysis, weighted gene co-expression network analysis, miRNA-mRNA regulatory network, protein-protein interaction network, receiver operator characteristic and Least absolute shrinkage and selection operator (LASSO) regression and other analysis, we screened the key miRNA-mRNA in the progress of AD: miR-26a-5p/PTGS2. Dual-luciferase and qPCR experiments confirmed that PTGS2 is a direct target gene of miR-26a-5p. The expression of miR-26a-5p in the peripheral blood of AD patients and AD model cells (SH-SY5Y cells treated with Aβ25-35) was up-regulated, and the expression of PTGS2 was down-regulated. Functional gain -loss experiments confirmed that PTGS2 protects AD model cells from damage by inhibiting proliferation and migration. However, the expression of miR-26a-5p promotes the proliferation of AD model cells. It is further found that PTGS2 is involved in the regulation of miR-26a-5p and can reverse the effect of miR-26a-5p on the proliferation of AD model cells. In addition, through network pharmacology, qPCR and CCK-8, we found that baicalein may affect the progression of AD by regulating the expression of PTGS2. Therefore, PTGS2 can be used as a target for AD research, and miR-26a-5p/PTGS2 can be used as an axis of action to study the pathogenesis of AD.

Keywords: Alzheimer’s disease; baicalein; miR-26a-5p/PTGS2; miRNA–mRNA; neurotoxicity.


Conflict of interest statement

The authors declare that the research was conducted in the absence of any commercial or financial relationships that could be construed as a potential conflict of interest.

Figures

FIGURE 1
FIGURE 1
(A) The SVA package removes the batch effect between GSE140829 and GSE97760. (B) Volcano plot and (C) heatmap for the differentially expressed mRNAs in the merged dataset (GSE140829 and GSE97760). (D) Volcano plot and (E) heatmap for the differentially expressed miRNAs in GSE46579. Red dots represent up regulation, blue dots represent down regulation, and gray dots represent non-differentially expressed RNA.
FIGURE 2
FIGURE 2
Weighted gene co-expression network analysis analysis results in GSE157239 dataset. (A) Analysis of the scale-free index for various soft-threshold powers (β) and the mean connectivity for various soft-threshold powers. (B) Dendrogram of all miRNAs clustered in GSE157239. (C) Heatmap of the correlation between the module eigengenes and clinical traits of Alzheimer’s disease. (D) Venn diagram shows the overlapping miRNAs in the turquoise module and differentially expressed miRNAs.
FIGURE 3
FIGURE 3
(A) Expression trends of hsa-miR-30a-5p, hsa-miR-26a-5p, hsa-miR-151a-5p, hsa-miR-101-3p, hsa-let-7e-5p, hsa-miR-15a-5p and hsa-let-7i-5p in GSE120584. (B) Receiver operator characteristic curve (ROC) analysis of hsa-miR-30a-5p, hsa-miR-26a-5p, hsa-miR-151a-5p, hsa-miR-101-3p, hsa-let-7e-5p, hsa-miR-15a-5p, and hsa-let-7i-5p base on GSE120584 dataset. AUC, Area Under the Curve. (C) miRNA–mRNA regulatory network. The green triangle represents miRNA and the red oval represents miRNA.
FIGURE 4
FIGURE 4
(A) Chord diagram showing enriched GO-BP clusters for the mRNAs in miRNA-mRNA regulatory network. BP, biological processes. (B) Chord diagram showing enriched GO-CC clusters for the mRNAs in miRNA-mRNA regulatory network. CC, cell composition. (C) Chord diagram showing enriched GO-MF clusters for the mRNAs in miRNA-mRNA regulatory network. MF, molecular functions. (D) Chord diagram showing enriched KEGG clusters for the mRNAs in miRNA-mRNA regulatory network. GO, Gene Ontology; KEGG, Kyoto Encyclopedia of Genes and Genomes. (E) PPI network analysis for the mRNAs in miRNA-mRNA regulatory network. PPI, protein–protein interaction. (F) The hub subnetwork from PPI network by Molecular Complex Detection (MCODE) plug-in. (G) Functional enrichment analysis of mRNAs in hub subnetwork.
FIGURE 5
FIGURE 5
(A) LASSO coefficient profiles of 7 AD characteristic genes in the GSE85426 dataset. (B) Plot of partial likelihood deviance. (C) The expression levels of miR-26a-5p and PTGS2 in peripheral blood of AD patients (20 AD patients and 20 control samples). The expression level of GAPDH was used as an internal reference for PTGS2 and U6 for miR-26a-5p. The data are shown as the mean ± standard deviation. (D) The expression levels of miR-26a-5p and PTGS2 in the merged dataset (GSE140829 and GSE97760). (E) Correlation analysis of the expression of miR-26a-5p and PTGS2 in peripheral blood of AD patients (20 AD patients and 20 control samples). (F) The expression levels of miR-26a-5p and PTGS2 in AD model cells (Aβ25–35-treated SH-SY5Y cells). The expression level of GAPDH was used as an internal reference for PTGS2 and U6 for miR-26a-5p. The data are shown as the mean ± standard deviation. AD, Alzheimer’s disease. ***p < 0.001; **p < 0.01; *p < 0.05.
FIGURE 6
FIGURE 6
Gene set enrichment analysis revealed five positively correlated GO term with lower expression PTGS2 (A), five negatively correlated GO term with lower expression PTGS2 (B), five positively correlated KEGG pathway with lower expression PTGS2 (C), and five negatively correlated KEGG pathway with lower expression PTGS2 (D). (E) The transfection efficiency of pCDH-PTGS2 was detected by fluorescence microscope. Scales: 10 × 40. (F) The transfection efficiency of pCDH-PTGS2 and si-PTGS2 was detected by qPCR. The expression level of GAPDH was used as an internal reference for PTGS2. The data are shown as the mean ± standard deviation. The horizontal line indicates the comparison between groups at both ends, and the non-horizontal line indicates the comparison with the control group. ***p < 0.001; **p < 0.01.
FIGURE 7
FIGURE 7
(A,B) The transfection efficiency of pCDH-PTGS2 and si-PTGS2 was detected by western blot. (C) The effects of PTGS2 knockdown or overexpression on the vitality of AD model cells (Aβ25–35-treated SH-SY5Y cells) measured using the CCK-8 assay. (D,E) The effects of PTGS2 knockdown or overexpression on the proliferation of AD model cells (Aβ25–35-treated SH-SY5Y cells) measured using the soft agar assay. Scales: 10 × 40. (F,G) The effects of PTGS2 knockdown or overexpression on the migration of AD model cells (Aβ25–35-treated SH-SY5Y cells) measured using the wound healing assay. Scales: 10 × 10. The data are shown as the mean ± standard deviation. The horizontal line indicates the comparison between groups at both ends, and the non-horizontal line indicates the comparison with the control group. AD: Alzheimer’s disease. ***p < 0.001; **p < 0.01; *p < 0.01.
FIGURE 8
FIGURE 8
(A) The transfection efficiency of miR-26a-5p (miR-26a-5p mimic and miR-26a-5p inhibitor) was detected by qPCR. The expression level of U6 was used as an internal reference for miR-26a-5p. The data are shown as the mean ± standard deviation. (B) Binding site sequences of miR-26a-5p and PTGS2 3 ‘UTR. (C) Luciferase activity of WT or Mut PTGS2 after co-transfection of miR-26a-5p mimic and WT or Mut PTGS2 dual-fluorescent vector into SH-SY5Y cells. (D) The effects of miR-26a-5p mimic and mir-26a-5p inhibitor on the expression of PTGS in AD model cells (Aβ25–35-treated SH-SY5Y cells) were detected by qPCR. (E) The effects of miR-26a-5p mimic and miR-26a-5p inhibitor on the vitality of AD model cells (Aβ25–35-treated SH-SY5Y cells) measured using the CCK-8 assay. (F) The effects of cotransfection (pCDH-PTGS2 and miR-26a-5p mimic) on the vitality of AD model cells (Aβ25–35-treated SH-SY5Y cells) measured using the CCK-8 assay. (G,H) The effects of cotransfection (pCDH-PTGS2 and miR-26a-5p mimic) on the proliferation of AD model cells (Aβ25–35-treated SH-SY5Y cells) measured using the soft agar assay. Scales: 10 × 40. The data are shown as the mean ± standard deviation. The horizontal line indicates the comparison between groups at both ends, and the non-horizontal line indicates the comparison with the control group. AD, Alzheimer’s disease. ***p < 0.001; **p < 0.01; *p < 0.01.
FIGURE 9
FIGURE 9
(A) Venn diagram shows the overlap between AD related Chinese herbs and PTGS related Chinese herbs. (B) Network of AD related components in HUANGQIN and PTGS2 targeted components in HUANGQIN. (C) The effects of different concentrations baicalein on the vitality of AD model cells (Aβ25–35-treated SH-SY5Y cells) measured using the CCK-8 assay. (D) EC50 fitting curve of baicalein in AD model cells (Aβ25–35-treated SH-SY5Y cells). (E) The effect of baicalein on the expression of PTGS2 by qPCR in AD model cells (Aβ25–35-treated SH-SY5Y cells). AD, Alzheimer’s disease. The expression level of GAPDH was used as an internal reference for PTGS2. The data are shown as the mean ± standard deviation. The horizontal line indicates the comparison between groups at both ends, and the non-horizontal line indicates the comparison with the control group. ***p < 0.001; *p < 0.05.

Similar articles

Cited by

References

    1. Ali Syeda Z., Langden S. S. S., Munkhzul C., Lee M., Song S. J. (2020). Regulatory Mechanism of MicroRNA Expression in Cancer. Int. J. Mol. Sci. 21:1723. 10.3390/ijms21051723 - DOI - PMC - PubMed
    1. Alzheimer’s Association (2022). 2022 Alzheimer’s disease facts and figures. Alzheimer Dement 18 700–789. 10.1002/alz.12638 - DOI - PubMed
    1. Ansari A., Maffioletti E., Milanesi E., Marizzoni M., Frisoni G. B., Blin O., et al. (2019). miR-146a and miR-181a are involved in the progression of mild cognitive impairment to Alzheimer’s disease. Neurobiol. Aging 82 102–109. 10.1016/j.neurobiolaging.2019.06.005 - DOI - PubMed
    1. Barbieri I., Kouzarides T. (2020). Role of RNA modifications in cancer. Nat. Rev. Cancer 20 303–322. 10.1038/s41568-020-0253-2 - DOI - PubMed
    1. Barrett T., Wilhite S. E., Ledoux P., Evangelista C., Kim I. F., Tomashevsky M., et al. (2013). NCBI GEO: archive for functional genomics data sets–update. Nucleic Acids Res. 41 D991–D995. 10.1093/nar/gks1193 - DOI - PMC - PubMed