Clinical Trial
. 2022 Jun 6;13(1):3140.
doi: 10.1038/s41467-022-30615-x.

Inhibition of type 1 immunity with tofacitinib is associated with marked improvement in longstanding sarcoidosis

Affiliations
Clinical Trial

Inhibition of type 1 immunity with tofacitinib is associated with marked improvement in longstanding sarcoidosis

William Damsky et al. Nat Commun. .

Abstract

Sarcoidosis is an idiopathic inflammatory disorder that is commonly treated with glucocorticoids. An imprecise understanding of the immunologic changes underlying sarcoidosis has limited therapeutic progress. Here in this open-label trial (NCT03910543), 10 patients with cutaneous sarcoidosis are treated with tofacitinib, a Janus kinase inhibitor. The primary outcome is the change in the cutaneous sarcoidosis activity and morphology instrument (CSAMI) activity score after 6 months of treatment. Secondary outcomes included change in internal organ involvement, molecular parameters, and safety. All patients experience improvement in their skin with 6 patients showing a complete response. Improvement in internal organ involvement is also observed. CD4+ T cell-derived IFN-γ is identified as a central cytokine mediator of macrophage activation in sarcoidosis. Additional type 1 cytokines produced by distinct cell types, including IL-6, IL-12, IL-15 and GM-CSF, also associate with pathogenesis. Suppression of the activity of these cytokines, especially IFN-γ, correlates with clinical improvement. Our results thus show that tofacitinib treatment is associated with improved sarcoidosis symptoms, and predominantly acts by inhibiting type 1 immunity.


Conflict of interest statement

W.D. has research funding from Pfizer and Advanced Cell Diagnostics/Bio-techne, serves as a consultant for Eli Lilly, Pfizer, Incyte, and Twi Biotechnology, and receives licensing fees from EMD/Millipore/Sigma. B.D.Y receives research funding from Pfizer. E.J.M. receives research funding from Alnylam, Pfizer, and Eidos and serves as a consultant for Alnylam, Pfizer, and Eidos. D.P. receives consulting fees from Telix Pharmaceuticals and Cohere Health. M.B. is a consultant for Eli Lilly and receives licensing fees from EMD/Millipore//Sigma. R.A.F. is a consultant for Glaxo Smith Kline and Zai labs. B.K. is a consultant to and/or has served on advisory boards for Aclaris Therapeutics, Arena Pharmaceuticals, Bristol-Meyers Squibb, Concert Pharmaceuticals Inc, Dermavant Sciences, Eli Lilly and Company, Pfizer, and VielaBio; he is on speaker’s bureau for Pfizer, Regeneron and Sanofi Genzyme. A.W., D.J.K., K.S., M.J.M., J.D., A.C., R.A., C.R., M.K.M., I.D.O., R.F.C., R.H. and M.G. have no disclosures.

Figures
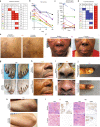
Fig. 1
Fig. 1. Tofacitinib treatment leads to improvement in cutaneous sarcoidosis.
a Left panel: baseline treatment regimens for each patient, HCQ: hydroxychloroquine (dose shown as mg twice daily), MTX: methotrexate (mg weekly), Pred: prednisone (mg daily), and Tofa: tofacitinib, Dur: duration of most recent therapeutic regimen; patients taking prednisone often had been on and off for significantly longer than indicated. *Treatment with prednisone or methotrexate was recommended but declined by patients due to prior adverse effects with these medications. Scad: maximum previous Scadding stage. b CSAMI activity scores and c total lesion glycolysis (TLG) over the study period. d Treatment regimens at the end of the study (6 months), tofacitinib (Tofa) dose shown as mg twice daily, blue: discontinued/reduced dose during study, **prednisone increased due to worsening pre-existing Achilles tendinopathy, not worsening of sarcoidosis. e Dermal papules/plaques and subcutaneous nodules of sarcoidosis before and after treatment. f Extensive involvement of the face before and after 6 months of treatment; scarring from the longstanding (>20 years) lesions persisted. g Sarcoid dactylitis before and after 6 months of treatment. h Lupus pernio presentation of sarcoidosis, also with annular plaque on the cheek, before and after treatment; significant scarring persisted in this patient. i Lupus pernio presentation of sarcoidosis before and after treatment. j Nail dystrophy related to sarcoidal inflammation in the nail matrix (demonstrated by matrix biopsy) resolved after 6 months of treatment. Post-inflammatory hyperpigmentation persisted. k Papules and plaques on the forearm of a patient before and after treatment. l Hematoxylin and eosin (H&E) stained and CD68 immunohistochemistry on skin biopsies from a representative complete responder (Pt 7, both from the back) and partial responder (Pt 5, both from the arm), scale bar: 150 μM. Similar results were seen in two additional partial responders in whom biopsies were performed. Source data are provided as a Data Source File.
Fig. 2
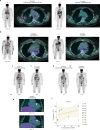
Fig. 2. Tofacitinib treatment leads to improvement in pulmonary and myocardial sarcoidosis.
a, b PET (coronal) and PET-CT (axial) studies before and after 6 months of tofacitinib in patients with complete or near complete internal organ response, TLG: total lesional glycolysis. c PET (coronal) studies before and after 6 months of treatment in a patient with improvement in lymph node avidity below the threshold of quantification. d PET (coronal) studies before and after 6 months of treatment in a patient with a slight increase in PET avidity which was felt to be clinically insignificant. e Cardiac PET-CT (coronal) before and after 6 months of treatment in a patient myocardial involvement of the inferior intraventricular septum (arrow), CMA: cardiac metabolic activity. f Scatterplot comparing change in cutaneous sarcoidosis and extra-cutaneous sarcoidosis. Depicted as simple linear regression line with 95% confidence interval (shared area), Goodness of Fit represented by R squared. Cutaneous involvement shown as percent reduction in CSAMI during the study period. Extracutaneous involvement shown as percent reduction in TLG during the study period; for patients with increase in TLG during the study, worsening of 25% was arbitrarily assigned. Source data are provided as a Data Source File.
Fig. 3
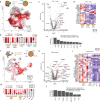
Fig. 3. scRNAseq of cutaneous sarcoidosis and control skin samples.
a UMAP projection of scRNA-seq data showing clustering of all cells, colored by cell type. b UMAP projection of scRNA-seq data in (a), colored by condition/library. c Histograms showing the contribution of each library/condition to each cluster. NK natural killer cell, L-endo lymphatic endothelium.
Fig. 4
Fig. 4. IFN-γ produced by Th1 polarized CD4+ T cells activates macrophages in cutaneous sarcoidosis.
a UMAP projection of scRNA-seq data showing T cell clusters in sarcoidosis (shades of red) compared to healthy controls (grey). b Histograms showing contribution of each condition (sarcoidosis: shades of red, grey: controls) to each T cell cluster. c Volcano plot showing the most differentially expressed genes between CD4+ SAR-1 (clusters 2,7,12) versus CD4+ CTRL (clusters 0,5), corresponding to Fig. 4a. p value determined using Wilcon Rank-Sum test, two-tailed. d Heatmap showing expression of selected transcripts in CD4+FOXP3- T cell clusters. e Histogram showing selected predicted upstream regulators of CD4+ SAR-1 clusters (2,7,12) versus CD4+ CTRL clusters (0, 5) as determined by IPA. Significance cutoff of p < 0.001 is shown by a dotted horizontal line and determined using Fisher exact test, right-tailed. f UMAP projection of scRNA-seq data showing myeloid cell clusters in sarcoidosis (shades of red) compared to healthy controls (grey). g Histograms showing contribution of each condition (sarcoidosis: shades of red, grey: controls) to each myeloid cluster. h Volcano plot showing the most differentially expressed genes between Mac SAR-1 (clusters 0,1,4,6,9,10) versus control myeloid (clusters 2,8,13). p value determined using Wilcon Rank-Sum test, two-tailed. i Heatmap showing expression of selected transcripts in myeloid clusters. j Histogram showing selected predicted upstream regulators in Mac SAR-1 and Mac SAR-2 (clusters 0,1,3,4,6,7,9,10,11) versus myeloid cells in controls (clusters 2,8,13) as determined by IPA. Significance cutoff of p < 0.001 is shown by a dotted horizontal line, as determined using Fisher exact test, right-tailed.
Fig. 5
Fig. 5. Analysis of scRNAseq data of bronchoalveolar lavage (BAL).
Patients with sarcoidosis (n = 4) and healthy control patients (n = 10) were included. a UMAP projection of scRNA-seq data of all cells colored by condition (red: sarcoidosis libraries, grey: control libraries). b UMAP projection of scRNA-seq data of all cells colored by cell type. c UMAP projection of scRNAseq data of all cells showing relative CD3E expression. d UMAP projection of scRNAseq data of T cell clusters colored by condition (red: sarcoidosis libraries, grey: control libraries). e Histogram showing the contribution of each condition (sarcoidosis: red, grey: controls) to each T cell cluster. f Violin plots showing expression of select genes in each cluster of CD4+FOXP3- cluster of T cells.
Fig. 6
Fig. 6. IFN-γ signaling is a hallmark of sarcoidosis.
a IPA analysis showing predicted upstream regulators in cutaneous sarcoidosis dataset A (bulk RNAseq from this study) and cutaneous sarcoidosis dataset B (Judson et al); IPA content version: 51963813). Each data set consisted of a series of cutaneous sarcoidosis biopsies and normal control skin. b Box and whisker plots showing expression of selected genes in pulmonary sarcoidosis with Scadding stage 1 (n = 24), stage 2/3 (n = 40), stage 4 (n = 12) relative to healthy controls (C) (n = 6). Box plots indicate median (middle line), 25th, 75th percentile (box), and 5th and 95th percentile (whiskers), p values calculated using unpaired t tests, NS: not significant, ND: not determined (abundance below threshold of detection), FPKM: fragments per kilobase of exon per million mapped fragments. See also Supplementary Fig. 5. c Box and whisker plots showing expression of selected genes in various populations of FACS purified myeloid cells from BAL of healthy controls (n = 9) (Cont) vs sarcoidosis (n = 8) (Sar). Box plots indicate median (middle line), 25th, 75th percentile (box), and 5th and 95th percentile (whiskers), p values calculated using unpaired t tests, NS: not significant, cDC1 and 2: classical dendritic cell types 1 and 2, AM: alveolar macrophage, CM: classical monocyte, IM: intermediate monocyte. (See also Supplementary Fig. 6). Source data are provided as a Data Source File.
Fig. 7
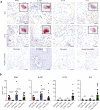
Fig. 7. Type 1 immunity is the predominant immune polarization in sarcoidosis.
a Photomicrographs showing representative RNA in situ hybridization staining patterns for selected markers (red chromogen) with hematoxylin counterstain (blue), scale bar: 50 μM, higher power inset. b Histograms showing quantification of RNA in situ hybridization staining for selected markers in control skin (n = 10), control lung (n = 5), cutaneous sarcoidosis (n = 10) and pulmonary sarcoidosis (n = 10) tissue. Data are presented as mean + /− 95% confidence interval, p values calculated using unpaired t tests, NS: not significant, Pos: positive control, Psor: psoriasis biopsies (n = 20), Atopic D: Atopic dermatitis biopsies (n = 26). Source data are provided as a Data Source File.
Fig. 8
Fig. 8. Cell type specific receptor-ligand analysis and summary in sarcoidosis.
a Pie chart showing relative proportions of IL15 and IL6 producing cells in sarcoidosis scRNA-seq data from skin (see also Supplementary Fig. 7). b Dot plot of cellphone DB receptor-ligand interaction analysis for select receptor-ligand pairs, p value as determined using Cellphone DB script. c Summary of central cytokine and chemokine signals in sarcoidosis revealed by scRNA-seq and other experiments.
Fig. 9
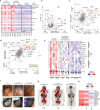
Fig. 9. Tofacitinib reduces cytokine and chemokine levels and markers of macrophage activation in plasma.
a Heatmap showing expression of selected transcripts from bulk RNAseq of skin; sample labels are summarized in Supplementary Table 5. b Volcano plot showing relative abundance of proteins in plasma from sarcoidosis patients in this trial compared to healthy controls, p values determined using t-tests, two-tailed. c Relative abundance of plasma proteins in sarcoidosis patients compared to controls (x-axis) compared to mRNA levels in skin of sarcoidosis patients (as determined by bulk-RNA-seq) compared to healthy controls (y-axis). Simple regression line with 95% confidence interval (shaded area) shown, goodness of fit calculated with R squared. d Relative abundance of proteins in plasma of sarcoidosis patients compared to healthy controls (x-axis) plotted against relative abundance of proteins in plasma of sarcoidosis patients at baseline (pre-tx) compared to after 6 months of tofacitinib (post-tx) (y-axis). The most consistently and highly differentially abundant proteins were used to create the sarcoidosis plasma signature (SPS) shown in the shaded box. e Heatmap showing plasma levels of SPS proteins in trial participants (before and after tofacitinib) and healthy controls, grouped by response pattern. Best responders include patients with a complete response in the skin (CSAMI 0 on treatment) and a complete or near complete response in other organs (98% or greater reduction in TLG). Partial responders include all other patients. f Clinical photographs of scalp and scrotal (biopsy-proven) sarcoidosis. Shown at baseline, after 6 months of tofacitinib at 5 mg twice daily, and after 12 months of tofacitinib 10 mg in the morning and 5 mg at night. g PET scans of the patient in panel f before tofacitinib, after 6 months at 5 mg twice daily, and after 14 months at 10 mg in the morning and 5 mg at night, TLG: total lesion glycolysis. h SPS levels corresponding to timepoints in (panel f).

Comment in

Similar articles

Cited by

References

    1. Rahaghi, F. F. et al. Delphi consensus recommendations for a treatment algorithm in pulmonary sarcoidosis. Eur Respir Rev29, 10.1183/16000617.0146-2019 (2020). - PMC - PubMed
    1. Judson MA. Causes of Poor Medication Adherence in Sarcoidosis: Poor Patient-Doctor Communication and Suboptimal Drug Regimens. Chest. 2020;158:17–18. doi: 10.1016/j.chest.2020.03.001. - DOI - PubMed
    1. Moller DR. Negative clinical trials in sarcoidosis: failed therapies or flawed study design? Eur. Respir. J. 2014;44:1123–1126. doi: 10.1183/09031936.00156314. - DOI - PubMed
    1. Judson MA, et al. Efficacy of infliximab in extrapulmonary sarcoidosis: results from a randomised trial. Eur. Respir. J. 2008;31:1189–1196. doi: 10.1183/09031936.00051907. - DOI - PubMed
    1. Baughman RP, et al. Infliximab therapy in patients with chronic sarcoidosis and pulmonary involvement. Am. J. Respir. Crit. Care Med. 2006;174:795–802. doi: 10.1164/rccm.200603-402OC. - DOI - PubMed

Publication types

Associated data