. 2022 May 13;376(6594):eabl4896.
doi: 10.1126/science.abl4896. Epub 2022 May 13.

The Tabula Sapiens: A multiple-organ, single-cell transcriptomic atlas of humans

Tabula Sapiens Consortium*Robert C JonesJim KarkaniasMark A KrasnowAngela Oliveira PiscoStephen R QuakeJulia SalzmanNir YosefBryan BulthaupPhillip BrownWilliam HarperMarisa HemenezRavikumar PonnusamyAhmad SalehiBhavani A SanagavarapuEileen SpallinoKsenia A AaronWaldo ConcepcionJames M GardnerBurnett KellyNikole NeidlingerZifa WangSheela CrastaSaroja KolluruMaurizio MorriSerena Y TanKyle J TravagliniChenling XuMarcela Alcántara-HernándezNicole AlmanzarJane AntonyBenjamin BeyersdorfDeviana BurhanKruti CalcuttawalaMatthew M CarterCharles K F ChanCharles A ChangStephen ChangAlex ColvilleRebecca N CulverIvana CvijovićGaetano D'AmatoCamille EzranFrancisco X GaldosAstrid GillichWilliam R GoodyerYan HangAlyssa HayashiSahar HoushdaranXianxi HuangJuan C IrwinSoRi JangJulia Vallve JuanicoAaron M KershnerSoochi KimBernhard KissWilliam KongMaya E KumarAngera H KuoBaoxiang LiGabriel B LoebWan-Jin LuSruthi MantriMaxim MarkovicPatrick L McAlpineAntoine de MorreeKarim MroujShravani MukherjeeTyler MuserPatrick NeuhöferThi D NguyenKimberly PerezNazan PulucaZhen QiPoorvi RaoHayley Raquer-McKayNicholas SchaumBronwyn ScottBobak SeddighzadehJoe SegalSushmita SenShaheen SikandarSean P SpencerLea C SteffesVarun R SubramaniamAditi SwarupMichael SwiftWill Van TreurenEmily TrimmStefan VeizadesSivakamasundari VijayakumarKim Chi VoSevahn K VorperianWanxin WangHannah N W WeinsteinJuliane WinklerTimothy T H WuJamie XieAndrea R YungYue ZhangAngela M DetweilerHoney MekonenNorma F NeffRene V SitMichelle TanJia YanGregory R BeanVivek CharuErna ForgóBrock A MartinMichael G OzawaOscar SilvaAngus TolandVenkata N P VemuriShaked AfikKyle AwayanOlga Borisovna BotvinnikAshley ByrneMichelle ChenRoozbeh DehghannasiriAdam GayosoAlejandro A GranadosQiqing LiGita MahmoudabadiAaron McGeeverJulia Eve OlivieriMadeline ParkNeha RavikumarGeoff StanleyWeilun TanAlexander J TarashanskyRohan VanheusdenPeter WangSheng WangGalen XingLes DethlefsenCamille EzranAstrid GillichYan HangPo-Yi HoJuan C IrwinSoRi JangRebecca LeylekShixuan LiuJonathan S MaltzmanRoss J MetzgerRagini PhansalkarKoki SasagawaRahul SinhaHanbing SongAditi SwarupEmily TrimmStefan VeizadesBruce WangPhilip A BeachyMichael F ClarkeLinda C GiudiceFranklin W HuangKerwyn Casey HuangJuliana IdoyagaSeung K KimChristin S KuoPatricia NguyenThomas A RandoKristy Red-HorseJeremy ReiterDavid A RelmanJustin L SonnenburgAlbert WuSean M WuTony Wyss-Coray

The Tabula Sapiens: A multiple-organ, single-cell transcriptomic atlas of humans

Tabula Sapiens Consortium* et al. Science. .

Abstract

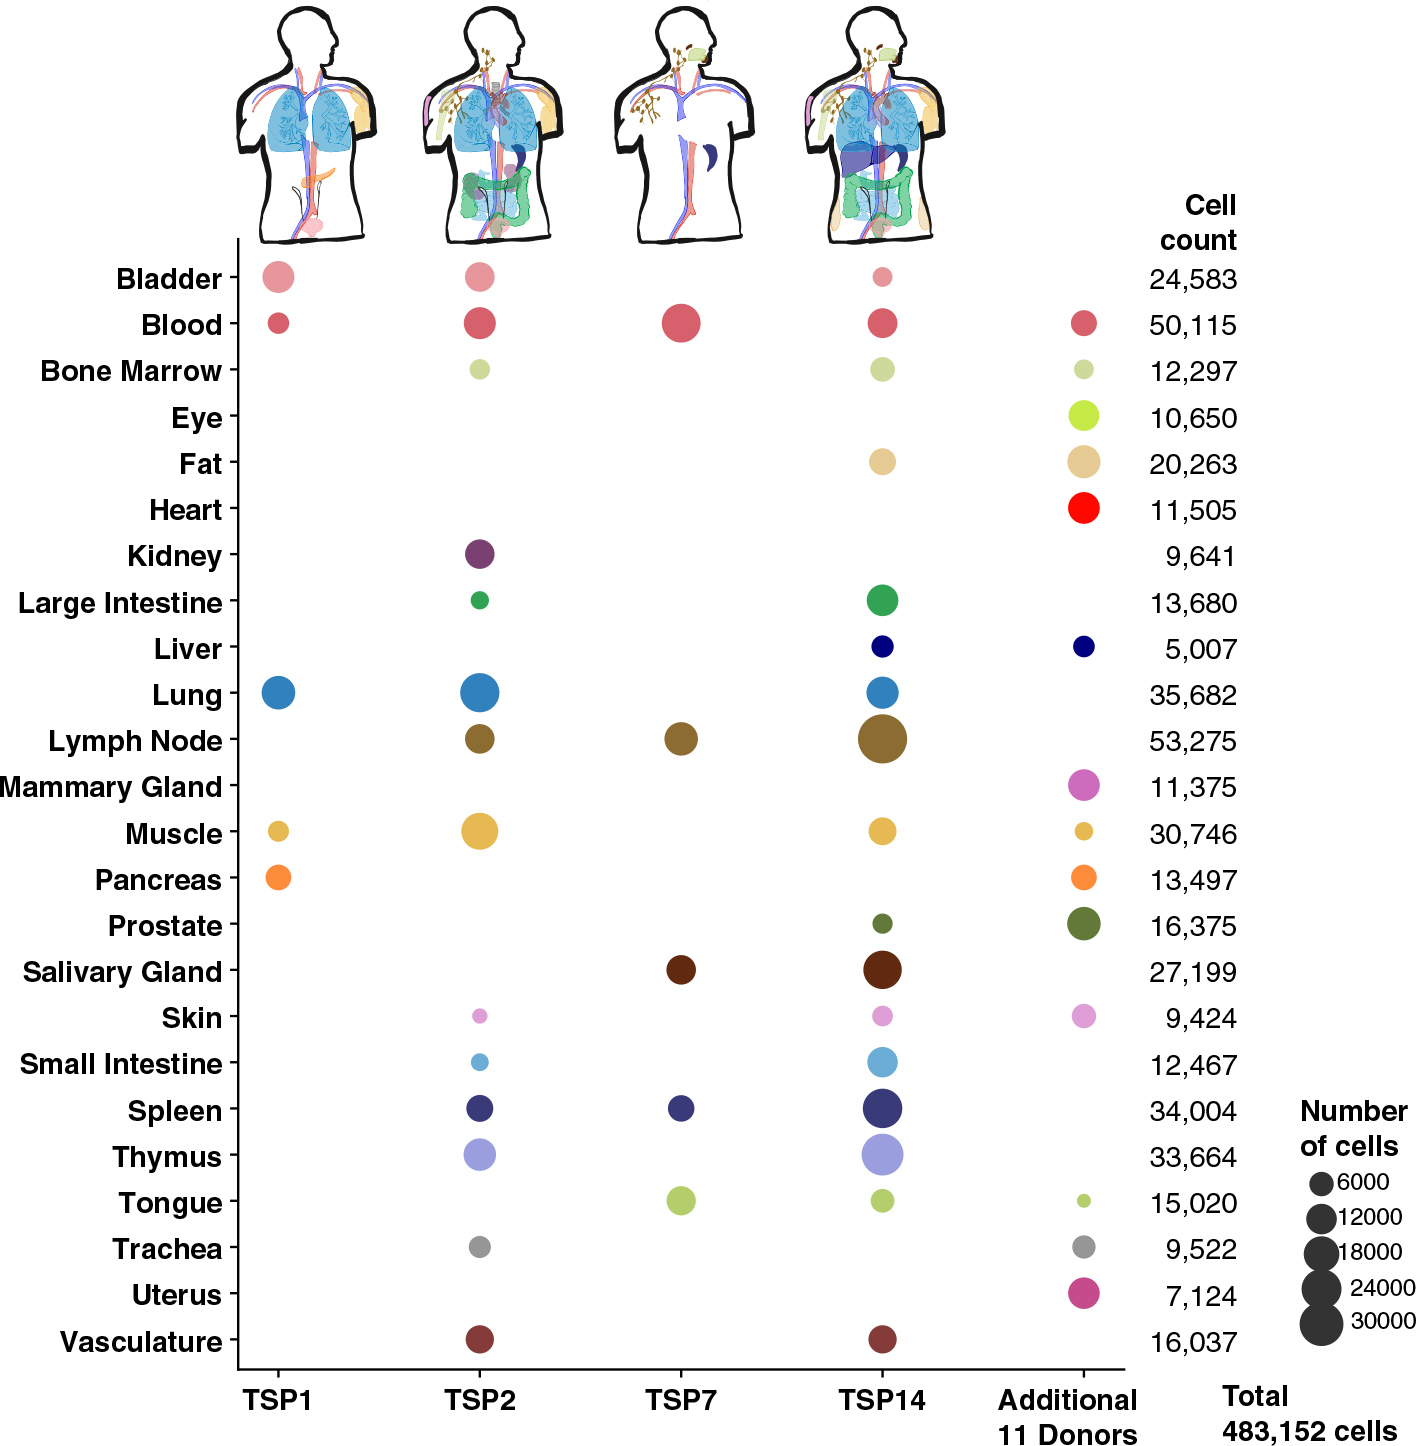
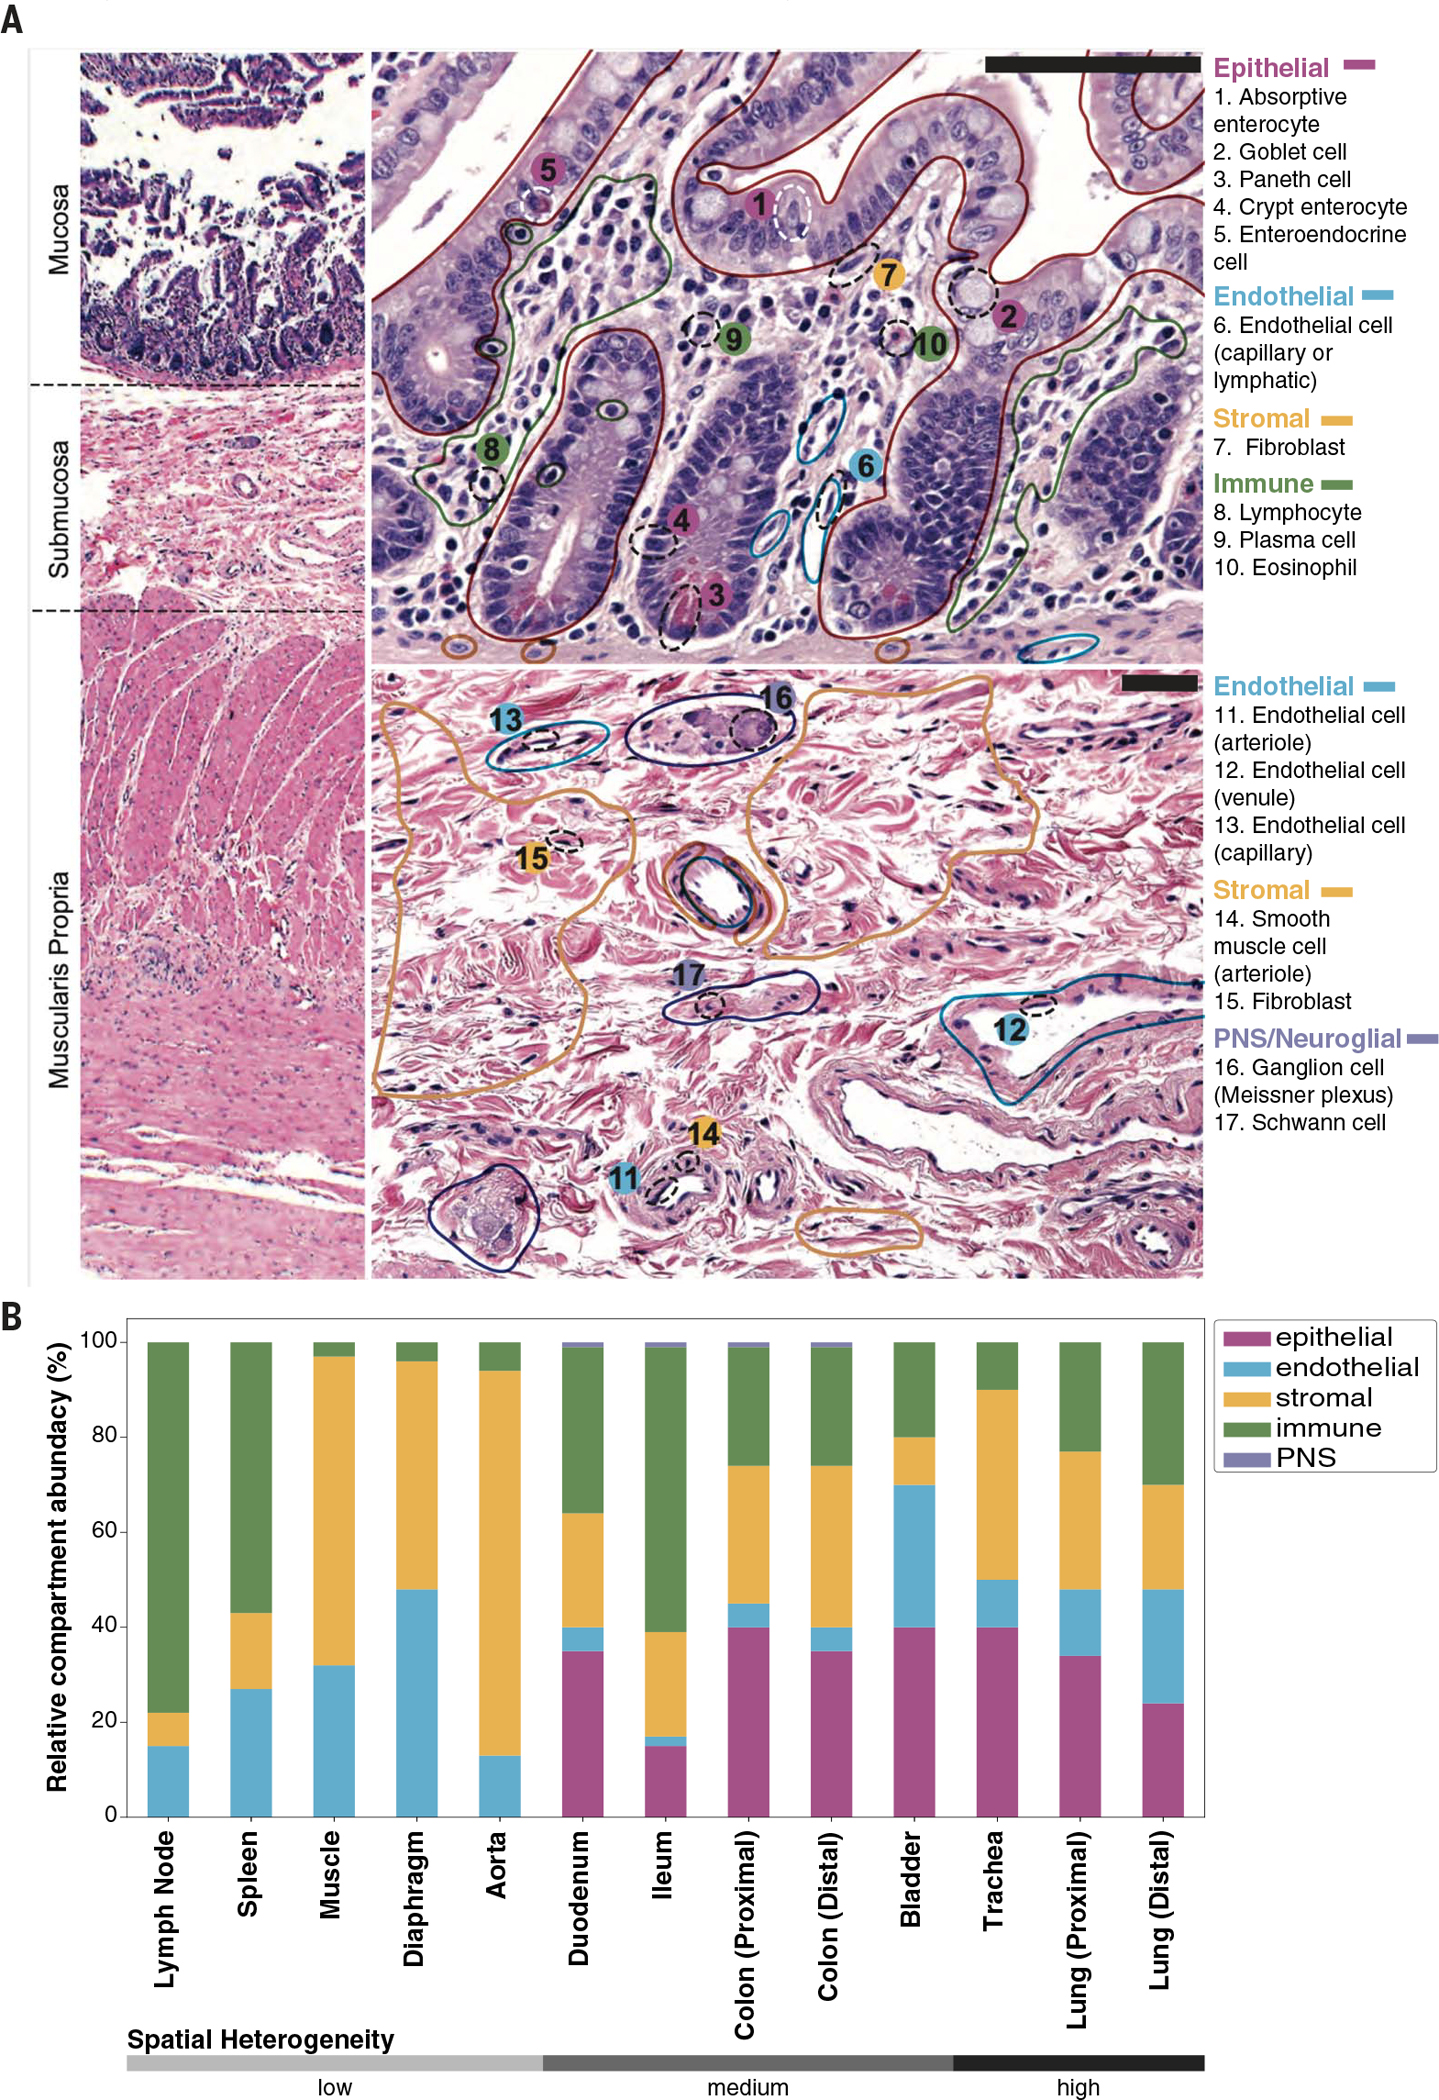
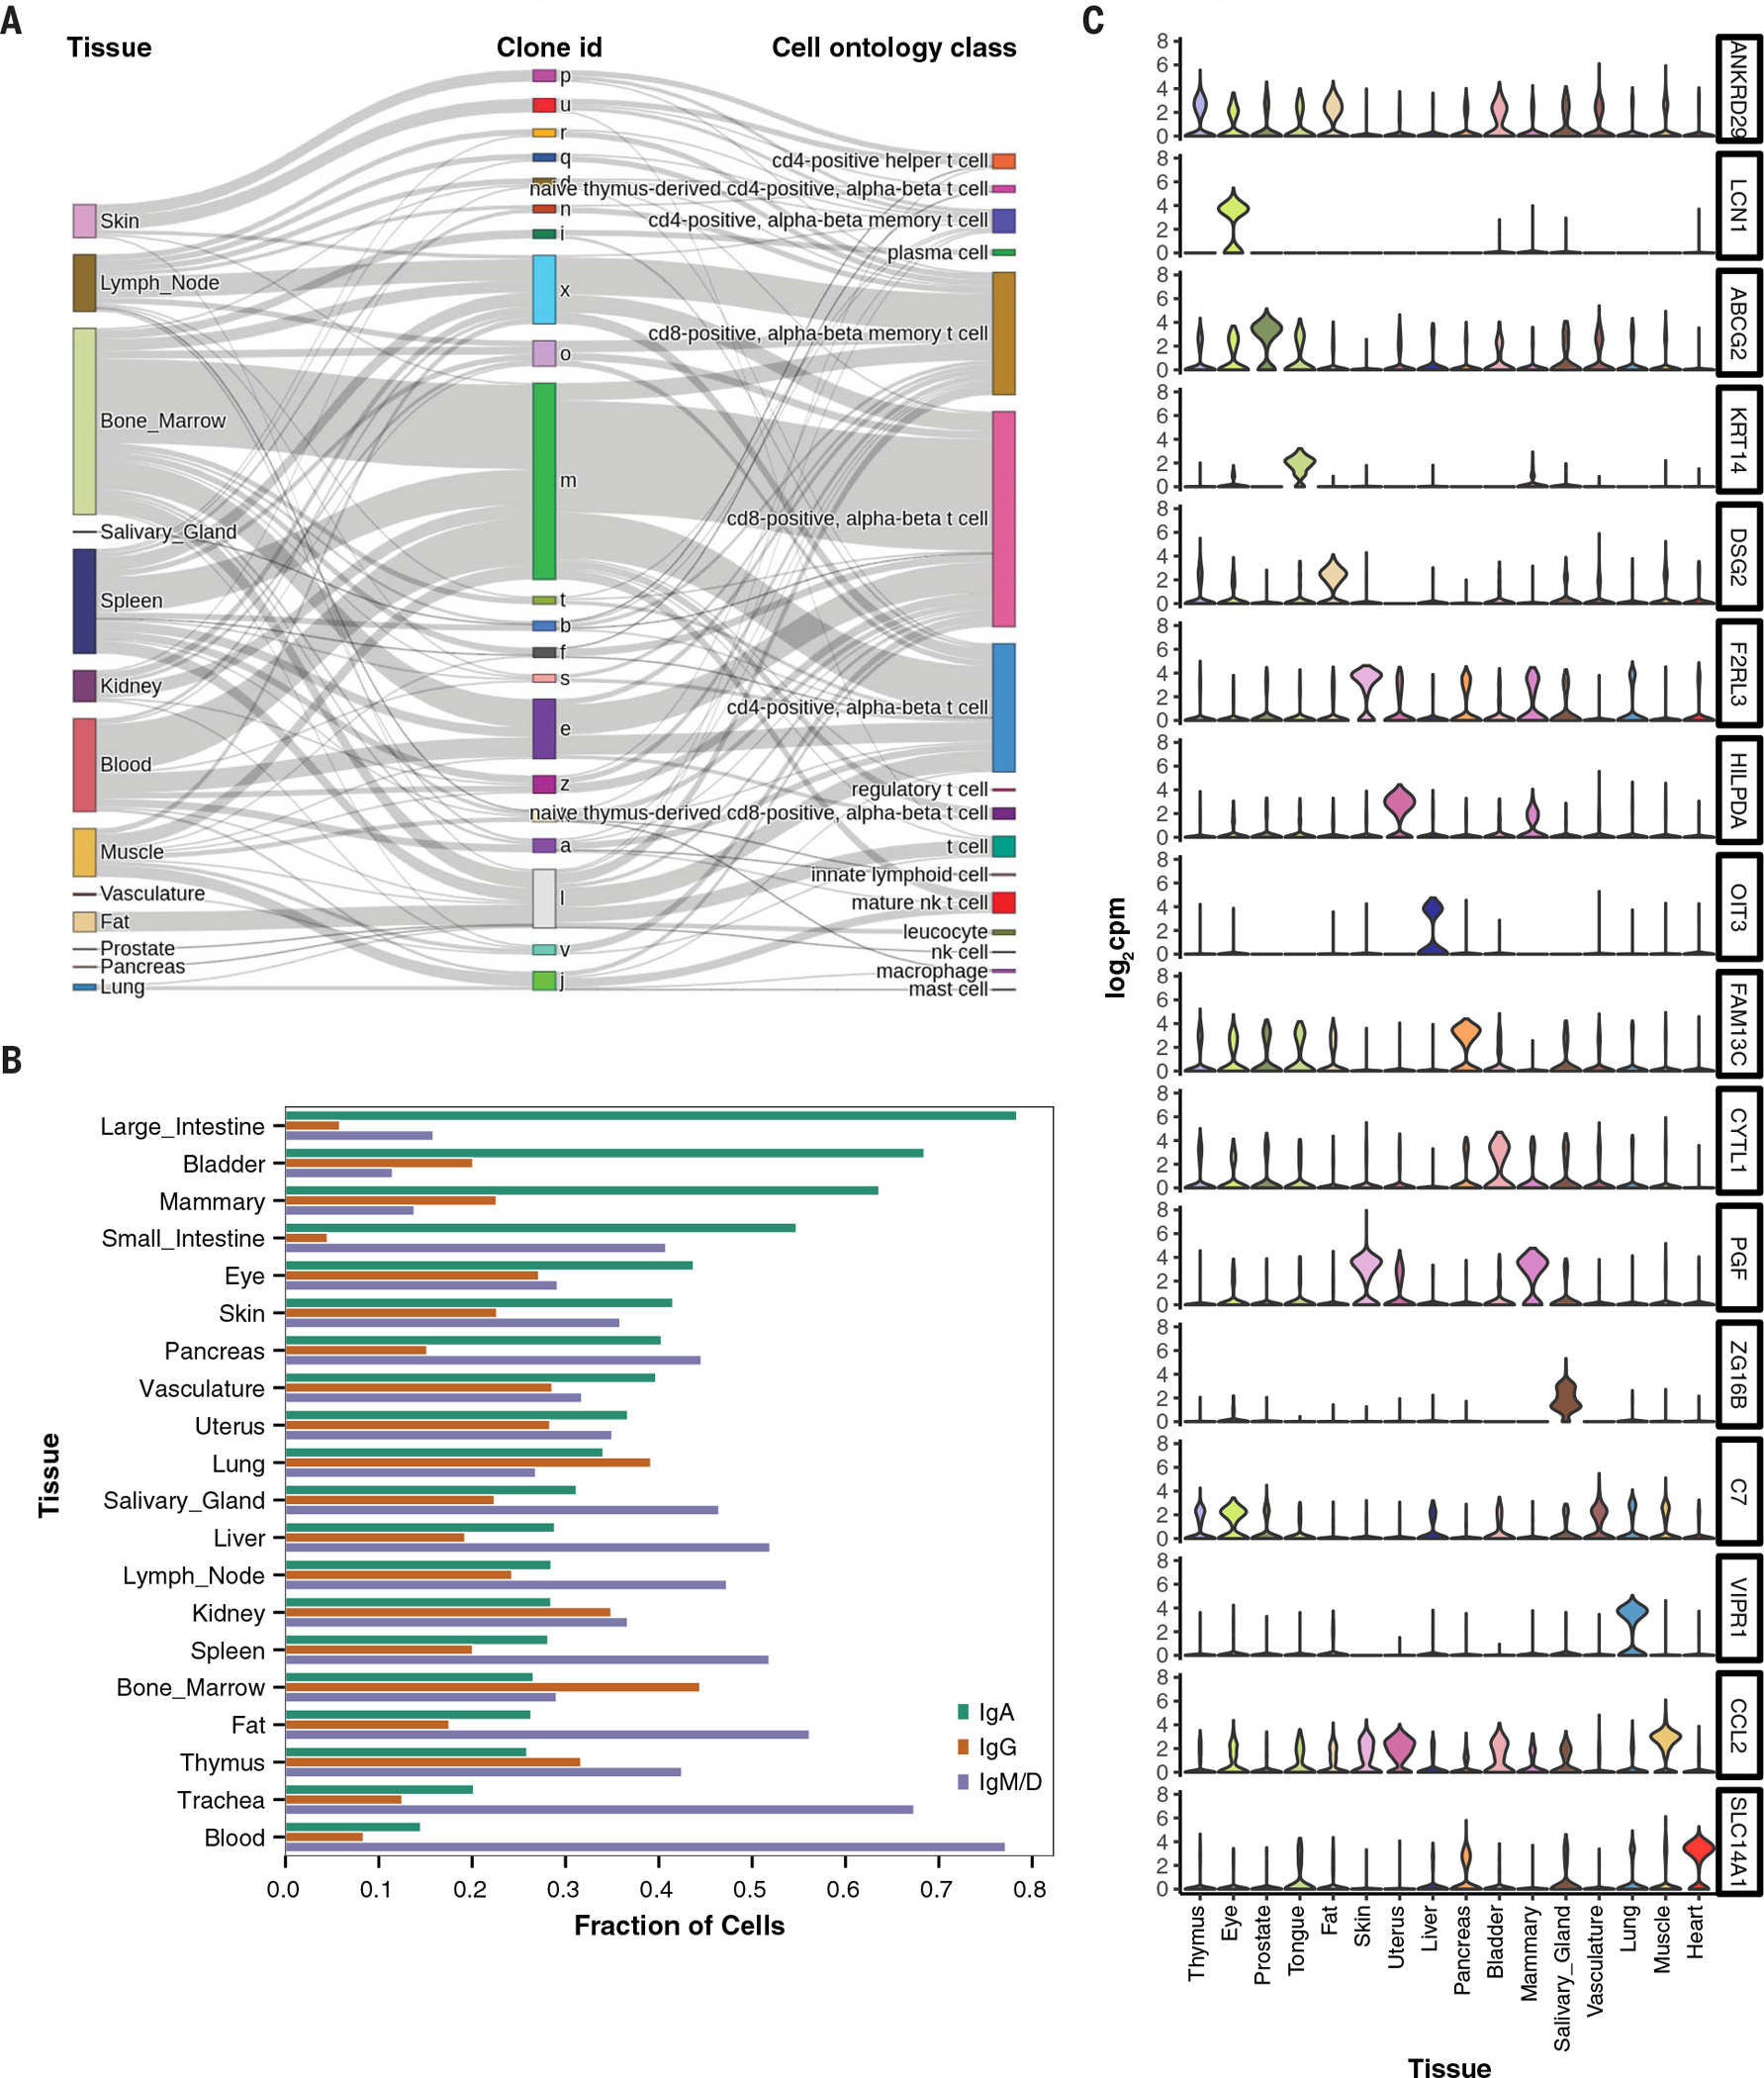
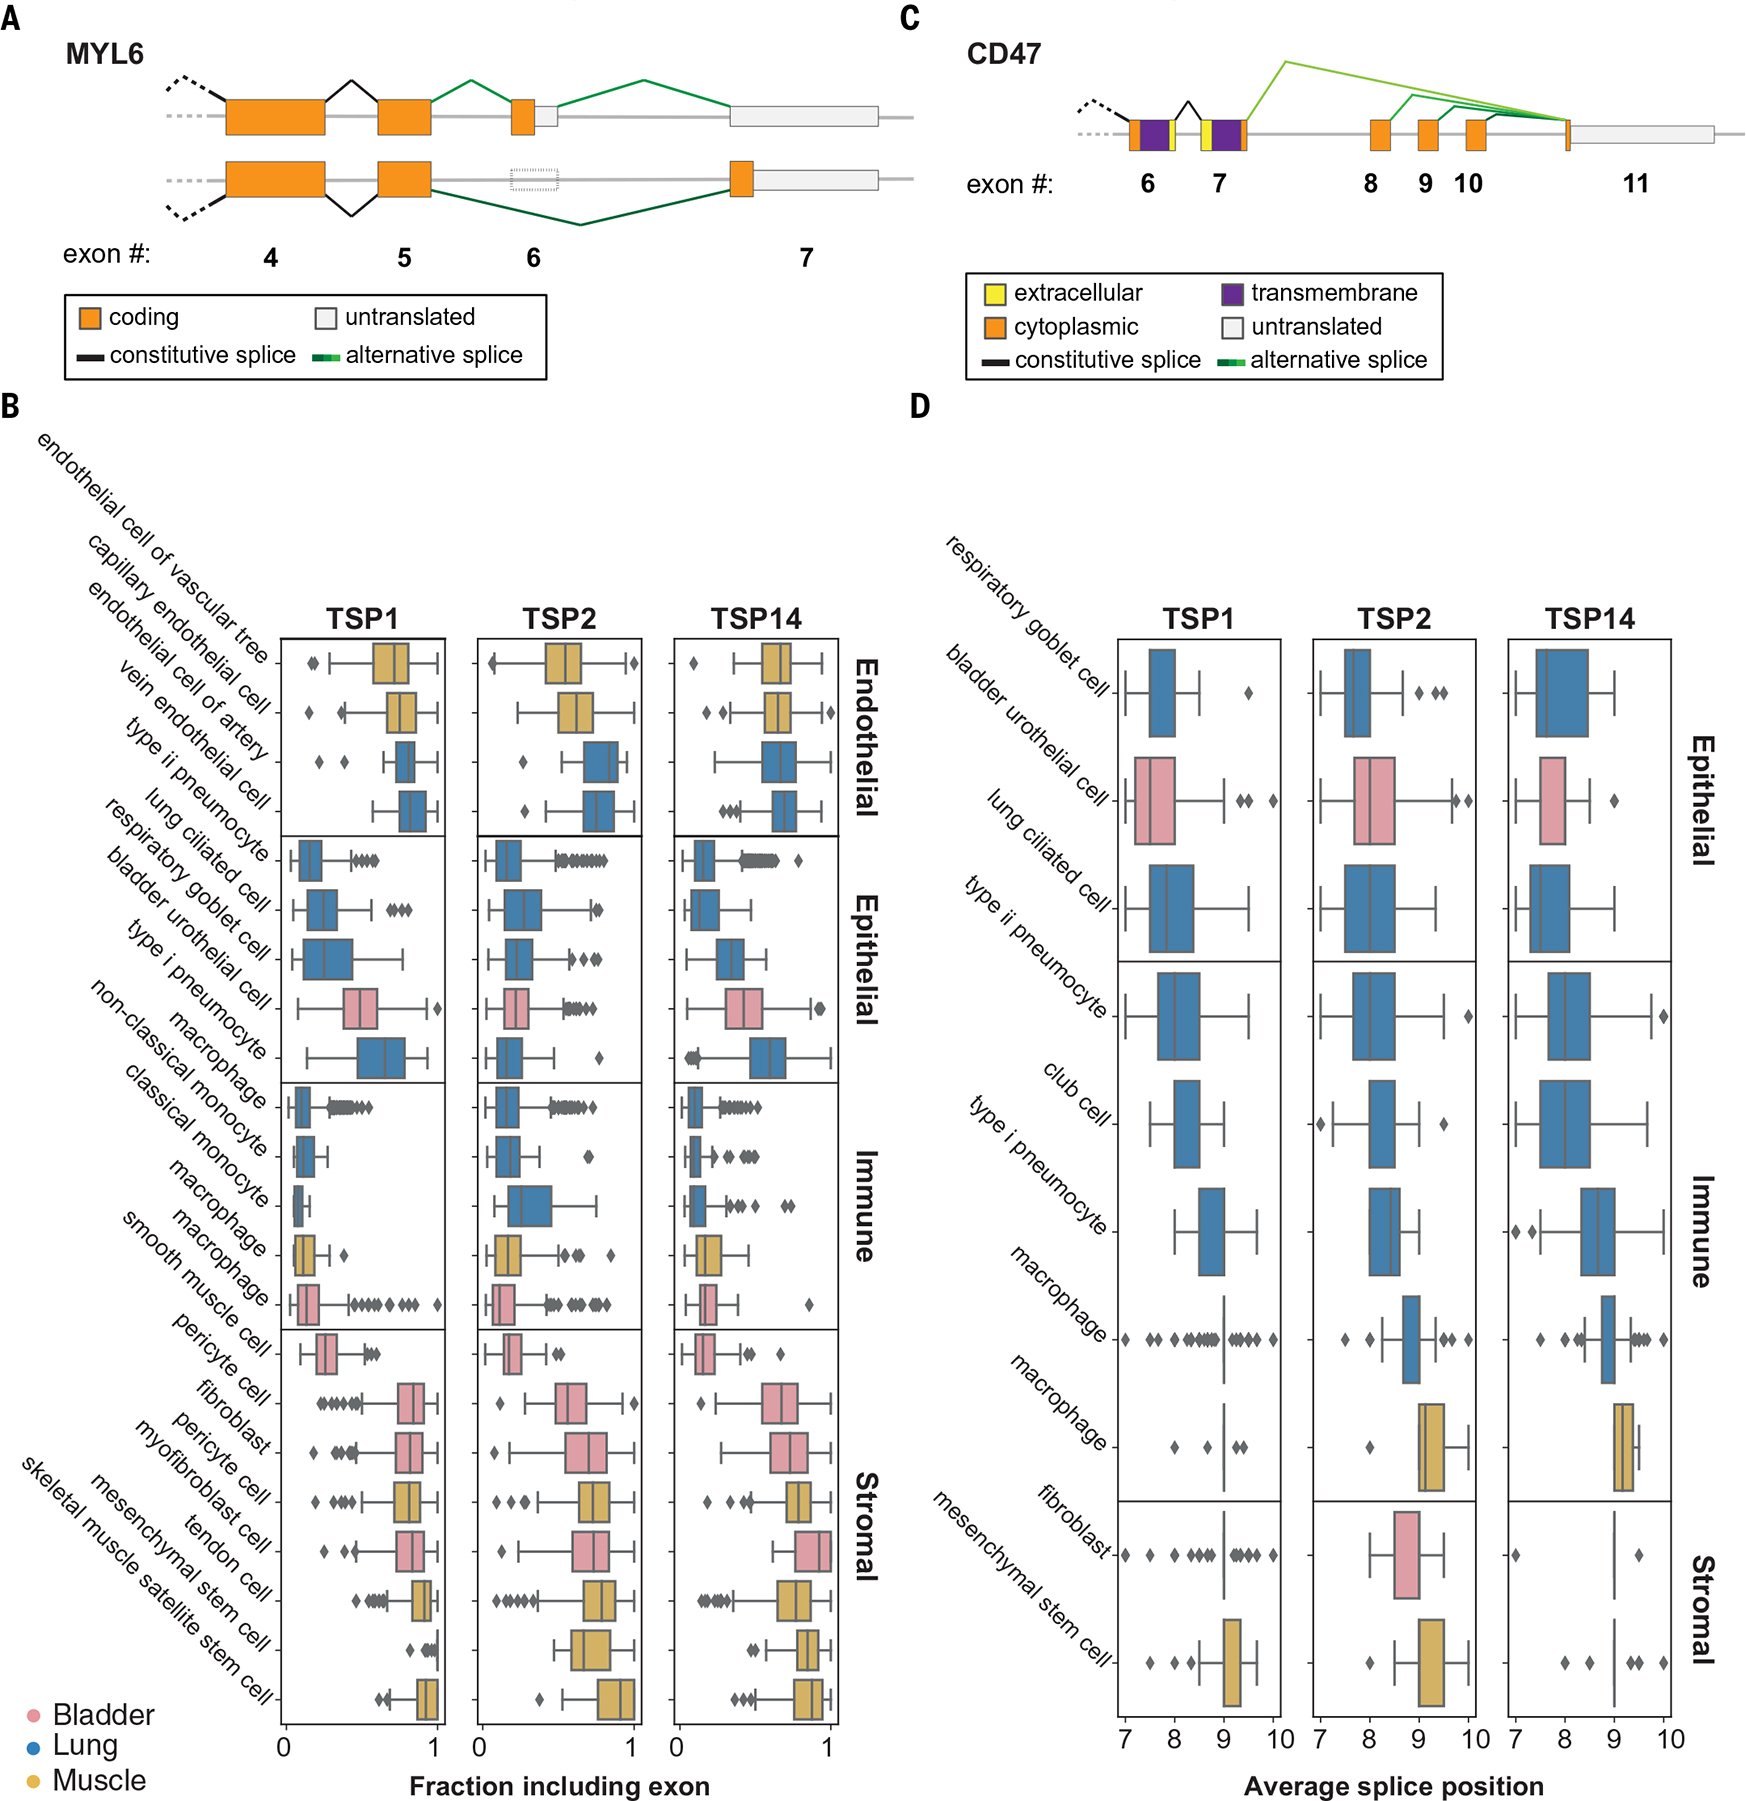
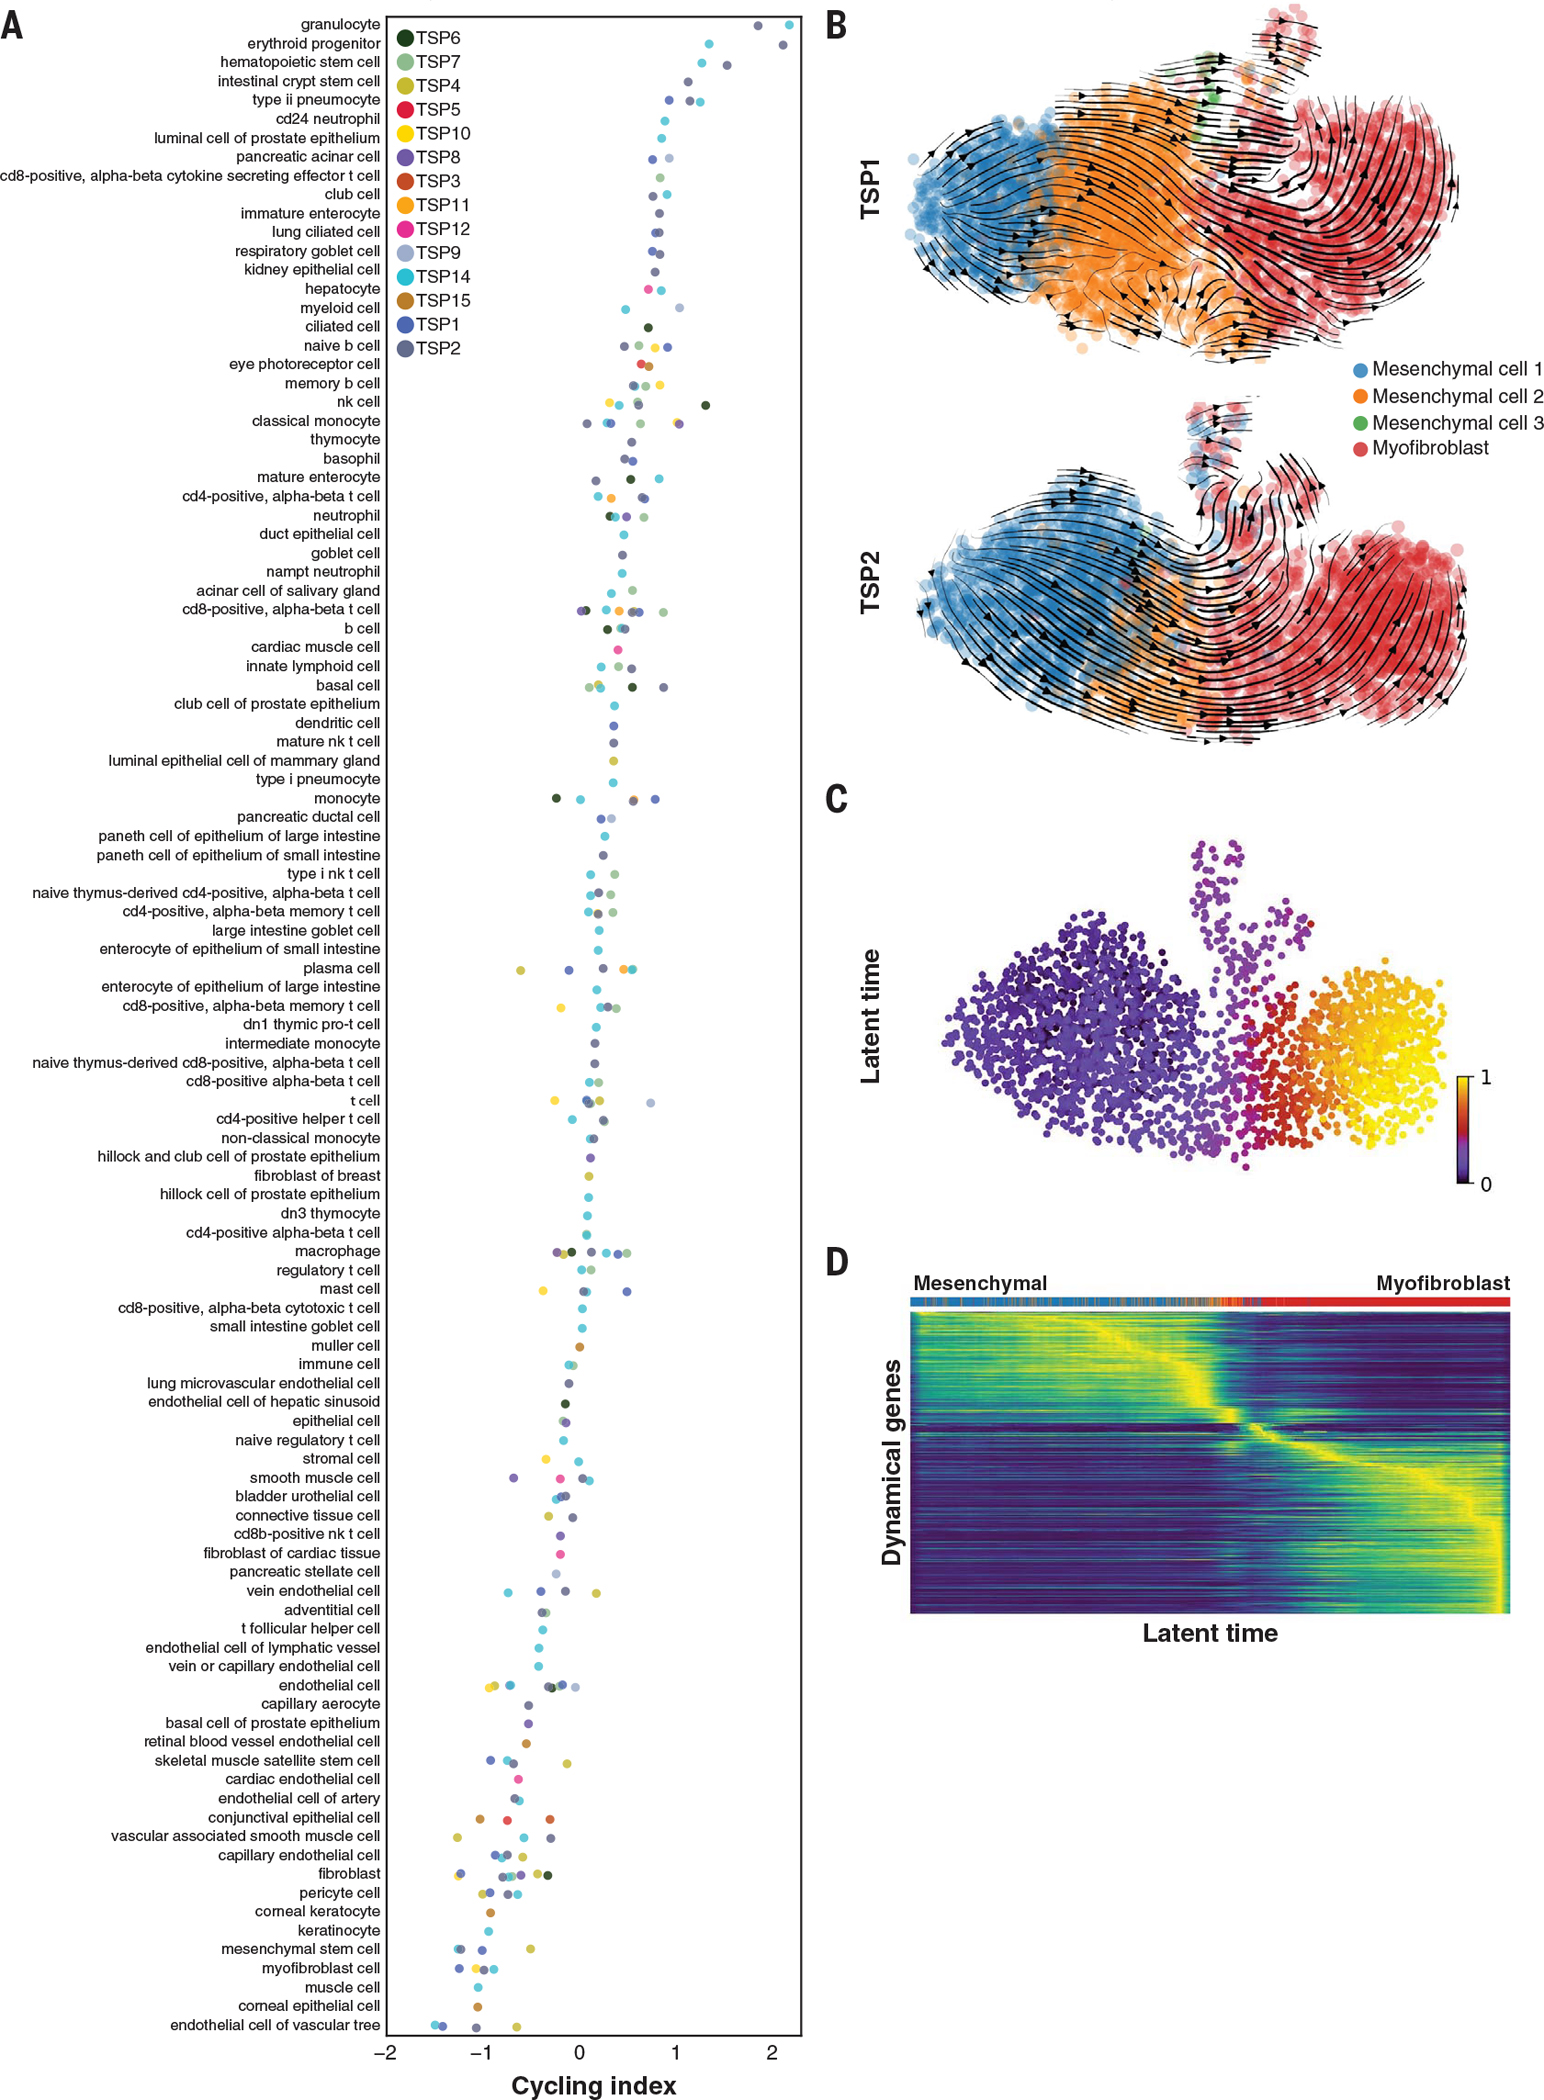
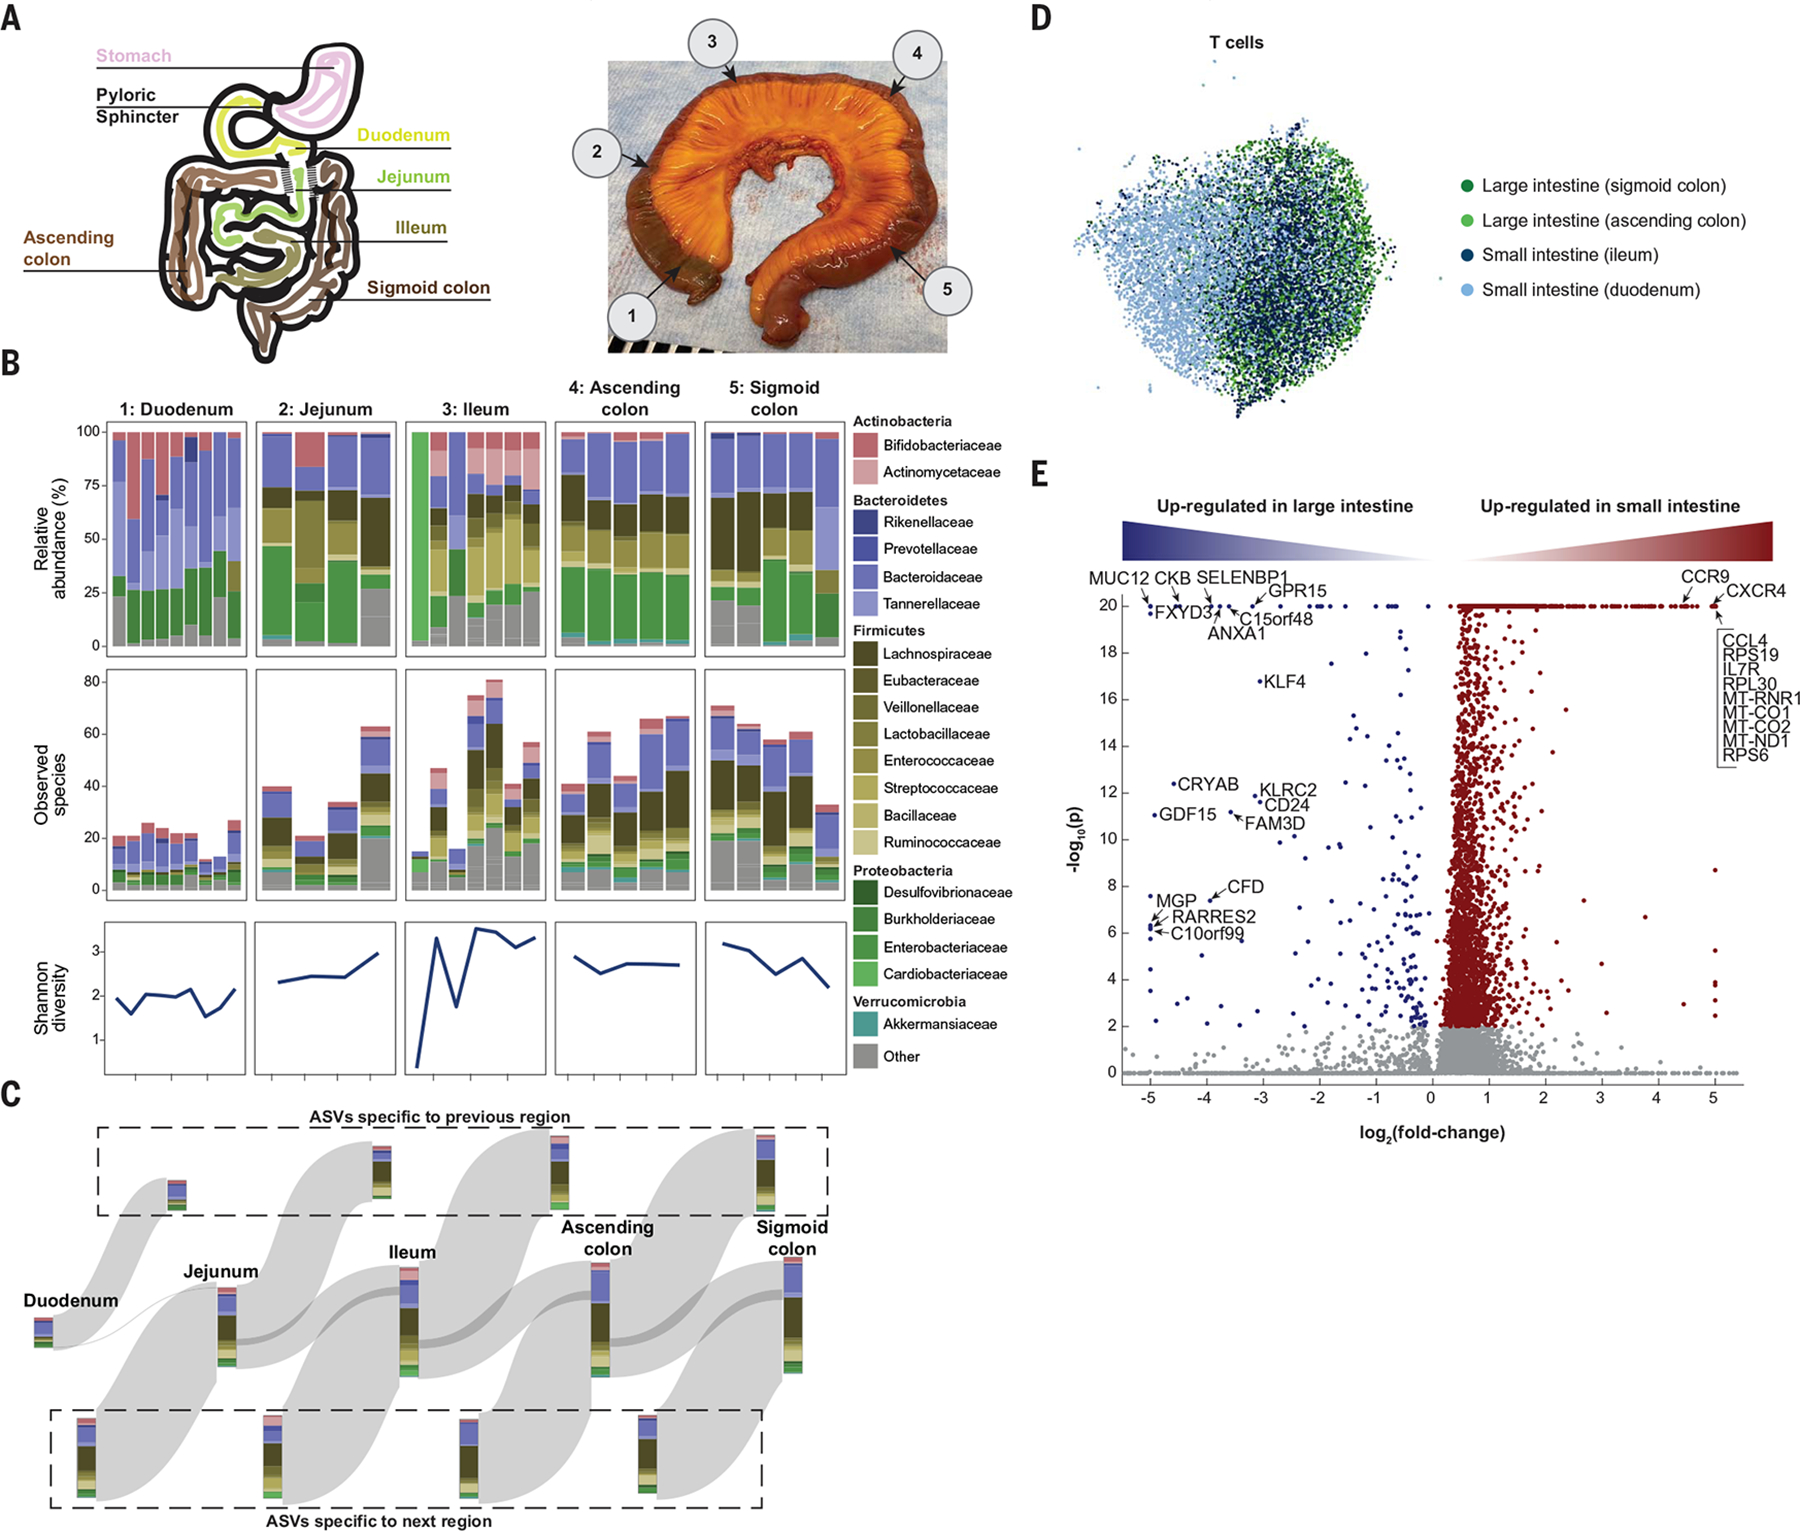
Molecular characterization of cell types using single-cell transcriptome sequencing is revolutionizing cell biology and enabling new insights into the physiology of human organs. We created a human reference atlas comprising nearly 500,000 cells from 24 different tissues and organs, many from the same donor. This atlas enabled molecular characterization of more than 400 cell types, their distribution across tissues, and tissue-specific variation in gene expression. Using multiple tissues from a single donor enabled identification of the clonal distribution of T cells between tissues, identification of the tissue-specific mutation rate in B cells, and analysis of the cell cycle state and proliferative potential of shared cell types across tissues. Cell type-specific RNA splicing was discovered and analyzed across tissues within an individual.


Conflict of interest statement

Competing interests: N. Yosef is an advisor and/or has equity in for Cellarity, Celsius Therapeutics, and Rheos Medicines. The authors declare no other competing interests.

Figures

Fig. 1.
Fig. 1.. Overview of Tabula Sapiens.
The Tabula Sapiens was constructed with data from 15 human donors; for detailed information on which tissues were examined for each donor, please refer to table S2. Demographic and clinical information about each donor is listed in the supplementary materials and methods and in table S1. Donors 1, 2, 7, and 14 contributed the largest number of tissues each, and the number of cells from each tissue is indicated by the size of each circle. Tissue contributions from additional donors who contributed single or small numbers of tissues are shown in the additional 11 donors column, and the total number of cells for each organ are shown in the final column on the right.
Fig. 2.
Fig. 2.. Comparison of single-cell transcriptomics with conventional histology.
Clinical pathology was performed on nine tissues from donors TSP2 and TSP14. (A) H&E–stained image used for histology of the colon from TSP2, with compartments (solid colored lines) and individual cell types (dashed black ellipses) identified by the pathologists. (B) Coarse cell type representation of TSP2 as morphologically estimated by pathologists across several tissues, ordered by increasing heterogeneity of the tissue. Compartment colors are consistent between (A) and (B).
Fig. 3.
Fig. 3.. Analysis of immune and endothelial cell types shared across tissues.
(A) Illustration of clonal distribution of T cells across multiple tissues. The majority of T cell clones are found in multiple tissues and represent a variety of T cell subtypes. nk cell, natural killer cell. (B) Prevalence of B cell isotypes across tissues, ordered by decreasing abundance of IgA. (C) Expression levels of tissue-specific endothelial markers, shown as violin plots, in the entire dataset. Many of the markers are highly tissue specific and typically were derived from multiple donors, as follows: bladder (3 donors), eye (2), fat (2), heart (1), liver (2), lung (3), mammary (1), muscle (4), pancreas (2), prostate (2), salivary gland (2), skin (2), thymus (2), tongue (2), uterus (1), and vasculature (2). A detailed donor-tissue breakdown is available in table S2.
Fig. 4.
Fig. 4.. Alternative splicing analysis.
(A and B) The sixth exon in MYL6 is skipped at different proportions in different compartments. Cells in the immune and epithelial compartments tend to skip the exon, whereas cells in the endothelial and stromal compartments tend to include the exon. Boxes are grouped by compartment and colored by tissue. The fraction of junctional reads that include exon 6 was calculated for each cell with >10 reads mapping to the exon-skipping event. Horizontal box plots in (B) show the distribution of exon inclusion in each cell type. (C and D) Alternative splicing in CD47 involves one 5′ splice site (exon 11; 108,047,292) and four 3′ splice sites. Horizontal box plots in (D) show the distribution of weighted averages of alternative 3′ splice sites in each cell type. Epithelial cells tend to use exons closer to the 5′ splice site compared with immune and stromal cells. Boxes are grouped by compartment and colored by tissue.
Fig. 5.
Fig. 5.. Dynamic changes in cell state.
(A) Cell types ordered by magnitude of cell cycling index per donor (each a separate color), with the most highly proliferative at the top and quiescent cells at the bottom of the list. (B) RNA velocity analysis demonstrating mesenchymal-to-myofibroblast transition in the bladder. The arrows represent a flow derived from the ratio of unspliced to spliced transcripts, which in turn predicts dynamic changes in cell identity. (C and D) Latent time analysis of the mesenchymal-to-myofibroblast transition in the bladder, demonstrating stereotyped changes in gene expression trajectory.
Fig. 6.
Fig. 6.. High-resolution view highlights patchiness of the gut microbiome.
(A) Schematic (left) and photo (right) of the colon from donor TSP2, with numbers 1 to 5 representing microbiota sampling locations. (B) Relative abundances and richness (number of observed species) at the family level in each sampling location, as determined by 16S rRNA sequencing. The Shannon diversity, a metric of evenness, mimics richness. Variability in relative abundance and/or richness or Shannon diversity was higher in the duodenum, jejunum, and ileum compared with the ascending and sigmoid colon. (C) A Sankey diagram showing the inflow and outflow of microbial species from each section of the gastrointestinal tract. The stacked bar for each gastrointestinal section represents the number of observed species in each family as the union of all sampling locations for that section. The stacked bar flowing out represents gastrointestinal species not found in the subsequent section, and the stacked bar flowing into each gastrointestinal section represents the species not found in the previous section. ASVs, amplicon sequence variants. (D) UMAP clustering of T cells reveals distinct transcriptome profiles in the distal and proximal small and large intestines. (E) Dots in volcano plot highlight genes up-regulated in the large (left) and small (right) intestines. Labeled dots include genes with known roles in trafficking, survival, and activation.

Comment in

Similar articles

Cited by

References

    1. Alberts B, Johnson A, Lewis J, Raff M, Roberts K, Walter P, Molecular Biology of the Cell (Garland Science, ed. 4, 2002).
    1. Regev A et al., The human cell atlas. eLife 6, e27041 (2017). doi: 10.7554/eLife.27041 - DOI - PMC - PubMed
    1. Uhlén M et al., Tissue-based map of the human proteome. Science 347, 1260419 (2015). doi: 10.1126/science.1260419 - DOI - PubMed
    1. Thul PJ et al., A subcellular map of the human proteome. Science 356, eaal3321 (2017). doi: 10.1126/science.aal3321 - DOI - PubMed
    1. Pisco AO, Tojo B, McGeever A, Single-Cell Analysis for Whole-Organism Datasets. Annu. Rev. Biomed. Data Sci. 4, 207–226 (2021). doi: 10.1146/annurev-biodatasci-092820-031008 - DOI - PubMed