. 2022 Mar 22;12(1):4915.
doi: 10.1038/s41598-022-08914-6.

Conditional loss of IKKα in Osterix + cells has no effect on bone but leads to age-related loss of peripheral fat

Affiliations

Conditional loss of IKKα in Osterix + cells has no effect on bone but leads to age-related loss of peripheral fat

Jennifer L Davis et al. Sci Rep. .

Abstract

NF-κB has been reported to both promote and inhibit bone formation. To explore its role in osteolineage cells, we conditionally deleted IKKα, an upstream kinase required for non-canonical NF-κB activation, using Osterix (Osx)-Cre. Surprisingly, we found no effect on either cancellous or cortical bone, even following mechanical loading. However, we noted that IKKα conditional knockout (cKO) mice began to lose body weight after 6 months of age with severe reductions in fat mass and lower adipocyte size in geriatric animals. qPCR analysis of adipogenic markers in fat pads of cKO mice indicated no difference in early differentiation, but instead markedly lower leptin with age. We challenged young mice with a high fat diet finding that cKO mice gained less weight and showed improved glucose metabolism. Low levels of recombination at the IKKα locus were detected in fat pads isolated from old cKO mice. To determine whether recombination occurs in adipocytes, we examined fat pads in Osx-Cre;TdT reporter mice; these showed increasing Osx-Cre-mediated expression in peripheral adipocytes from 6 weeks to 18 months. Since Osx-Cre drives recombination in peripheral adipocytes with age, we conclude that fat loss in cKO mice is most likely caused by progressive deficits of IKKα in adipocytes.


Conflict of interest statement

The authors declare no competing interests.

Figures

Figure 1
Figure 1
IKKα cKO mice have similar basal bone mass compared to controls. (a) Cancellous bone volume fraction (BV/TV) or (b) Cortical thickness (Ct.Th) of tibiae at 6 wks (n = 12), 12 wks (n = 11–13), 6 mo (n = 11), 12 mo (n = 11) by in vivo microCT. (c) Whole body bone mineral density by dual-energy x-ray absorptiometry (DXA) for 18–20 mo mice (n = 11). Data are represented as mean ± SD. CON = black circles, cKO = red triangles, all male mice. Non-significant between genotypes at each age by student’s, unpaired, two-tailed t-test.
Figure 2
Figure 2
IKKα cKO mice have a similar response to anabolic loading compared to control. Anabolic response to unilateral axial tibial compression was assessed by dynamic histomorphometry, measuring parameters along the periosteum (Ps) after 2 wks. (a) Bone formation rate per bone surface (Ps.BFR/BS), (b) Mineralizing surface per bone surface (Ps.MS/BS), and (c) Mineral apposition rate (Ps.MAR). CON = black, cKO = red, all male mice. Right tibiae were loaded (Load, triangles) and left tibiae served as non-loaded (NL, circles) controls. Results are presented as mean ± SD. n = 12 per genotype. 2-way ANOVA followed by Tukey’s multiple comparison test; response to load within genotypes. There were no significant differences between genotypes, or interactions between genotype and loading.
Figure 3
Figure 3
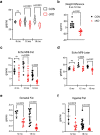
IKKα cKO mice have attenuated weight gain, lower total fat, and less lean mass with age. (a) Body weights at 6 mo (n = 15–16), 12 mo (n = 28–31), 18 mo (n = 11–13). (b) Weight change (%) from 6 to 12 mo (n = 11). EchoMRI measurement of (c) total fat mass and (d) total lean mass at 6mo (n = 6), 12mo (n = 5–9), 18mo (n = 10–11). (e) Gonadal and (f) Inguinal fat pad weights at 12 mo (n = 4–9) and 18 mo (n = 11–14). Data are represented as mean ± SD, all male mice. CON = black, cKO = red. Student’s, unpaired, two-tailed t-test (for b) or 2-way ANOVA followed by Sidak multiple comparisons test (cross genotype comparisons): ns – non-significant.
Figure 4
Figure 4
Older IKKα cKO mice show improved glucose tolerance. Glucose Tolerance Test (GTT) was performed after a 6 h fast at all ages and overnight (O/N) at 18–20 mo. CON = black, cKO = red, all male mice. Blood glucose measurements at (a) 7–9 mo (n = 7–9), (b) 13–15 mo (n = 5–6), (c) 18–20 mo (n = 4–7), and (d) 18–20 mo after O/N fast (n = 4–7). Data are represented as mean ± SD. Repeated measures 2-way ANOVA followed by Sidak multiple comparisons test, with p values indicated where significant.
Figure 5
Figure 5
Osx-Cre mediates recombination in peripheral adipocytes. (a) PCR of genomic DNA from inguinal fat (IF), gonadal fat (GF), renal fat (RF), and brown fat (BF), isolated from 15 mo male mice. Whole, flushed bone was used as a positive control (POS). Intact floxed allele = 1.3 kb and recombination product = 460 bp. *, sample lost in loading. Right panel was originally on the bottom row of the same gel as the left panel. n = 3 biological replicates. Representative immunofluorescence staining for (b) Perilipin (green) or (c) CD45 (green) in inguinal fat from Osx-Cre;TdT reporter mice (red) at 6 wks, 12 wks, 6 mo, 18 mo, or Osx-Cre control mice at 18 mo.
Figure 6
Figure 6
Aging IKKα cKO fat pads are smaller and show decreased leptin expression. (a) (left) Representative H&E staining of gonadal fat from 18 months old CON and cKO mice and (right) quantification of adipocyte size. CON = black, cKO = red. (b) qPCR for PPARγ from gonadal fat in CON (n = 4–9) and cKO (n = 4–7) mice at indicated ages. (c) qPCR for Leptin, as in (b). (d) Total food intake was measured daily over 3–4 days in CON (n = 4–5) and cKO (n = 5–9) mice at indicated ages and normalized to bodyweight. Data represented as mean ± SD. At least 350 adipocytes from 3 independent samples of each genotype were measured and unpaired, two-tailed student’s t-test was performed (for a). Technical duplicates were averaged (b,c), and 2-way ANOVA followed by Sidak multiple comparisons test was performed (b,c,d), with values indicated where significant.
Figure 7
Figure 7
IKKα cKO mice show blunted weight and fat gain after HFD. Body weights (BW), (a) Initial or (b) after HFD for 8 wks. (c) EchoMRI of total fat mass or (d) total lean mass after 8wks on HFD. CON = blue, cKO = green. Data are represented as mean ± SD. Female mice (initial BW, n = 15–23; HFD BW, n = 12–18; EchoMRI, n = 10–14). Repeated measures 2-way ANOVA followed by Sidak multiple comparisons test for body weight on HFD for b and Student’s, unpaired, two-tailed t-test for a,c, and d. HFD = high fat diet.
Figure 8
Figure 8
IKKα cKO mice show improved glucose metabolism after HFD. Blood glucose levels were measured during Glucose Tolerance Tests (GTT) and Insulin Tolerance Tests (ITT), which were initiated after a 6 h fast, in female mice. (ad) Tests were performed after 8–11 wks on HFD (n = 6–10). (a) GTT, (b) area under the curve (AUC) for GTT, (c) ITT, and (d) AUC for ITT. (ei) Tests were repeated on a subset of mice after 20–23 wks on HFD (n = 4–6). (e) body weight at time of GTT, (f) GTT, (g) AUC for GTT, (h) ITT, and (i) AUC for ITT. CON = blue, cKO = green. Data are represented as mean ± SD. Repeated measures 2-way ANOVA followed by Sidak multiple comparisons test for GTT and ITT or Student’s, unpaired, two-tailed t-test for body weight and AUC.

Similar articles

Cited by

References

    1. Sun SC. Non-canonical NF-kappaB signaling pathway. Cell Res. 2011;21:71–85. doi: 10.1038/cr.2010.177. - DOI - PMC - PubMed
    1. Benezech C, et al. Lymphotoxin-beta receptor signaling through NF-kappaB2-RelB pathway reprograms adipocyte precursors as lymph node stromal cells. Immunity. 2012;37:721–734. doi: 10.1016/j.immuni.2012.06.010. - DOI - PMC - PubMed
    1. Roozendaal R, Mebius RE. Stromal cell-immune cell interactions. Annu. Rev. Immunol. 2011;29:23–43. doi: 10.1146/annurev-immunol-031210-101357. - DOI - PubMed
    1. Weih F, Caamano J. Regulation of secondary lymphoid organ development by the nuclear factor-kappaB signal transduction pathway. Immunol. Rev. 2003;195:91–105. doi: 10.1034/j.1600-065x.2003.00064.x. - DOI - PubMed
    1. Briseno CG, et al. Deficiency of transcription factor RelB perturbs myeloid and DC development by hematopoietic-extrinsic mechanisms. Proc. Natl. Acad. Sci. USA. 2017;114:3957–3962. doi: 10.1073/pnas.1619863114. - DOI - PMC - PubMed

Publication types

LinkOut - more resources