. 2022 May:51:102251.
doi: 10.1016/j.redox.2022.102251. Epub 2022 Jan 29.

Interplay between mitochondrial reactive oxygen species, oxidative stress and hypoxic adaptation in facioscapulohumeral muscular dystrophy: Metabolic stress as potential therapeutic target

Affiliations

Interplay between mitochondrial reactive oxygen species, oxidative stress and hypoxic adaptation in facioscapulohumeral muscular dystrophy: Metabolic stress as potential therapeutic target

Philipp Heher et al. Redox Biol. 2022 May.

Abstract

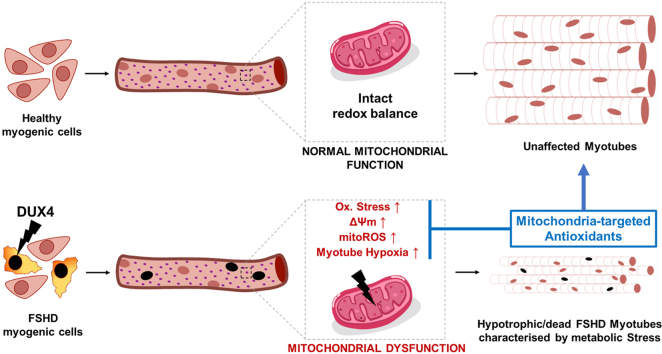
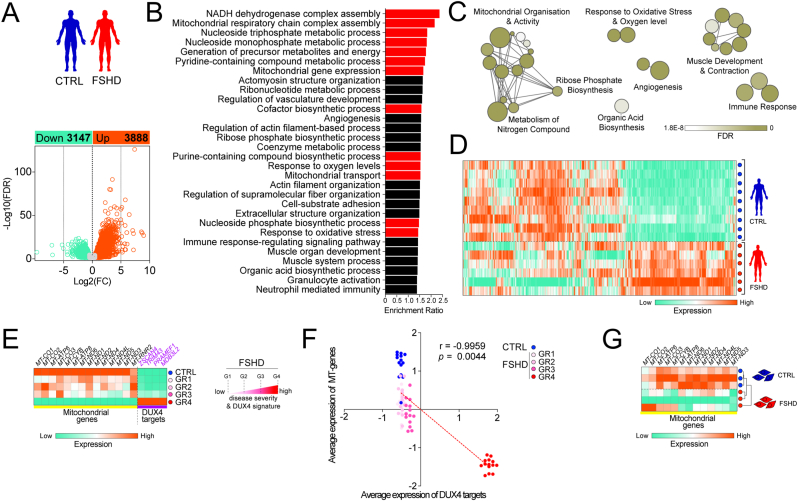
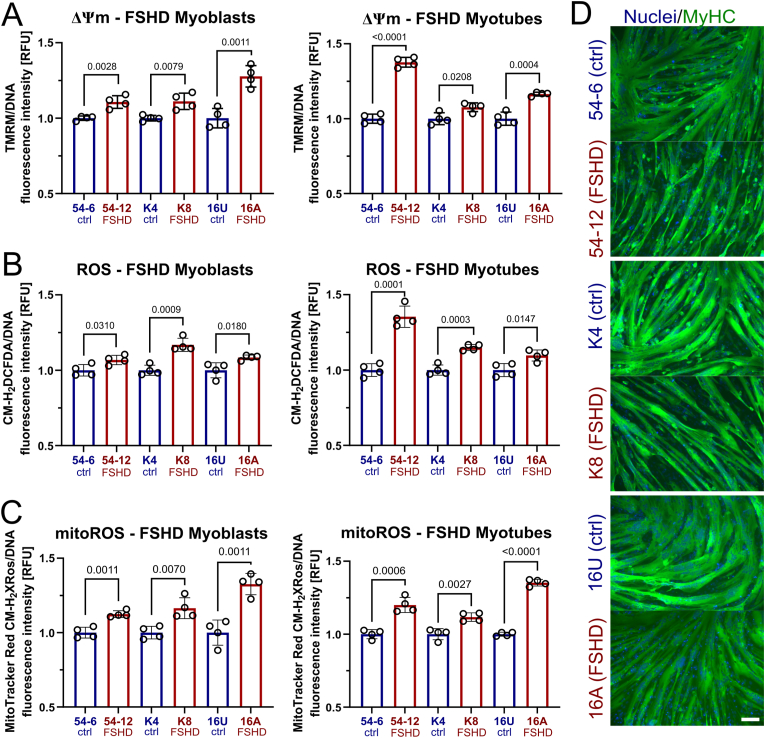
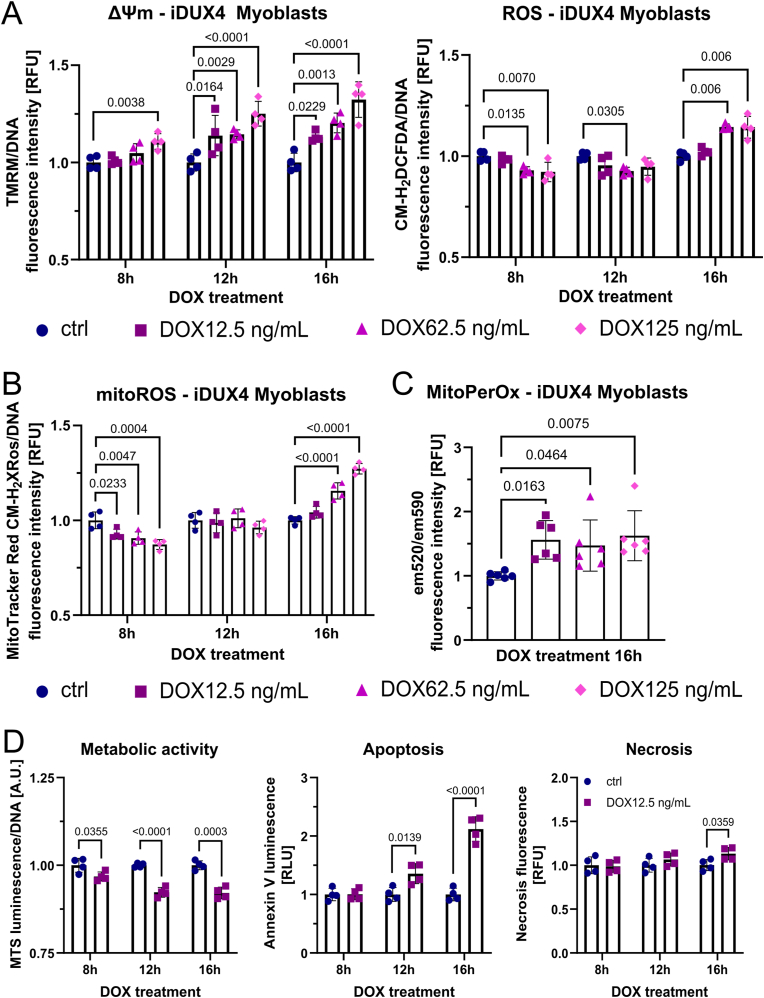
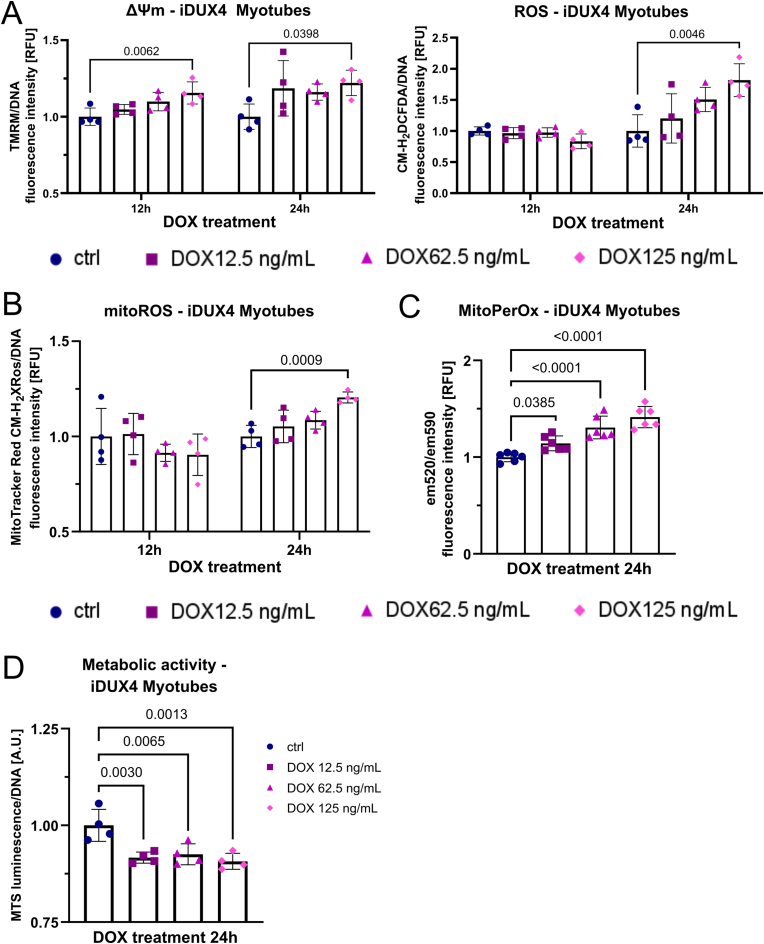
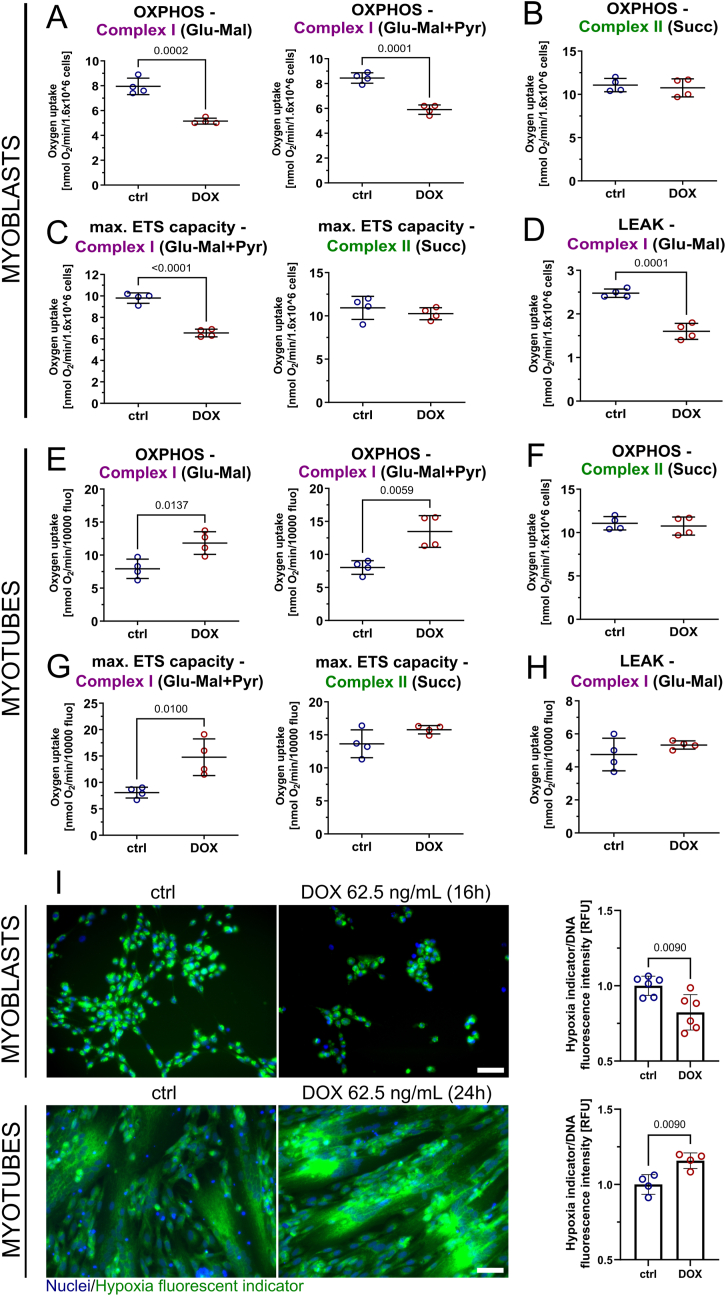
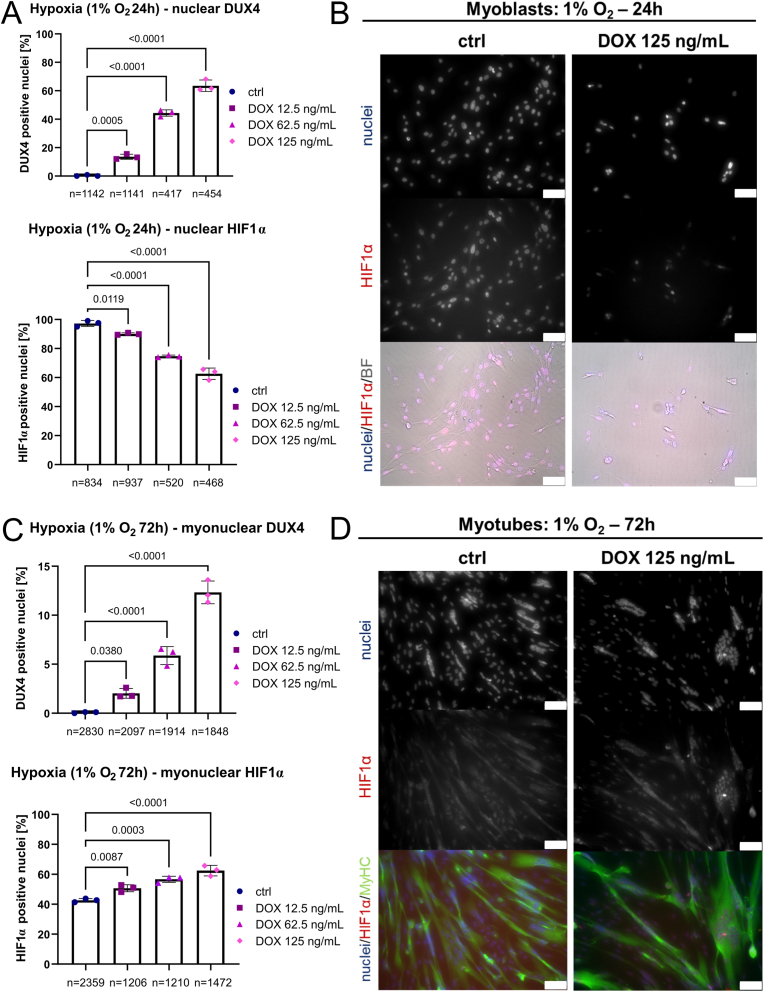
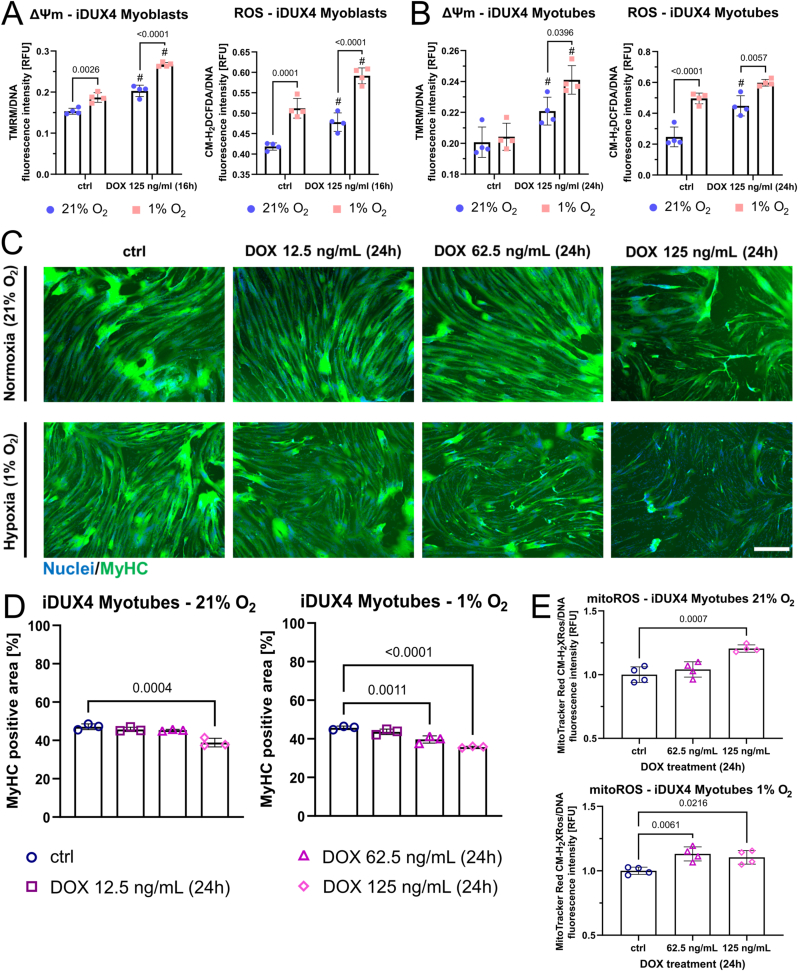
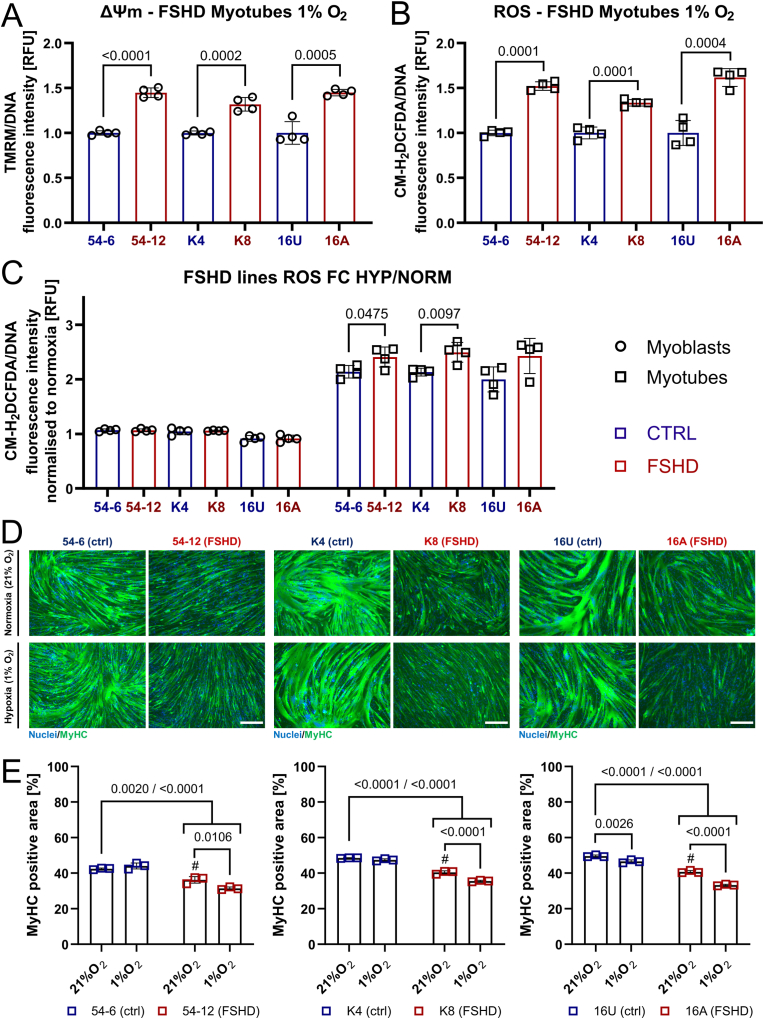
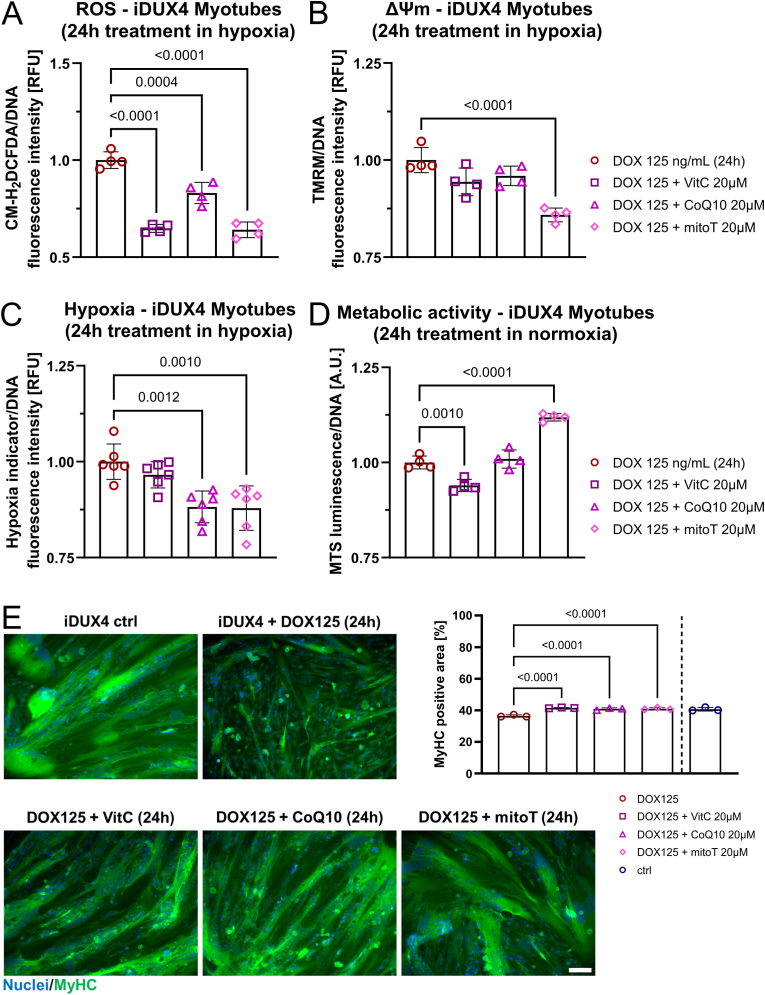
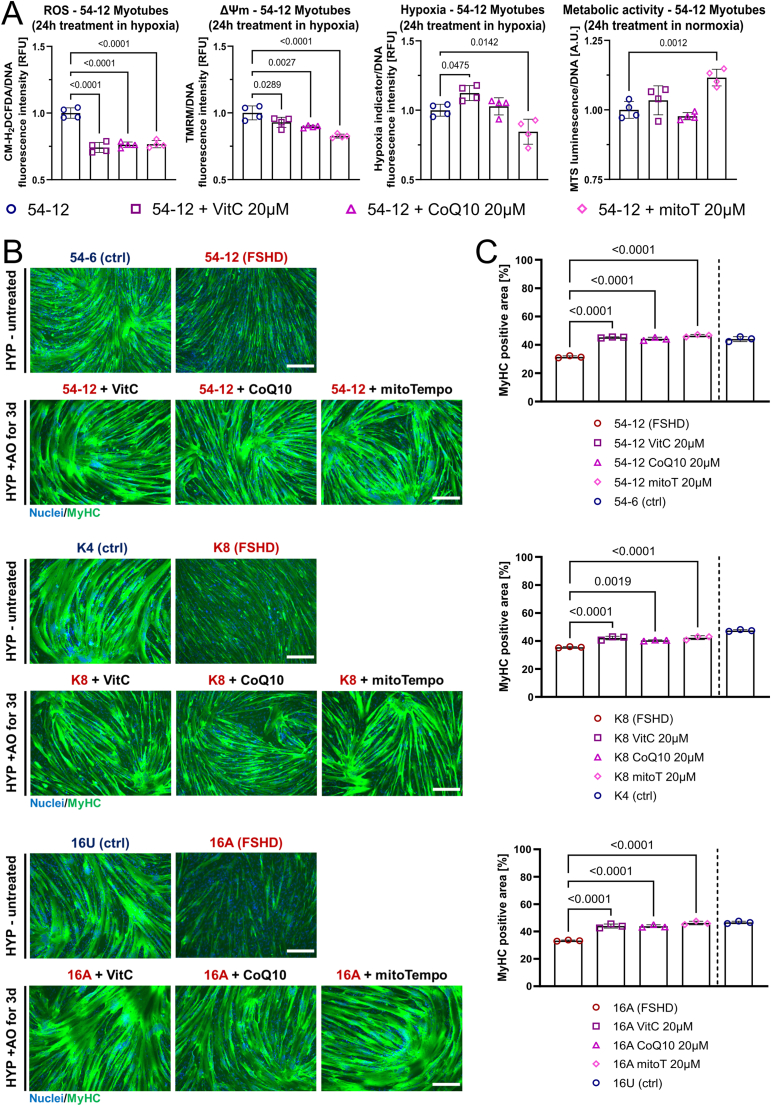
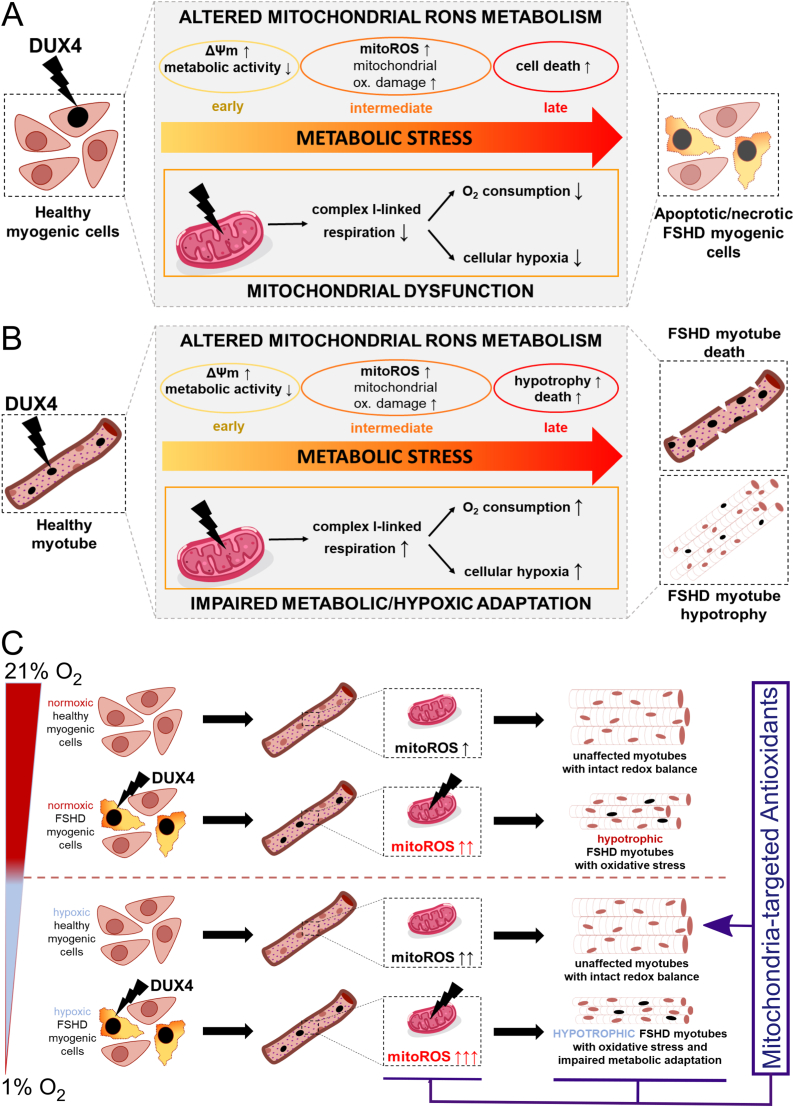
Facioscapulohumeral muscular dystrophy (FSHD) is characterised by descending skeletal muscle weakness and wasting. FSHD is caused by mis-expression of the transcription factor DUX4, which is linked to oxidative stress, a condition especially detrimental to skeletal muscle with its high metabolic activity and energy demands. Oxidative damage characterises FSHD and recent work suggests metabolic dysfunction and perturbed hypoxia signalling as novel pathomechanisms. However, redox biology of FSHD remains poorly understood, and integrating the complex dynamics of DUX4-induced metabolic changes is lacking. Here we pinpoint the kinetic involvement of altered mitochondrial ROS metabolism and impaired mitochondrial function in aetiology of oxidative stress in FSHD. Transcriptomic analysis in FSHD muscle biopsies reveals strong enrichment for pathways involved in mitochondrial complex I assembly, nitrogen metabolism, oxidative stress response and hypoxia signalling. We found elevated mitochondrial ROS (mitoROS) levels correlate with increases in steady-state mitochondrial membrane potential in FSHD myogenic cells. DUX4 triggers mitochondrial membrane polarisation prior to oxidative stress generation and apoptosis through mitoROS, and affects mitochondrial health through lipid peroxidation. We identify complex I as the primary target for DUX4-induced mitochondrial dysfunction, with strong correlation between complex I-linked respiration and cellular oxygenation/hypoxia signalling activity in environmental hypoxia. Thus, FSHD myogenesis is uniquely susceptible to hypoxia-induced oxidative stress as a consequence of metabolic mis-adaptation. Importantly, mitochondria-targeted antioxidants rescue FSHD pathology more effectively than conventional antioxidants, highlighting the central involvement of disturbed mitochondrial ROS metabolism. This work provides a pathomechanistic model by which DUX4-induced changes in oxidative metabolism impair muscle function in FSHD, amplified when metabolic adaptation to varying O2 tension is required.

Keywords: Antioxidants; DUX4; Facioscapulohumeral muscular dystrophy; Hypoxia; Mitochondrial dysfunction; Reactive oxygen species.


Conflict of interest statement

The authors declare that they have no conflicts of interest.

Figures

Image 1
Graphical abstract
Fig. 1
Fig. 1
Transcriptional deregulation of pathways involved in mitochondrial oxidative metabolism, oxidative stress and hypoxia signalling in FSHD muscle biopsies and myoblasts.(A) 7035 genes were differentially expressed, with 3147 down-regulated and 3888 up-regulated in RNASeq data (GSE115650 [62]) from muscle biopsies from 6 FSHD patients with severe pathology (Group 4), compared to 9 control individuals. (B, C) Gene ontology analysis reveals significantly enriched biological processes related to mitochondria, response to oxidative stress and O2 levels and metabolism of nitrogen compounds (highlighted in red), (D) regulated through differential expression of 887 genes in FSHD. (E) Transcriptional downregulation of all protein coding genes encoded by the mitochondrial genome with increasing disease severity (as stratified by relative DUX4 target gene expression of LEUTX, KHDC1L, TRIM43 and PRAMEF2 [62]). (F) Robust correlation of DUX4 target gene expression with decrease in mitochondrial gene expression from low to high disease severity. (G) Transcriptional downregulation of all mitochondrial protein coding genes distinguishes myoblasts derived from an FSHD1 patient (16A) from an unaffected sibling-matched control (16U). (For interpretation of the references to colour in this figure legend, the reader is referred to the Web version of this article.)
Fig. 2
Fig. 2
Altered mitochondrial ROS metabolism in FSHD muscle cells correlates with increased ΔΨm and hypotrophic myotubes.(A) Consistently increased steady-state ΔΨm in mitochondria in 3 independent FSHD myoblast and myotube lines (54-6 ctrl/54-12 FSHD; K4 ctrl/K8 FSHD; 16U ctrl/16A FSHD), as assessed by measuring tetramethylrhodamine methyl ester (TMRM) fluorescence. (B) Increased general (cytoplasmic) ROS (assessed by CM-H2DCFDA fluorescence) and (C) mitoROS levels (assessed by MitoTracker® Red CM-H2XROS fluorescence) were found in the same human cell line pairs. (D) Upon myogenic differentiation, FSHD myotubes exhibit a hypotrophic phenotype compared to their isogenic/sibling control, as shown by immunolabelling for MyHC (green), with a nuclear HOECHST33342 (blue) counterstain (scale bar represents 100 μm). Data is mean ± s.d. from 3 independent cells pairs with 4 wells each from a representative experiment with p values as indicated. (For interpretation of the references to colour in this figure legend, the reader is referred to the Web version of this article.)
Fig. 3
Fig. 3
DUX4-induced mitochondrial dysfunction is an early event in oxidative stress generation through mitochondrial ROS. (A) DUX4 increases ΔΨm in DUX4-inducible LHCN-M2-iDUX (iDUX4) human myoblasts in a dose dependent manner (assessed by TMRM fluorescence), preceding detection of elevated ROS levels (assessed by CM-H2DCFDA fluorescence) by at least 4 h, and (B) subsequently triggers oxidative stress through mitochondrial ROS (assessed by MitoTracker® Red CM-H2XROS fluorescence). (C) The gradual increase in mitoROS subsequently causes mitochondrial oxidative damage through lipid peroxidation after 16 h of DUX4 expression, quantified by calculating the ratio between MitoPerOx fluorescence intensity at em520/em590 after excitation at 488 nm. (D) Changes in metabolic activity (measured using the luminescence RealTime-Glo™ MT Cell Viability assay with normalisation to DNA content) precede apoptosis (measured using RealTime-Glo™ Annexin V Apoptosis and Necrosis assay), the main trigger of DUX4-induced muscle cell death, which commences after 12 h of low DUX4 expression. Data is mean ± s.d. from at least 4 wells each from a representative experiment with p values as indicated.
Fig. 4
Fig. 4
DUX4 expression in myotubes impacts mitochondrial function and subsequently perturbs ROS metabolism. (A) High DUX4 expression increases ΔΨm in iDUX4 myotubes (assessed by measuring TMRM fluorescence), preceding detection of elevated ROS levels (assessed by CM-H2DCFDA fluorescence) by 12 h, and subsequently triggers (B) oxidative stress through mitochondrial ROS (assessed by MitoTracker® Red CM-H2XROS fluorescence). (C) The gradual increase in mitoROS causes mitochondrial oxidative damage after 24 h of DUX4 expression, with mitochondrial lipid peroxidation quantified by calculating the ratio between MitoPerOx fluorescence intensity at em520/em590 after excitation at 488 nm. (D) Similar to changes in myoblasts, DUX4 expression for 24 h in myotubes causes reduction of metabolic activity (measured using the luminescence RealTime-Glo™ MT Cell Viability assay with normalisation to DNA content) as oxidative stress through elevated ROS becomes evident. Data is mean ± s.d. from 4 wells each from a representative experiment with p values as indicated.
Fig. 5
Fig. 5
DUX4 affects mitochondrial respiration specifically at complex I and impairs cellular oxygenation through cellular redistribution of O2. (AD) High-resolution respirometry in DUX4 expressing iDUX4 myoblasts (DOX 62.5 ng/mL for 16 h) identifies reduced OXPHOS, maximum electron transfer system (ETS) capacity and LEAK (uncoupled) respiration through complex I, but not complex II. (EG) Complex I-linked OXPHOS and maximum ETS capacity is increased in DUX4 expressing myotubes (DOX 62.5 ng/mL for 24 h), while complex II is again unaffected. (H) In contrast to myoblasts, DUX4 does not change complex I LEAK respiration in iDUX4 myotubes. Glu: 5 mM glutamate, Mal: 5 mM malate, Pyr: 10 mM pyruvate, Succ: 10 mM succinate/1.4 μM rotenone. (I) Hypoxia indicator fluorescence microscopy using the fluorescent O2-sensitive hypoxia indicator Image-IT™ Green Hypoxia Reagent of DUX4 expressing iDUX4 myoblasts (top panel) and myotubes (bottom panel) grown in hypoxia (1% O2) reveals correlation between complex I-linked respiration and cellular hypoxia, as quantified by indicator dye fluorescence intensity on a plate reader in a separate experiment (representative micrographs are shown, scale bar represents 50 μm). Data is mean ± s.d. from 4 to 6 wells each from a representative experiment (except for respirometry, where 4 independent experiments were performed) with p values as indicated. (For interpretation of the references to colour in this figure legend, the reader is referred to the Web version of this article.)
Fig. 6
Fig. 6
DUX4 interferes with HIF1α signalling activity in environmental hypoxia. (A) Percentage of DUX4-positive and HIF1α-positive nuclei in hypoxic iDUX4 myoblasts under 1% O2 induced to express DUX4 for 24 h at variable levels correlate inversely, with reduced nuclear HIF1α correlating with reduced complex I-linked OXPHOS (see Fig. 5A–D). (B) Representative immunofluorescence microscopy image of iDUX4 myoblasts after DUX4 expression (DOX 125 ng/mL for 24 h) in hypoxia immunolabelled for HIF1α, with a nuclear HOECHST33342 counterstain, alongside non-induced controls (BF: brightfield, scale bar represents 75 μm). (C) Percentage of DUX4-positive myonuclei in hypoxic myotubes under 1% O2 induced to express DUX4 for 24 h at variable amounts correlates with HIF1α nuclear localisation and with increased complex I-linked OXPHOS (see Fig. 5E–G). (D) Representative immunofluorescence microscopy image of iDUX4 myotubes after DUX4 expression (DOX 125 ng/mL for 24 h) in hypoxia (differentiation for 72 h under 1% O2) co-immunolabelled for HIF1α and MyHC, with a nuclear HOECHST33342 counterstain, alongside non-induced controls (scale bar represents 75 μm). Data is mean ± s.d. of number of nuclei/myonuclei stated, from 3 wells from a representative experiment with p values as indicated. (For interpretation of the references to colour in this figure legend, the reader is referred to the Web version of this article.)
Fig. 7
Fig. 7
DUX4-induced mitochondrial dysfunction impairs myogenesis in hypoxia through aggravation of oxidative stress.(A, B) Hypoxia under 1% O2 increases oxidative stress in non DUX4-induced iDUX4 myoblasts and myotubes. DUX4 expression (DOX 125 ng/mL for 24 h) increases ΔΨm (assessed by measuring TMRM fluorescence) and ROS levels (assessed by CM-H2DCFDA fluorescence) regardless of O2 tension (# denotes statistical significance between DUX4 induction at given O2 tension and the respective non-induced control), with ΔΨm and ROS levels even further increasing in hypoxia. (C, D) Titration of the DUX4-inducer DOX (for 24 h at variable amounts) in iDUX4 myotubes demonstrates that lower DUX4 levels are needed to produce a hypotrophic myotube phenotype in hypoxia compared to normoxia, as assessed by quantitation of the MyHC (green) containing area from immunofluorescence micrographs (scale bar represents 500 μm). (E) DUX4 expressing myotubes are characterised by significantly elevated mitochondrial ROS levels (assessed by MitoTracker® Red CM-H2XROS fluorescence) at the minimal DOX concentration needed to elicit a hypotrophic myotube phenotype in hypoxia versus normoxia. Data is mean ± s.d. from 3 to 4 wells each from a representative experiment with p values as indicated. (For interpretation of the references to colour in this figure legend, the reader is referred to the Web version of this article.)
Fig. 8
Fig. 8
FSHD myogenesis is particularly susceptible to hypoxia-induced oxidative stress.(A, B) FSHD patient myotubes (54-6 ctrl/54-12 FSHD; K4 ctrl/K8 FSHD; 16U ctrl/16A FSHD) maintain significantly elevated ΔΨm (assessed by measuring TMRM fluorescence) and ROS levels (assessed by CM-H2DCFDA fluorescence) in hypoxia under 1% O2 compared to isogenic/sibling controls, but differences are more pronounced than in normoxia (compare to Fig. 2A and B). (C) Hypoxia increases ROS levels in FSHD patient myotubes disproportionally compared to controls, which is not observed in FSHD myoblasts (FC HYP/NORM: fold change in hypoxic myoblasts/myotubes compared to their respective normoxic controls). (D) FSHD myotubes differentiated in hypoxia fail to properly adapt metabolism to low O2 availability, resulting in an aggravated hypotrophic phenotype as shown by immunolabelling for MyHC (green), with a nuclear HOECHST33342 counterstain (blue). Hypoxic control myotubes are not affected (scale bar represents 250 μm). (E) Quantitation of MyHC-containing area as readout for myotube hypotrophy from immunofluorescence micrographs (# denotes statistical significance between MyHC-positive area of normoxic FSHD myotubes and their hypoxic controls). Data is mean ± s.d. from 3 to 4 wells each from a representative experiment with p values as indicated. (For interpretation of the references to colour in this figure legend, the reader is referred to the Web version of this article.)
Fig. 9
Fig. 9
Mitochondria-targeted antioxidants more efficiently rescue DUX4-induced metabolic/hypoxic stress than conventional antioxidants.(A) Treatment of hypoxic iDUX4 myotubes (induced with 125 ng/mL DOX for 24 h under 1% O2) with mitochondria-targeted mitoTempo (mitoT) or conventional CoQ10 or VitC antioxidants effectively reduces ROS levels (assessed by CM-H2DCFDA fluorescence) in response to DUX4, (B) but only mitoTempo normalises ΔΨm (assessed by measuring TMRM fluorescence), and (C) reduces hypoxia (measured using Image-IT™ Green Hypoxia Reagent fluorescence). (D) Only mitoTempo restores metabolic activity in normoxic myotubes (induced with 125 ng/mL DOX for 24 h under 21% O2), as measured using the luminescence RealTime-Glo™ MT Cell Viability assay with normalisation to DNA content). (E) mitoTempo phenotypically rescues DUX4 expressing iDUX4 myotubes in hypoxia with similar efficiency as non-targeted CoQ10 and VitC, emphasising central involvement of mitoROS as source of metabolic/hypoxic stress. Representative immunofluorescence micrographs are shown (scale bar represents 100 μm), as is quantitation of the MyHC-containing area (green) for each treatment group. Data is mean ± s.d. from 3 to 6 wells each from a representative experiment with p values as indicated. (For interpretation of the references to colour in this figure legend, the reader is referred to the Web version of this article.)
Fig. 10
Fig. 10
Mitochondria-targeted antioxidants alleviate oxidative stress and rescue aggravated FSHD myotube hypotrophy in hypoxia. (A) mitoTempo (mitoT), CoQ10 and VitC demonstrate comparable efficiency in reducing ROS levels (assessed by CM-H2DCFDA fluorescence) in hypoxic FSHD (54-12) patient myotubes maintained in 1% O2, but mitoTempo shows highest ability to normalise ΔΨm (assessed by measuring TMRM fluorescence) and reduce hypoxia (measured using Image-IT™ Green Hypoxia Reagent fluorescence). Only mitoTempo restores metabolic activity (measured using the luminescence RealTime-Glo™ MT Cell Viability assay with normalisation to DNA content) in normoxic FSHD (54-12) myotubes maintained in 21% O2. (B) mitoTempo treatment phenotypically rescues FSHD myotube hypotrophy in hypoxia in 3 independent patient lines with similar efficiency as non-targeted CoQ10 and VitC. Representative immunofluorescence micrographs are shown of immunolabelling for MyHC (green), with a nuclear HOECHST33342 (blue) counterstain [images of hypoxic controls from Fig. 8, are part of this experiment (scale bar represents 250 μm)]. HYP: hypoxia (1% O2), AO: antioxidant treatment. (C) Quantitation of the MyHC-containing area for each antioxidant treatment group compared to untreated FSHD myotubes (*K8 CoQ10 data from a separate experiment, with given p value to that control). Untreated isogenic/sibling control included for comparison. Data is mean ± s.d. from 3 to 4 wells each from a representative experiment with p values as indicated. (For interpretation of the references to colour in this figure legend, the reader is referred to the Web version of this article.)
Fig. 11
Fig. 11
Mechanisms of metabolic stress generation in FSHD. (A) DUX4 triggers metabolic stress in myoblasts through alterations in mitochondrial ROS metabolism and function. Hyperpolarisation of the mitochondrial membrane is an early event in response to DUX4, followed by mitochondrial oxidative damage through enhanced mitoROS formation from the respiratory chain. Mitochondrial dysfunction is conferred through reduced complex I-linked respiration, affecting hypoxia signalling through redistribution of O2. (B) DUX4 also triggers oxidative damage and altered mitochondrial ROS metabolism driven by high ΔΨm in myotubes, resulting in myotube hypotrophy and apoptosis. Increased O2 consumption via complex I, and enhanced mitoROS formation, both trigger hypoxia in myotubes. (C) DUX4-induced redox changes challenge mitochondrial health and function through altered ROS metabolism, and thus interfere with metabolic adaptation to environmental hypoxia. Enhanced mitoROS formation triggered by DUX4 in normoxic myotubes is further increased in hypoxia, concomitant with aggravation of the hypotrophic myotube phenotype. Notably, FSHD myotubes are particularly sensitive to hypoxia-induced metabolic/oxidative stress, whereas control myotubes adapt their metabolism to prevent oxidative stress through excess mitoROS. Given that mitoROS-induced oxidative stress is a main driver of myotube hypotrophy in hypoxia, mitochondria-targeted antioxidants alleviate FSHD phenotypes more efficiently than conventional non-targeted antioxidants. Thus, affected mitochondria in FSHD are a primary trigger of muscle loss associated with the disease, specifically when metabolic adaptation to varying O2 availability is required. These phenotypes occur in both FSHD patient-derived and iDUX4 human cells.

Similar articles

Cited by

References

    1. Deenen J.C., et al. Population-based incidence and prevalence of facioscapulohumeral dystrophy. Neurology. 2014;83(12):1056–1059. - PMC - PubMed
    1. Sposito R., et al. Facioscapulohumeral muscular dystrophy type 1A in northwestern Tuscany: a molecular genetics-based epidemiological and genotype-phenotype study. Genet. Test. 2005;9(1):30–36. - PubMed
    1. Tawil R., Van Der Maarel S.M. Facioscapulohumeral muscular dystrophy. Muscle Nerve. 2006;34(1):1–15. - PubMed
    1. Banerji C.R.S., Zammit P.S. Pathomechanisms and biomarkers in facioscapulohumeral muscular dystrophy: roles of DUX4 and PAX7. EMBO Mol. Med. 2021;13 - PMC - PubMed
    1. Pandya S., King W.M., Tawil R. Facioscapulohumeral dystrophy. Phys. Ther. 2008;88(1):105–113. - PubMed

Publication types

MeSH terms

LinkOut - more resources