. 2022 May 4;21(5):715-726.
doi: 10.1158/1535-7163.MCT-21-0646.

Therapeutic Targeting of EZH2 and BET BRD4 in Pediatric Rhabdoid Tumors

Affiliations

Therapeutic Targeting of EZH2 and BET BRD4 in Pediatric Rhabdoid Tumors

Yukitomo Ishi et al. Mol Cancer Ther. .

Abstract

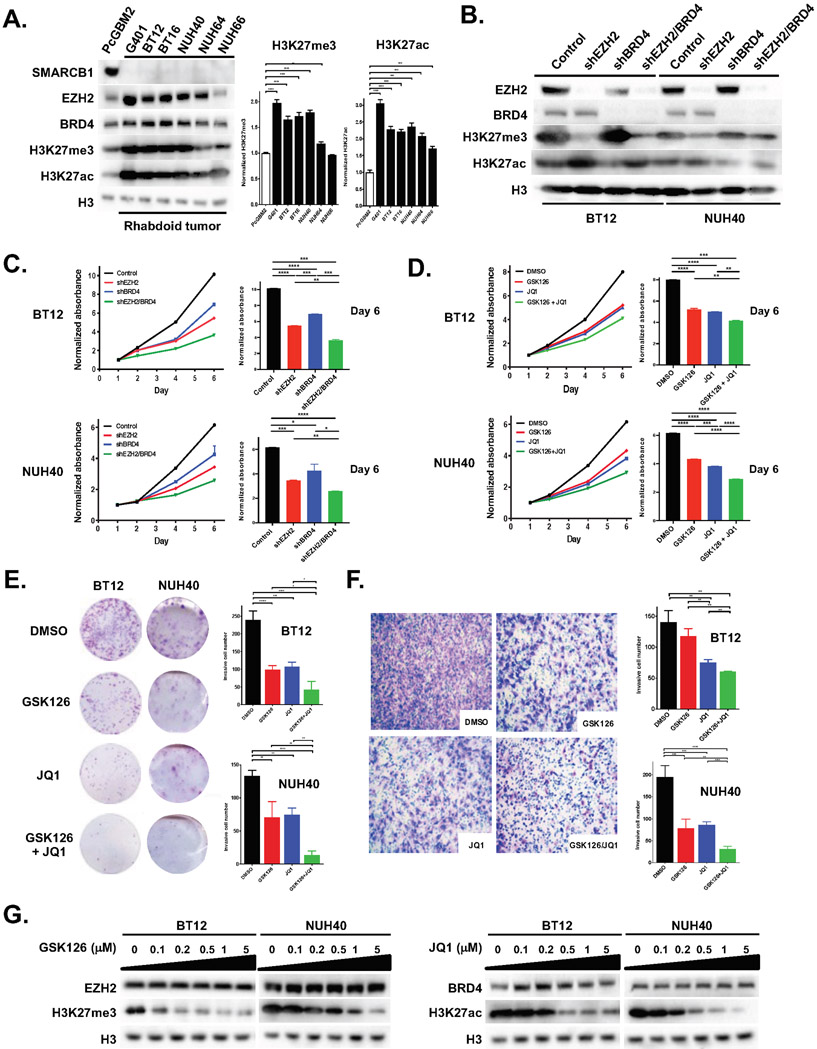
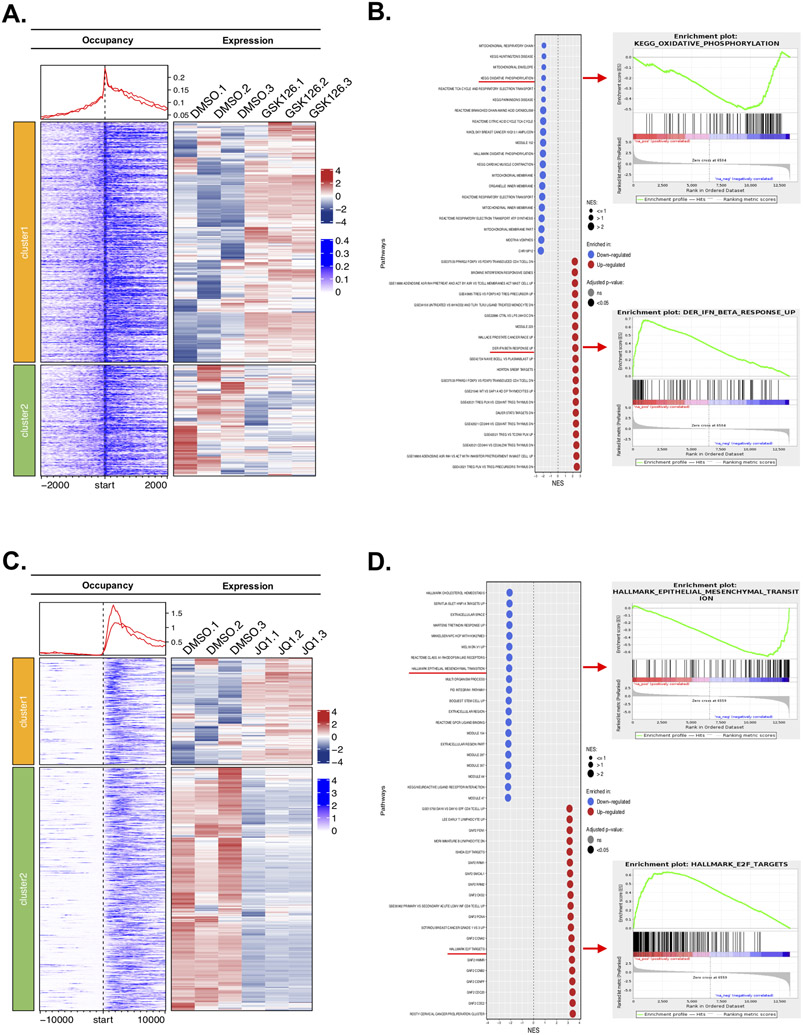
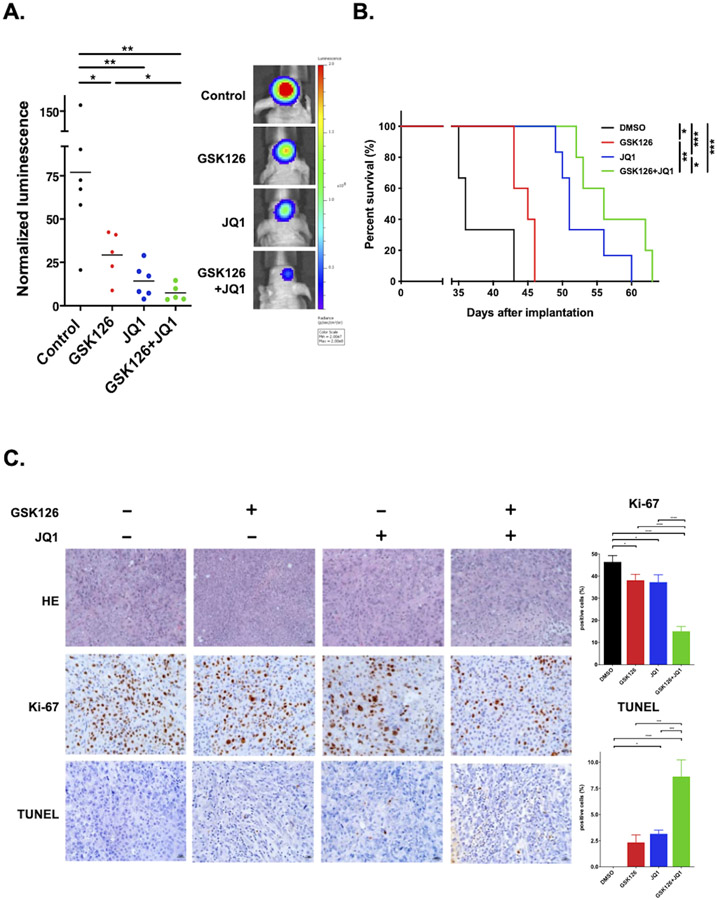
Aberrant activity of the H3K27 modifiers EZH2 and BRD4 is an important oncogenic driver for atypical teratoid/rhabdoid tumor (AT/RT), and each is potentially a possible therapeutic target for treating AT/RT. We, therefore, determined whether targeting distinct histone modifier activities was an effective approach for treating AT/RT. The effects of EZH2 and BRD4 inhibition on histone modification, cell proliferation, and cell invasion were analyzed by immunoblotting, MTS assay, colony formation assay, and cell invasion assay. RNA- and chromatin immunoprecipitation-sequencing were used to determine transcriptional and epigenetic changes in AT/RT cells treated with EZH2 and BRD4 inhibitors. We treated mice bearing human AT/RT xenografts with EZH2 and BRD4 inhibitors. Intracranial tumor growth was monitored by bioluminescence imaging, and the therapeutic response was evaluated by animal survival. AT/RT cells showed elevated levels of H3K27 trimethylation (H3K27me3) and H3K27 acetylation (H3K27ac), with expression of EZH2 and BRD4, and lack of SMARCB1 proteins. Targeted inhibition of EZH2 and BRD4 activities reduced cell proliferation and invasiveness of AT/RT in association with decreasing H3K27me3 and H3K27ac. Differential genomic occupancy of H3K27me3 and H3K27ac regulated specific gene expression in response to EZH2 and BRD4 inhibitions. A combination of EZH2 and BRD4 inhibition increased the therapeutic benefit in vitro and in vivo, outperforming either monotherapy. Overall, histones H3K27me3 and H3K27ac were elevated in AT/RT cells and distributed in distinct chromatin regions to regulate specific gene expression and to promote AT/RT growth. Targeting EZH2 and BRD4 activity is, therefore, a potential combination therapy for AT/RT.


Conflict of interest statement

CONFLICT OF INTEREST

The authors have declared that no conflict of interest exists.

Figures

Figure 1.
Figure 1.. Genetic and pharmacological inhibition of EZH2 and BRD4 activity reduced proliferation and invasiveness in DIPG cells.
(A) Western blotting results showing expression of EZH2, BRD4, H3K27 trimethylation (H3K27me3), H3K27acetylation (H3K27ac) and total Histone H3 (H3) and a lack of SMARCB1 in rhabdoid tumor cells (G401) and AT/RT cells (BT12, BT16, NUH40, NUH60, NUH66). PcGBM cells was used a positive control of SMARCB1 expression. (B) Western blotting results showing shRNA-mediated depletion of EZH2 and BRD4 expression in BT12 and NUH40 cells. (C) Cell growth plot (left) showing anti-proliferative effects of shRNA-mediated depletion of EZH2 and BRD4 in BT12 and NUH40 cells. The plot represents the normalized metabolic activity by absorbance measured on day 1. Values shown are the average (mean ± SD) from duplicate or triplicate samples for each condition. Bar graph (right) represents the normalized metabolic activity on day 6. Unpaired t-test values for comparisons between each condition. BT12: **** indicates P < 0.0001, ***P = 0.0001 for control vs. shEZH2/BRD4, ***P = 0.0003 for shEZH2 vs. shBRD4, **P = 0.0013 for shEZH2 vs. shEZH2/BRD4, ***P = 0.0004 for shBRD4 vs. shEZH2/BRD4. NUH40: **** indicates P < 0.0001***P = 0.0001 for control vs. shEZH2, *P = 0.0381 for control vs. shBRD4, **P = 0.0016 for shEZH2 vs. shEZH2/BRD4, *P = 0.0482 for shBRD4 vs. shEZH2/BRD4. (D) Cell growth plot showing anti-proliferative effects of GSK126 (6 μM) and JQ1 (0.3 μM) treatment in BT12 and NUH40 cells at each time point. The plot represents the normalized metabolic activity by absorbance measured on day 1. Values shown are the average (mean ± SD) from duplicate or triplicate samples for each condition. Bar graph (right) represents the normalized metabolic activity on day 6. Unpaired t-test values for comparisons between each treatment group. BT12: **** indicates P < 0.0001, ***P = 0.0005 for DMSO vs GSK126, ***P = 0.0002 for DMSO vs GSK126 + JQ1, **P = 0.0051 for GSK126 vs GSK126 + JQ1, **P = 0.0033 for JQ1 vs GSK126 + JQ1. NUH40: **** indicates P < 0.0001; DMSO vs JQ1, ****P < 0.0001; ****P < 0.0001 for DMSO vs GSK126 + JQ1; ***P = 0.0003 for GSK126 vs. JQ1. (E) Left, colony forming effect on BT12 and NUH40 cells treated with DMSO control, GSK-126, JQ1, and GSK-126 + JQ1. Right, bar graph representation of colony numbers in BT12 and NUH40 cells treated with DMSO or IC50 values of GSK-126, JQ1, and GSK-126 + JQ1. Values shown are the average (mean ± SD) from triplicate samples for each condition. Unpaired t-test values for comparisons between each treatment group. BT12: DMSO vs GSK126, **P = 0.0010; DMSO vs JQ1, **P = 0.0014; DMSO vs GSK126 + JQ1, ***P = 0.0006; GSK126 vs GSK126 + JQ1, *P = 0.0207; JQ1 vs GSK126 + JQ1, *P = 0.0138. NUH40: DMSO vs GSK126, *P = 0.0128; DMSO vs JQ1, **P = 0.0016; DMSO vs GSK126 + JQ1, ****P < 0.0001; GSK126 vs GSK126 + JQ1, *P = 0.0163; JQ1 vs GSK126 + JQ1, ***P = 0.0008. (F) Left, cell invasion assay presenting reduced invasion under the combined treatment with DMSO control, GSK126, JQ1, and GSK-126 + JQ1 in BT12 cells. Right, bar graph representation of invasive cell number in BT12 and NUH40 cells treated with DMSO, GSK126 and JQ1, alone and in combination. Unpaired t-test values for comparisons between each treatment group. BT12: DMSO vs JQ1, **P = 0.0046; DMSO vs GSK126 + JQ1, **P = 0.0019; GSK126 vs GSK126 + JQ1, **P = 0.0014; JQ1 vs GSK126 + JQ1, **P = 0.0075. NUH40: DMSO vs GSK126, ***P = 0.0004; DMSO vs JQ1, ***P = 0.0002; DMSO vs GSK126 + JQ1, ****P < 0.0001; GSK126 vs GSK126 + JQ1, **P = 0.0044; JQ1 vs GSK126 + JQ1, ****P < 0.0001. (G) Western blot showing dose-dependent reduction of H3K27me3 by GSK-126 treatment (left) and H3K27ac by JQ1 treatment (right) in BT12 and NUH40 cells.
Figure 2.
Figure 2.. EZH2 and BRD4 inhibition altered genome-wide H3K27me3 and K27ac occupancy and transcription in AT/RT cells.
(A) Right panel: Heatmaps generated from RNA-seq showing differentially expressed genes in the BT12 AT/RT cells treated with DMSO vs. 6 μM GSK-126 for 96 hours. Left panel: Corresponding H3K27me3 binding peaks linking to the nearest gene in the untreated cells. The numbers of the X-axis are the base-pair distance to transcription start sites (TSS). The start means TSS. The red curves above the binding signal represent the aggregated occupancy intensity of the differential genes centered at TSS. Two clusters, cluster 1 (orange) and cluster 2 (green), of corresponding gene expression at the H3K27me3 binding sites generated from RNA-seq. (B) GSEA pathway analysis in GSK126 treated BT12 cells. Dot plot (left) showing top 20 pathways with upregulated and downregulated upon GSK126 treatment in BT12. GSEA (right) showing oxidative phosphorylation pathway (arrow) and interferon beta pathway (lower arrow) as the most down-regulated (upper) or up-regulated pathways (lower), respectively. (C) Right panel: Heatmaps generated from RNA-seq showing differentially expressed genes in the BT12 AT/RT cells treated with DMSO vs. 0.3 μM JQ1 for 24 hours. Left panel: Corresponding H3K27ac binding peaks linking to the nearest gene in the untreated cells. The numbers of the X-axis are the base-pair distance to TSS. The start means TSS. The red curves above the binding signal represent the aggregated occupancy intensity of the differential genes centered at TSS. Two clusters, cluster 1 (orange) and cluster 2 (green), of corresponding gene expression at the H3K27ac binding sites generated from RNA-seq. (D) GSEA pathway analysis in JQ1 treated BT12 cells. Dot plot (left) showing top 20 pathways with upregulated and downregulated upon JQ1 treatment in BT12. GSEA (right) showing EMT pathway (arrow) and E2F targets pathway (arrow) as the most down-regulated (upper) and up-regulated (lower) pathways, respectively.
Figure 3.
Figure 3.. Combination of EZH2 and BRD4 inhibition altered AT/RT transcription.
(A) Heatmap generated from RNA-seq data, showing expression changes in BT12 AT/RT cells treated with 6 μM GSK-126 for 96 h and 0.3 μM JQ1 for 24 h or DMSO. Five clusters of corresponding gene expression from RNA-seq are shown to the right. (B) GO enrichment analysis of cluster 2 (top) and cluster 4 genes (bottom). (C) Cytoscape plot showing the relationship the pathways associated with gene cluster 2 (encircled by green) and cluster 4 (encircled by purple). DDR: DNA damage response. (D) Violin plots to compare the expression of the two gene signatures across conditions (left: tissue development and differentiation; right: cell cycle and DNA damage response). Unpaired t-test values for comparisons each treatment. Tissue development and differentiation: **** indicates P < 0.0001, *P = 0.023 for DMSO (red) vs 6 μM GSK126 (green), P = 0.17 for DMSO vs 0.3 μM JQ1 (purple), ***P = 0.0006 for GSK126 vs JQ1. Cell cycle and DNA damage response: **** indicates P < 0.0001.
Figure 4.
Figure 4.. Treatment of EZH2 and BRD4 inhibitors showed anti-tumor activity in intracranial AT/RT xenograft animal models.
Mice with BT12 intracranial tumors were either treated with vehicle (DMSO, n = 6), GSK126 (100 mg/kg for 21 consecutive days, n = 5), JQ1 (25mg/kg for 21 consecutive days, n = 6), GSK126 + JQ1 (same dose of monotherapy for 21 consecutive days, n = 5). (A) Left: Dot plot representation of tumor bioluminescence values in mice at day 29 post-tumor cell injection. Horizontal bars indicate the mean value for each treatment group. Unpaired t-test values for comparisons between treatments: DMSO vs. GSK126, *P = 0.0452; DMSO vs. JQ1, **P = 0.0065; DMSO vs. GSK126 + JQ1, **P = 0.0067; GSK126 vs. GSK126 + JQ1, *P = 0.0105. Right: Tumor bioluminescence overlay images showing relative bioluminescence intensities. (B) Corresponding survival plots for each experiment. Statistical analysis was performed using a log-rank test: DMSO vs. GSK126, *P = 0.0112; DMSO vs. JQ1, ***P = 0.0007; DMSO vs. GSK126 + JQ1, **P = 0.0018; GSK126 vs. JQ1, **P = 0.0011; GSK126 vs. GSK126 + JQ1, **P = 0.0025; JQ1 vs. GSK126 + JQ1, *P = 0.0476. (C) Left: Images of representative hematoxylin and eosin (HE), Ki-67, and TUNEL staining for intracranial tumor from mice euthanized at the end of treatment. Right: Mean and SD values representing the average number of positive cells in four high-powered fields in each tumor. One-way ANOVA for comparisons between treatments. **** indicates P < 0.0001, *P = 0.0261 for Ki-67: DMSO vs. GSK126, *P = 0.0155 for DMSO vs. JQ1. TUNEL: **** indicates P < 0.0001, *P = 0.0107 for DMSO vs. JQ1, ***P = 0.0001 for GSK126 vs. GSK126 + JQ1, ***P = 0.0003 for JQ1 vs. GSK126 + JQ1.

Similar articles

Cited by

References

    1. Nemes K, Frühwald MC. Emerging therapeutic targets for the treatment of malignant rhabdoid tumors. Expert Opin Ther Targets. 2018;22(4):365–379. - PubMed
    1. Hoffman LM, Richardson EA, Ho B, Margol A, Reddy A, Lafay-Cousin L, et al. Advancing biology-based therapeutic approaches for atypical teratoid rhabdoid tumors. Neuro Oncol. 2020;22(7):944–954. - PMC - PubMed
    1. Park M, Han JW, Hahn SM, Lee JA, Kim JY, Shin SH, et al. Atypical teratoid/rhabdoid tumor of the central nervous system in children under the age of 3 years. Cancer Res Treat. 2021;53(2):378–388. - PMC - PubMed
    1. Versteege I, Sevenet N, Lange J, Rousseau-Merck MF, Ambros P, Aurias A, et al. Truncating mutations of hSNF5/INI1 in aggressive paediatric cancer. Nature. 1998;394:203–206. - PubMed
    1. Biegel JA, Zhou JY, Rorke LB, Stenstrom C, Wainwright LM, Fogelgren B. Germ-line and acquired mutations of INI1 in atypical teratoid and rhabdoid tumors. Cancer Res. 1999;59:74–79. - PubMed

Publication types