. 2022 Aug;29(8):1513-1527.
doi: 10.1038/s41418-022-00939-8. Epub 2022 Feb 1.

EBV infection-induced GPX4 promotes chemoresistance and tumor progression in nasopharyngeal carcinoma

Affiliations

EBV infection-induced GPX4 promotes chemoresistance and tumor progression in nasopharyngeal carcinoma

Li Yuan et al. Cell Death Differ. 2022 Aug.

Abstract

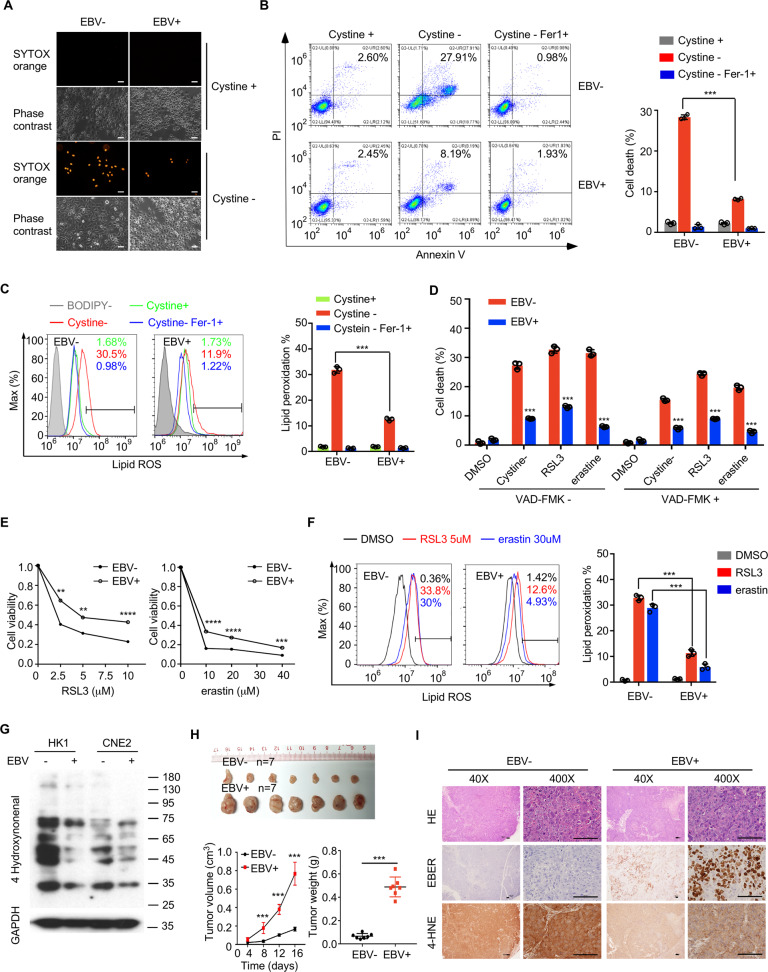
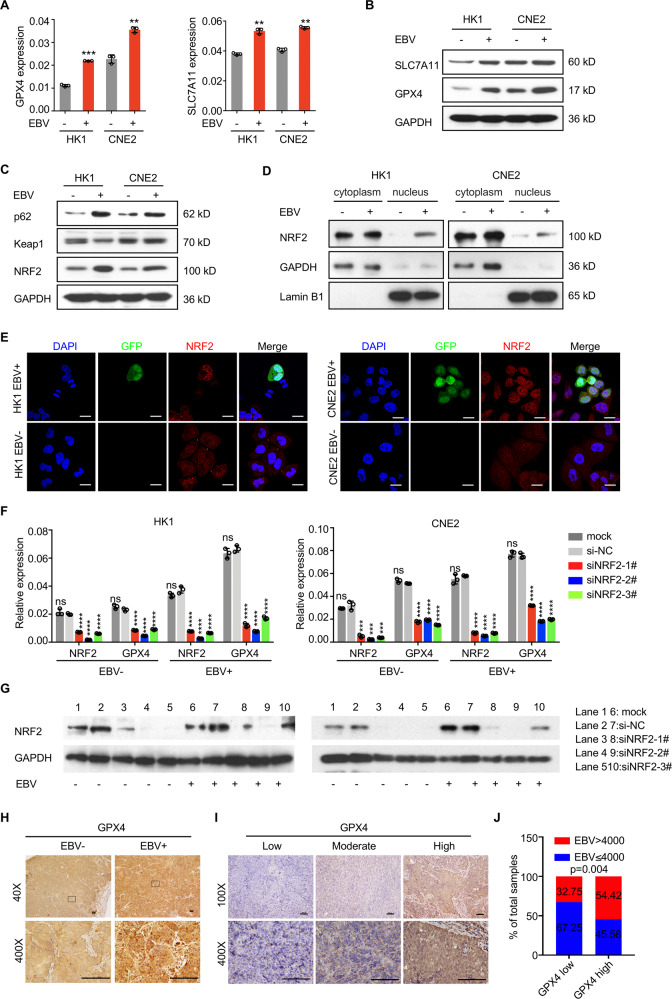
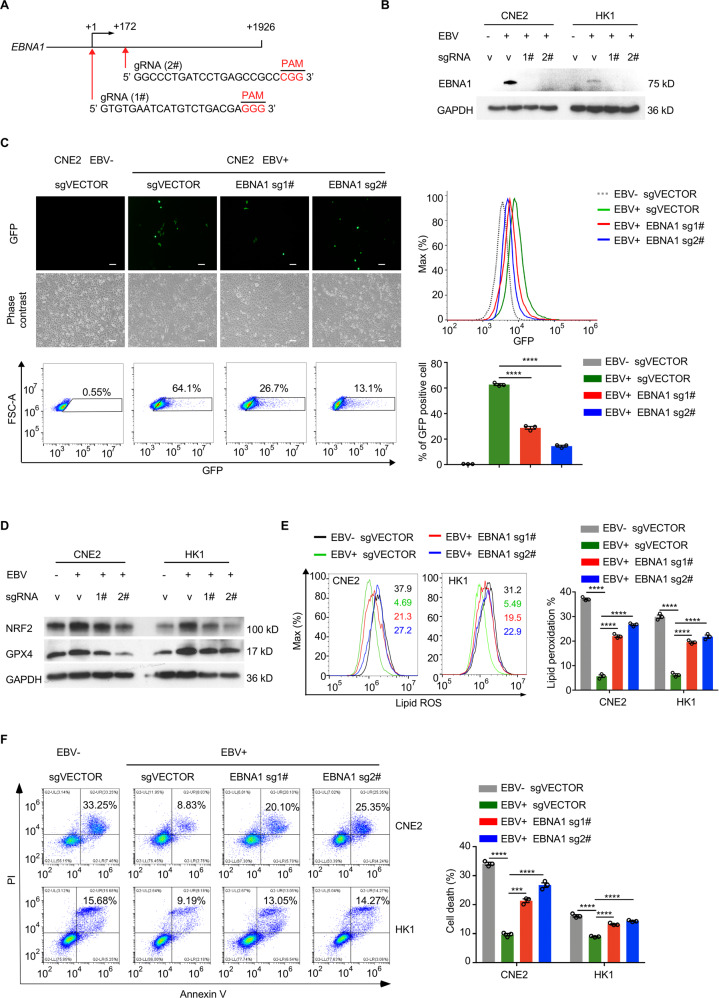
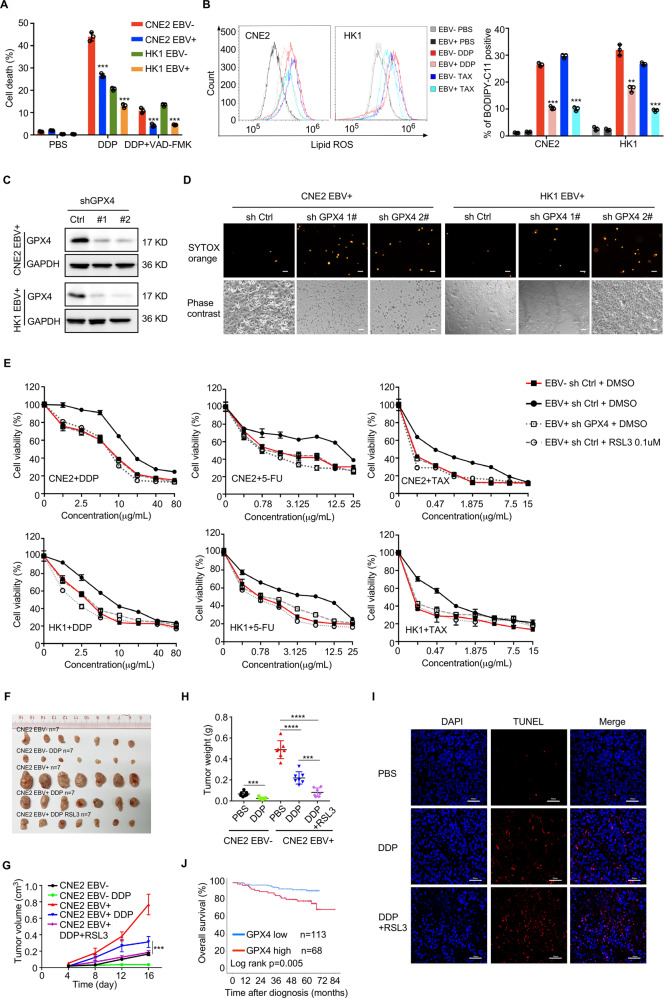
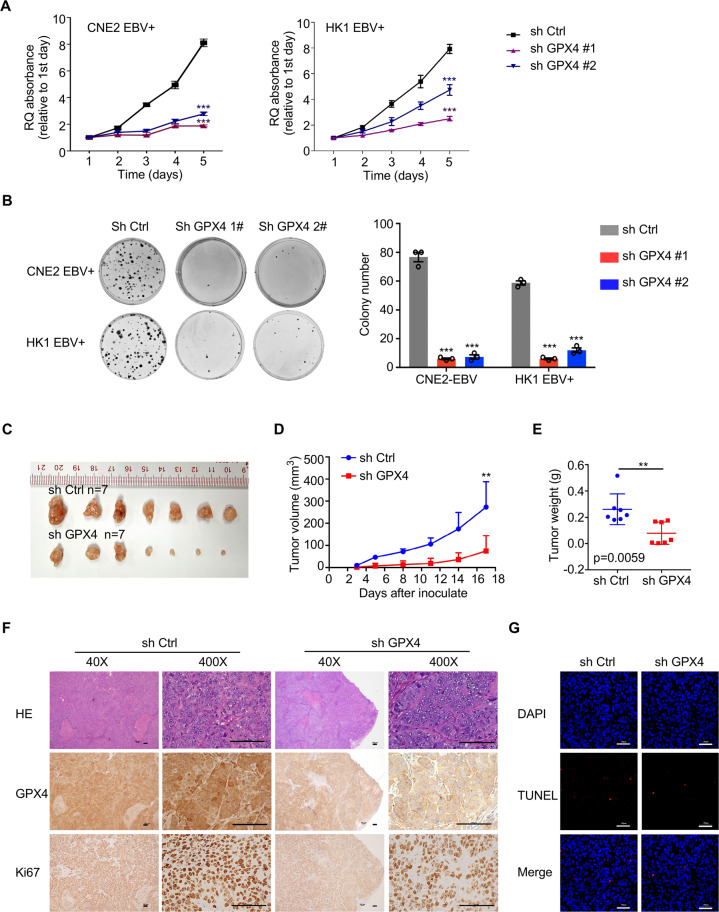
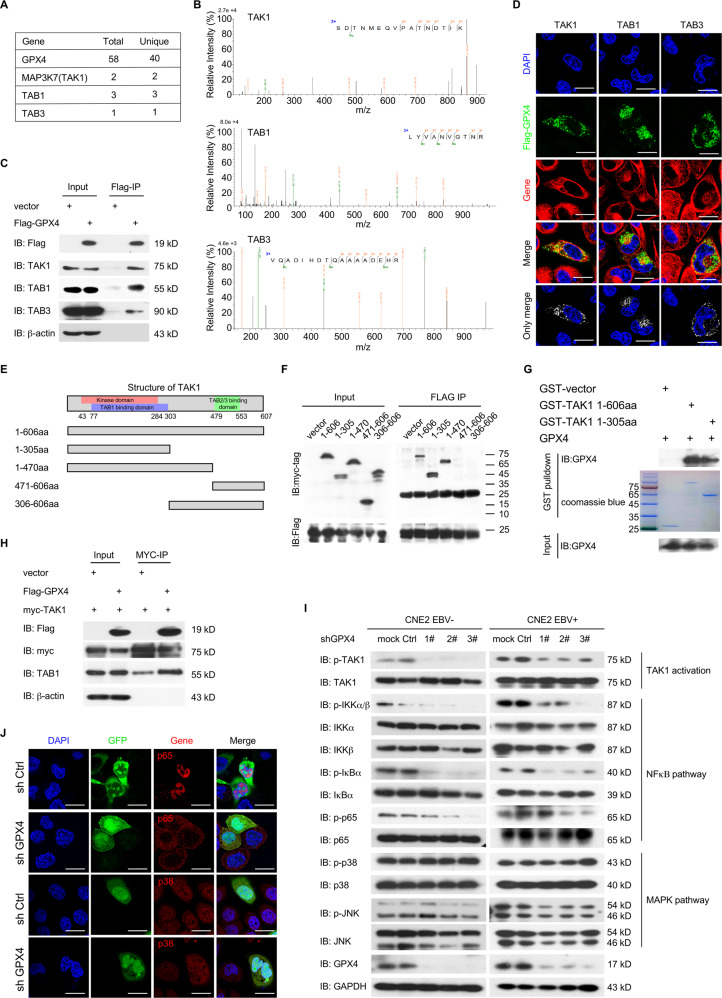
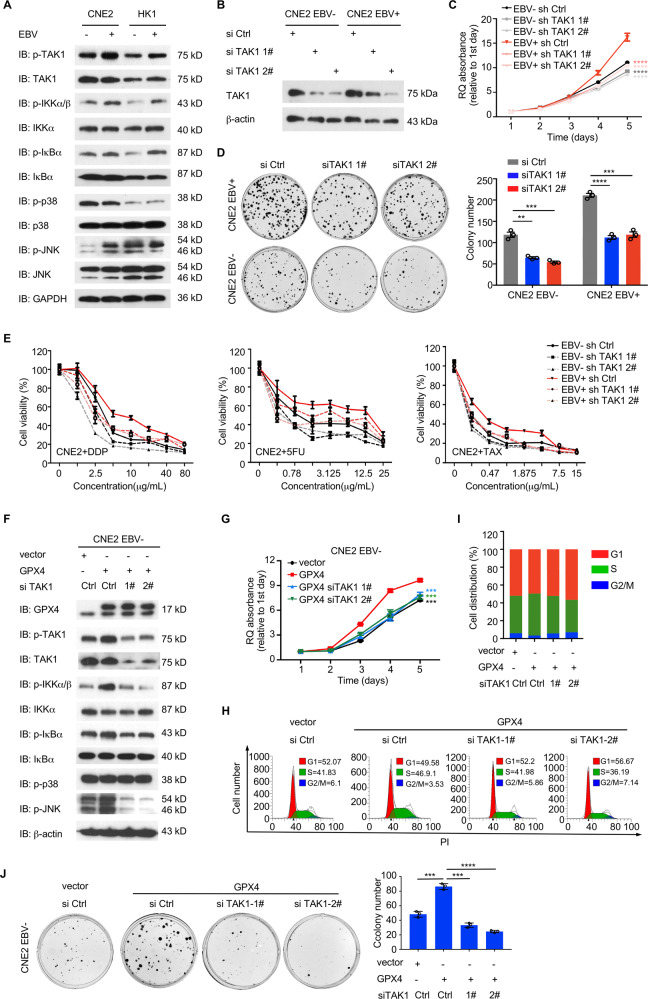
Epstein-Barr virus (EBV) was the first oncogenic virus identified in humans. It is primarily associated with multiple lymphoid and epithelial cancers, including nasopharyngeal carcinoma (NPC). However, its association with ferroptosis and its role in cancer therapy resistance have not been fully elucidated. Here, we show that EBV infection reduces the sensitivity of NPC cells to ferroptosis by activating the p62-Keap1-NRF2 signaling pathway in conjunction with upregulation of SLC7A11 and GPX4 expression. Knockdown of endogenous GPX4 or blockade of GPX4 using a specific inhibitor enhanced the chemosensitivity of EBV-infected NPC cells. Functional studies revealed that GPX4 knockdown suppresses the proliferation and colony formation of NPC cells. Mechanistically, GPX4 interacts with the TAK1-TAB1/TAB3 complex, regulates TAK1 kinase activity, and further activates downstream MAPK-JNK and NFκB pathways. High GPX4 expression is correlated with poor clinical outcomes in patients with NPC and other cancer types. Taken together, our findings suggest that EBV infection has important effects on redox homeostasis, revealing a previously unappreciated role for GPX4 in tumor progression. This novel mechanism provides a potential new target for the treatment of EBV-related tumors.


Conflict of interest statement

The authors declare no competing interests.

Figures

Fig. 1
Fig. 1. EBV infection inhibits ferroptosis in NPC cells.
CNE2 EBV-negative or CNE2 EBV-positive cells were seeded into six-well plates. Cells were cultured for 24 h and then subjected to cystine starvation for 30 h. Cell death was assessed using SYTOX Orange staining (A) or PI-Annexin V double staining followed by flow cytometry analysis (B) (n = 3). C Twenty-four hours after cystine starvation and 2 μM ferrostatin-1 (Fer-1) treatment, lipid reactive oxygen species (ROS) production was determined by C11-BODIPY staining followed by flow cytometry (n = 3). D Cell death of EBV-negative or EBV-positive CNE2 cells after treatment with cystine starvation, RSL3, erastin or DMSO (control) for 30 h with or without the caspase inhibitor z-VAD-FAK (n = 3). E. Cell viability of CNE2 EBV-negative or CNE2 EBV-positive cells was determined after treatment with different concentrations of RSL3 or erastin for 30 h by CCK-8 assay (n = 4). F. Lipid ROS production in CNE2 EBV-negative or -positive cells was determined after treatment with RSL3, erastin or DMSO (control) for 24 h (n = 3). G Representative western blots of 4-hydroxynonenal in EBV-negative and EBV-positive cells. GAPDH was used as a loading control. H Subcutaneous tumors formed by CNE2 EBV-negative or CNE2 EBV-positive cells in nude mice were excised 17 days after inoculation. Tumor growth was assessed by volume changes over time and weight at the endpoint (n = 7). I Representative images of immunohistochemistry staining showing high levels of 4-hydroxynonena in CNE2 EBV-negative xenografts. Data are shown as the mean ± SD. **p < 0.01; ***p < 0.001; ****p < 0.0001. BF, two-tailed unpaired t test. H two-tailed Mann–Whitney test. A and I scale bars: 100 µm.
Fig. 2
Fig. 2. EBV infection activates the p62-Keap1-NRF2 signaling pathway and induces high GPX4 expression in NPC cells.
mRNA and protein expression levels of GPX4 and SLC7A11 in EBV-negative and EBV-positive NPC cells were determined by RT–qPCR (A) (n = 3) and immunoblotting (B) (n = 3). C The p62-Keap1-NRF2 pathway was examined in EBV-negative and EBV-positive NPC cells by immunoblotting. D Cytoplasmic and nuclear proteins from EBV-negative and EBV-positive NPC cells were fractionated and detected by immunoblotting. Lamin B1 and GAPDH were used as controls for the nuclear and cytoplasmic fractions, respectively. E Immunofluorescence staining showing the localization of NRF2 in EBV-negative and EBV-positive NPC cells. mRNA and protein levels of NRF2 and GPX4 in EBV-negative and EBV-positive NPC cells were determined by RT–qPCR (F) (n = 3) and immunoblotting (G) (n = 3) after siRNA knockdown of endogenous NRF2. H GPX4 was highly expressed in CNE2 EBV + xenografts. I Representative images of immunohistochemistry staining showing GPX4 expression in paraffin-embedded tumor sections from NPC patients. J GPX4 expression in different groups according to EBV copy number in 181 NPC patients. Data are shown as the mean ± SD. **p < 0.01; ***p < 0.001; ****p < 0.0001; ns, not significant. A, F Two-tailed unpaired t test (F, compared to si-NC). J two-tailed Mann–Whitney test. Scale bars: 20 µm (E) and 100 µm (H, I).
Fig. 3
Fig. 3. Clearance of EBV genomes enhances the sensitivity of NPC cells to ferroptosis.
A. Two gRNA sequences targeting the EBNA1 gene of EBV. B EBNA1 protein expression was examined in EBV-positive NPC cells transduced with control or EBNA1-targeting gRNAs. C CNE2 cells carrying recombinant EBV-GFP virions were transduced with control or EBNA1-targeting gRNAs and assayed for GFP expression by fluorescence microscopy and flow cytometry (n = 3). D NRF2 and GPX4 signaling in CRISPR/Cas9-mediated EBV-negative and CRISPR/Cas9-positive NPC cells was examined by immunoblotting. E Twenty-four hours after 5 µM RSL3 treatment, lipid ROS production was determined by C11-BODIPY staining and flow cytometry (n = 3). F Cell death of CNE2 sgVector, CNE2-EBV sgEBNA1 or HK1 sgVector, HK1-EBV sgEBNA1 was measured and quantified after 5 µM RSL3 treatment for 24 h by flow cytometry (n = 3). Data are shown as the mean ± SD. ***p < 0.001; ****p < 0.0001. C, E, and F, two-tailed unpaired t test. C, scale bar, 100 µm.
Fig. 4
Fig. 4. High GPX4 expression promotes chemotherapy resistance in NPC cells and is correlated with poor survival in NPC patients.
A. Cell death of EBV-negative and EBV-positive NPC cells was determined by flow cytometry after treatment with cisplatin (DPP) with or without the caspase inhibitor VAD-FAK or PBS (control) (n = 3). B Lipid ROS production in the indicated cells was determined by flow cytometry after treatment with DDP, paclitaxel (TAX), or PBS (control) (n = 3). C Representative immunoblots of GPX4 in EBV-positive CNE2 and HK1 cells with stable knockdown of endogenous GPX4. D Thirty hours after cystine starvation, cell death was assessed by SYTOX Orange staining. E Dose–response curve for DPP, 5-fluorouracil (5-FU), and TAX treatment with or without the GPX4 inhibitor RSL3 for 48 h in the indicated cells (n = 4). F. Subcutaneous tumors formed by EBV-negative and EBV-positive CNE2 cells in nude mice were excised 17 days after inoculation. DDP (4 mg/kg) or RSL3 (10 mg/kg) was administered 4 days post inoculation. G, H. Growth curve and weight of xenograft tumors (n = 7). I TUNEL staining (red signal) assessing cell death in xenograft tumors. Scale bar, 50 µm. J Kaplan–Meier analysis of overall survival (OS) based on GPX4 expression in 181 NPC patients. Data are shown as the mean ± SD. **p < 0.01; ***p < 0.001. A and B, two-tailed unpaired t test. H two-tailed Mann–Whitney test. D scale bar: 100 µm.
Fig. 5
Fig. 5. GPX4 promotes cancer cell proliferation and tumorigenicity in vitro and in vivo.
A CCK-8 assay of EBV-positive CNE2 (left) and HK1 (right) GPX4 knockdown cells. B Colony formation by the indicated cells (n = 3). C–E. Subcutaneous tumors formed by EBV-positive control and shGPX4 CNE2 cells in nude mice were excised 17 days after inoculation. Tumor growth was assessed by assessing volume changes over time (D) and weight at the endpoint (E) (n = 7). F Expression of GPX4 and Ki67 in the xenografts was examined by immunohistochemistry staining. G Cell death in the xenograft tumors was assessed by TUNEL staining (red). Data are shown as the mean ± SD. **p < 0.01; ***p < 0.001. A and B two-tailed unpaired t test. D and E two-tailed Mann–Whitney test. F and G scale bars: 100 µm (F) and 50 µm (G).
Fig. 6
Fig. 6. GPX4 physically interacts with the TAK1-TAB complex.
A A partial list of interacting proteins identified by mass spectrometry using cells stably expressing GPX4. The unique and total peptide numbers for the indicated proteins are shown. B Representative peptides of TAK1, TAB1, and TAB3. C 293 T cells transfected with empty vector control or Flag-GPX4 for 48 h were subjected to the co-IP assay. D Representative immunofluorescence images showing the colocalization of GPX4 and the indicated genes in CNE2 cells. E Schematic diagram showing the structure of the TAK1 protein and the designs of different truncations for domain mapping. F 293 T cells transfected with Flag-GPX4 and full-length or truncated myc-TAK1 for 48 h were subjected to a co-IP assay. G Purified GPX4 proteins were precipitated with GST-vector, GST-TAK1 1-606aa, or GST-TAK11-305aa proteins and detected by immunoblotting using anti-GPX4 antibody. GST-fusion proteins were detected by Coomassie blue staining. H 293 T cells transfected with the vector control or Flag-GPX4 and myc-TAK1 expression plasmids for 48 h were subjected to co-IP assay. I Analysis of the TAK1-NFκB/MAPK signaling pathway in the indicated stable cell lines by immunoblotting. mock, no shRNA; Ctrl, negative control shRNA. J Representative immunofluorescence images of NFκB (p65) and p38 in GPX4 knockdown or control CNE2 EBV-positive cells. shCtrl, negative control shRNA. Data are representative of three biologically independent experiments. D and J Scale bars: 20 µm.
Fig. 7
Fig. 7. GPX4 promotes tumor progression and chemotherapy resistance in NPC by activating TAK1-JNK and IKK/NF-κB.
A. The TAK1-NFκB/MAPK signaling pathway was examined in EBV-negative and EBV-positive NPC cells by immunoblotting. B Protein expression of TAK1 in EBV-negative and EBV-positive CNE2 cells transduced with siRNAs against endogenous TAK1. CCK-8 assay (C) and colony formation assay (D) in the indicated cells (n = 3). E. Dose–response curve for DPP, 5-FU, and TAX treatment in the indicated cells. F The TAK1-NFκB/MAPK signaling pathway was examined in the indicated stable cell lines treated with TAK1 siRNA by immunoblotting. G CCK-8 assay of CNE2 EBV-negative cells with stable overexpression of GPX4 treated with TAK1 siRNA (n = 4). H, I. Cell cycle analysis of the indicated cells by flow cytometry. J Colony formation of the indicated cells (n = 3). si Ctrl, negative control. Data are shown as the mean ± SD. **p < 0.01; ***p < 0.001; ****p < 0.0001. CD and G, two-tailed unpaired t test.

Similar articles

Cited by

References

    1. Young LS, Rickinson AB. Epstein-Barr virus: 40 years on. Nat Rev Cancer. 2004;4:757–68. - PubMed
    1. Tsao S-W, Tsang CM, To K-F, Lo K-W. The role of Epstein-Barr virus in epithelial malignancies. J Pathol. 2015;235:323–33. - PMC - PubMed
    1. Mesri EA, Feitelson MA, Munger K. Human viral oncogenesis: a cancer hallmarks analysis. Cell Host Microbe. 2014;15:266–82. - PMC - PubMed
    1. Tsang CM, Deng W, Yip YL, Zeng MS, Lo KW, Tsao SW. Epstein-Barr virus infection and persistence in nasopharyngeal epithelial cells. Chin J Cancer. 2014;33:549–55. - PMC - PubMed
    1. Torre LA, Bray F, Siegel RL, Ferlay J, Lortet-Tieulent J, Jemal A. Global cancer statistics, 2012. CA: Cancer J Clin. 2015;65:87–108. - PubMed

Publication types

MeSH terms

Substances