

miR-26a-5p suppresses nasopharyngeal carcinoma progression by inhibiting PTGS2 expression
- PMID: 35073820
- PMCID: PMC8942422
- DOI: 10.1080/15384101.2022.2030168
miR-26a-5p suppresses nasopharyngeal carcinoma progression by inhibiting PTGS2 expression
Abstract
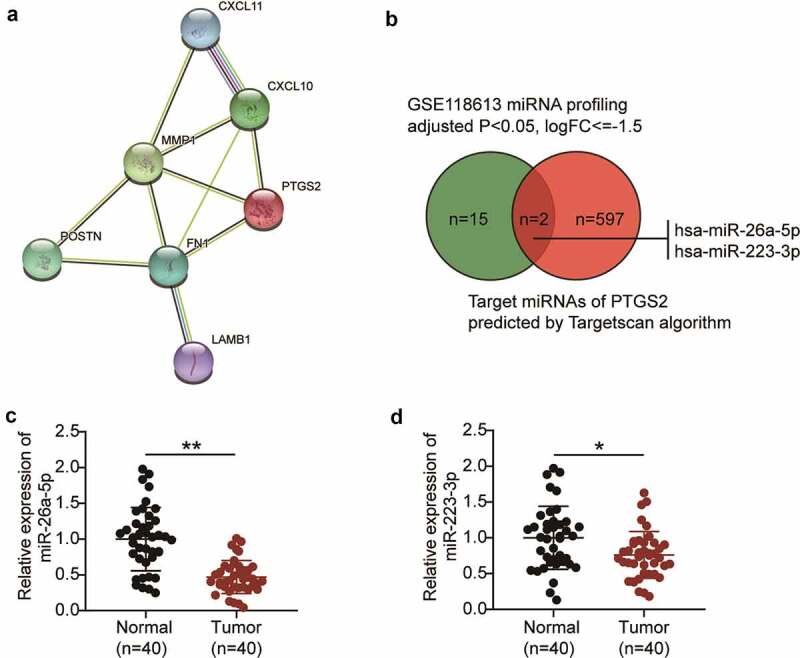
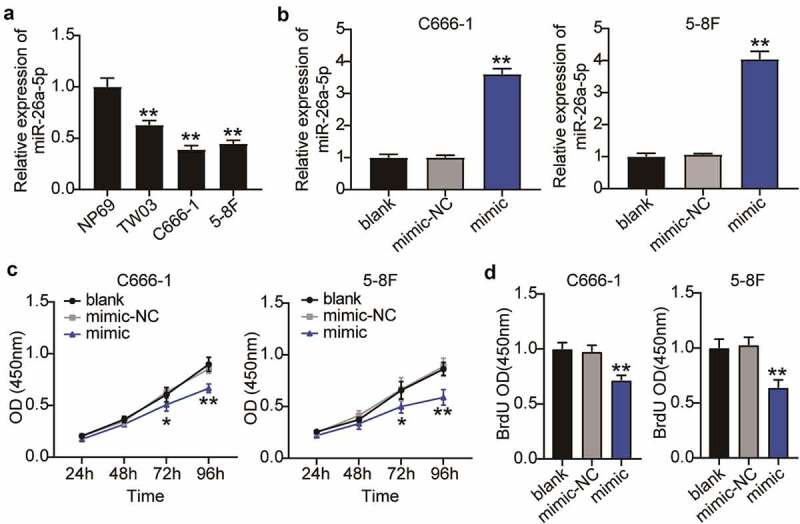
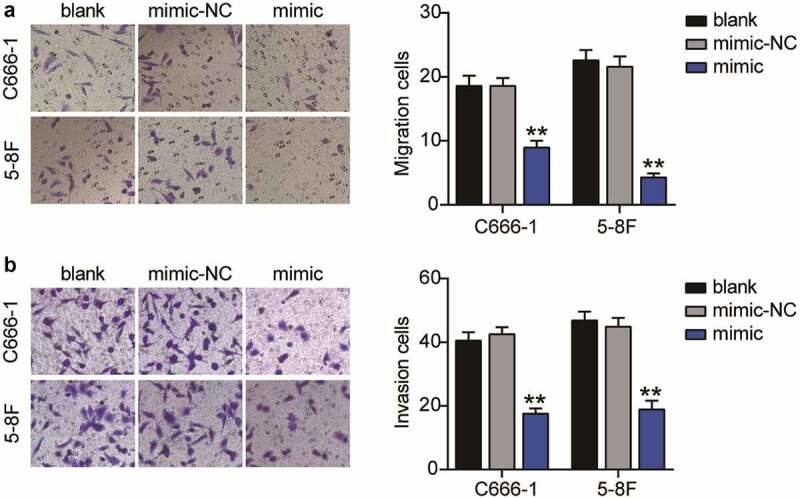
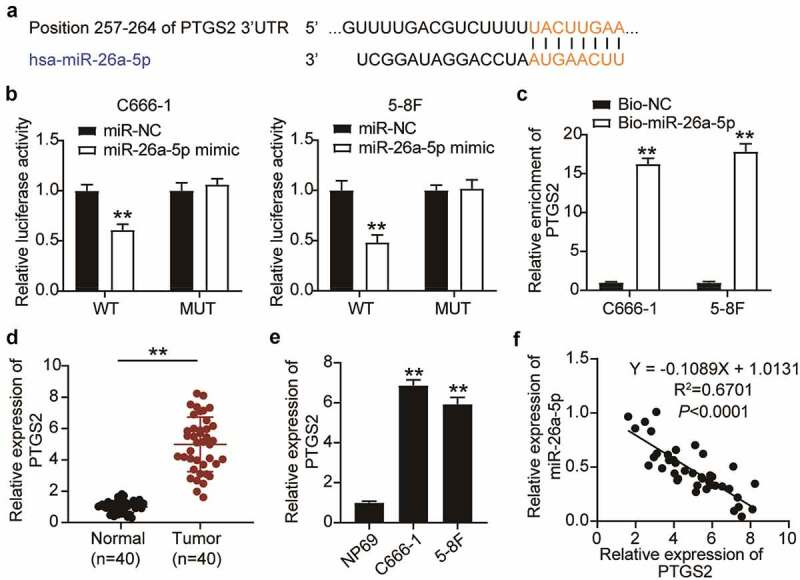
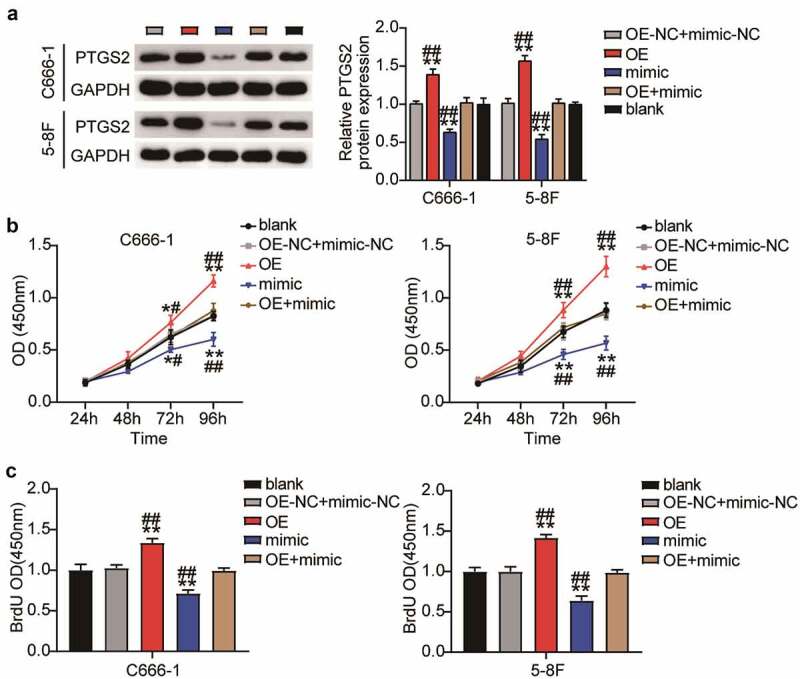
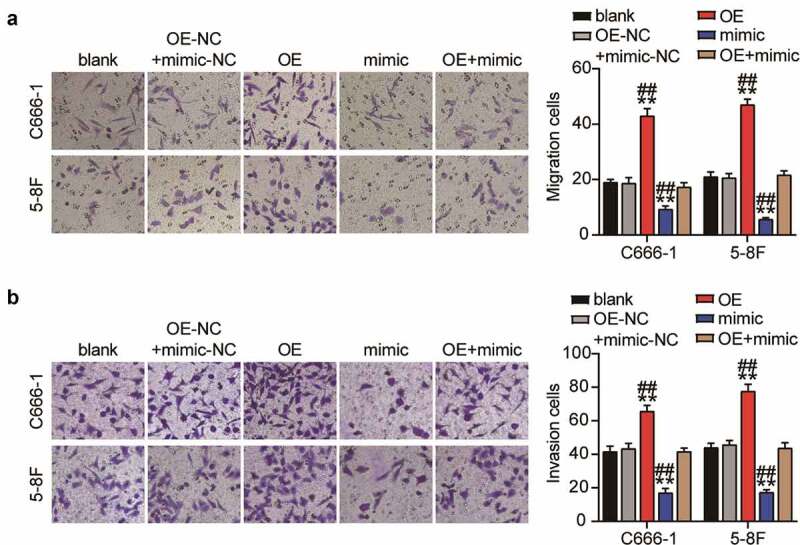
Nasopharyngeal carcinoma (NPC) has a low five-year survival rate, and its pathogenesis remains unclear. There is an urgent need to improve our understanding of the genetic regulation of NPC tumorigenesis and development. The role of miR-26a-5p in NPC growth regulation and the expression of its target, PTGS2, was analyzed. Quantitative Real-time PCR assay was used to detect miR-26a-5p and PTGS2 expression in human NPC tissues and cell lines. The RNA pull-down dual-luciferase reporter assay was used to determine the association between miR-26a-5p and PTGS2. The effects of miR-26a-5p and PTGS2 on NPC cell viability, proliferation, migration, and invasion were measured by CCK-8, BrdU, and Transwell assays. miR-26a-5p expression in NPC tissues and cell lines was significantly decreased. The overexpression of miR-26a-5p inhibited the viability, proliferation, migration, and invasion of NPC cells. miR-26a-5p bound to the 3-'untranslated region of PTGS2, thus reducing PTGS2 protein levels. miR-26a-5p inhibited NPC development by reducing the expression of its target PTGS2.
Keywords: Nasopharyngeal carcinoma; PTGS2; invasion; miR-26a-5p; migration; proliferation.
Conflict of interest statement
No potential conflict of interest was reported by the author(s).
Figures
Similar articles
-
LINC00240 knockdown inhibits nasopharyngeal carcinoma progress by targeting miR-26a-5p.J Clin Lab Anal. 2022 May;36(5):e24424. doi: 10.1002/jcla.24424. Epub 2022 Apr 14. J Clin Lab Anal. 2022. PMID: 35421264 Free PMC article.
-
LncRNA SNHG6 accelerates nasopharyngeal carcinoma progression via modulating miR-26a-5p/ARPP19 axis.Bioorg Med Chem Lett. 2021 May 15;40:127955. doi: 10.1016/j.bmcl.2021.127955. Epub 2021 Mar 17. Bioorg Med Chem Lett. 2021. PMID: 33744438
-
MicroRNA-449b-5p suppresses cell proliferation, migration and invasion by targeting TPD52 in nasopharyngeal carcinoma.J Biochem. 2019 Nov 1;166(5):433-440. doi: 10.1093/jb/mvz057. J Biochem. 2019. PMID: 31350893
-
MicroRNA-296-5p inhibits cell metastasis and invasion in nasopharyngeal carcinoma by reversing transforming growth factor-β-induced epithelial-mesenchymal transition.Cell Mol Biol Lett. 2020 Nov 3;25(1):49. doi: 10.1186/s11658-020-00240-x. Cell Mol Biol Lett. 2020. PMID: 33292168 Free PMC article.
-
Long non-coding RNA LUADT1 promotes nasopharyngeal carcinoma cell proliferation and invasion by downregulating miR-1207-5p.Bioengineered. 2021 Dec;12(2):10716-10728. doi: 10.1080/21655979.2021.2001952. Bioengineered. 2021. PMID: 34738862 Free PMC article.
Cited by
-
Role of microRNAs in host defense against porcine reproductive and respiratory syndrome virus infection: a hidden front line.Front Immunol. 2024 Mar 25;15:1376958. doi: 10.3389/fimmu.2024.1376958. eCollection 2024. Front Immunol. 2024. PMID: 38590524 Free PMC article. Review.
-
Uncovering the therapeutic efficacy and mechanisms of Quercetin on traumatic brain injury animals: a meta-analysis and network pharmacology analysis.Metab Brain Dis. 2024 Nov 13;40(1):13. doi: 10.1007/s11011-024-01449-x. Metab Brain Dis. 2024. PMID: 39556146
-
Exploration of the Molecular Mechanism of Curcuma aromatica Salisb's Anticolorectal Cancer Activity via the Integrative Approach of Network Pharmacology and Experimental Validation.ACS Omega. 2024 May 1;9(19):21426-21439. doi: 10.1021/acsomega.4c01759. eCollection 2024 May 14. ACS Omega. 2024. PMID: 38764617 Free PMC article.
-
Network Pharmacology-Integrated Molecular Docking Reveals the Expected Anticancer Mechanism of Picrorhizae Rhizoma Extract.Biomed Res Int. 2022 Sep 16;2022:3268773. doi: 10.1155/2022/3268773. eCollection 2022. Biomed Res Int. 2022. Retraction in: Biomed Res Int. 2024 Jan 9;2024:9854052. doi: 10.1155/2024/9854052. PMID: 36158891 Free PMC article. Retracted.
-
miR-26a is a Key Therapeutic Target with Enormous Potential in the Diagnosis and Prognosis of Human Disease.Curr Med Chem. 2024;31(18):2550-2570. doi: 10.2174/0109298673271808231116075056. Curr Med Chem. 2024. PMID: 38204224 Review.
References
-
- Wilmot VV, Hathorn I.. Surgical management of nasal stenosis following chemoradiation for nasopharyngeal carcinoma. J Laryngol Otol. 2017;131:429–432. - PubMed
-
- Liu Y, Liu Q, Chen S, et al. APLNR is involved in ATRA-induced growth inhibition of nasopharyngeal carcinoma and may suppress EMT through PI3K-Akt-mTOR signaling. FASEB J. 2019;33:11959–11972. - PubMed
MeSH terms
Substances
Grants and funding
LinkOut - more resources
Full Text Sources
Other Literature Sources
Research Materials