. 2022 Jan 10;13(1):159.
doi: 10.1038/s41467-021-27572-2.

Altered succinylation of mitochondrial proteins, APP and tau in Alzheimer's disease

Affiliations

Altered succinylation of mitochondrial proteins, APP and tau in Alzheimer's disease

Yun Yang et al. Nat Commun. .

Abstract

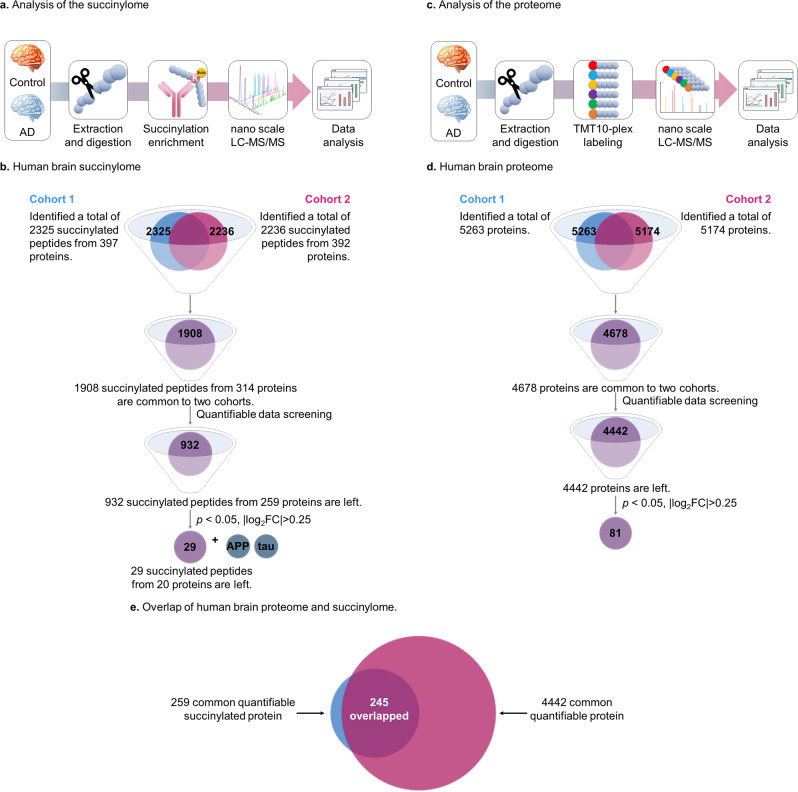
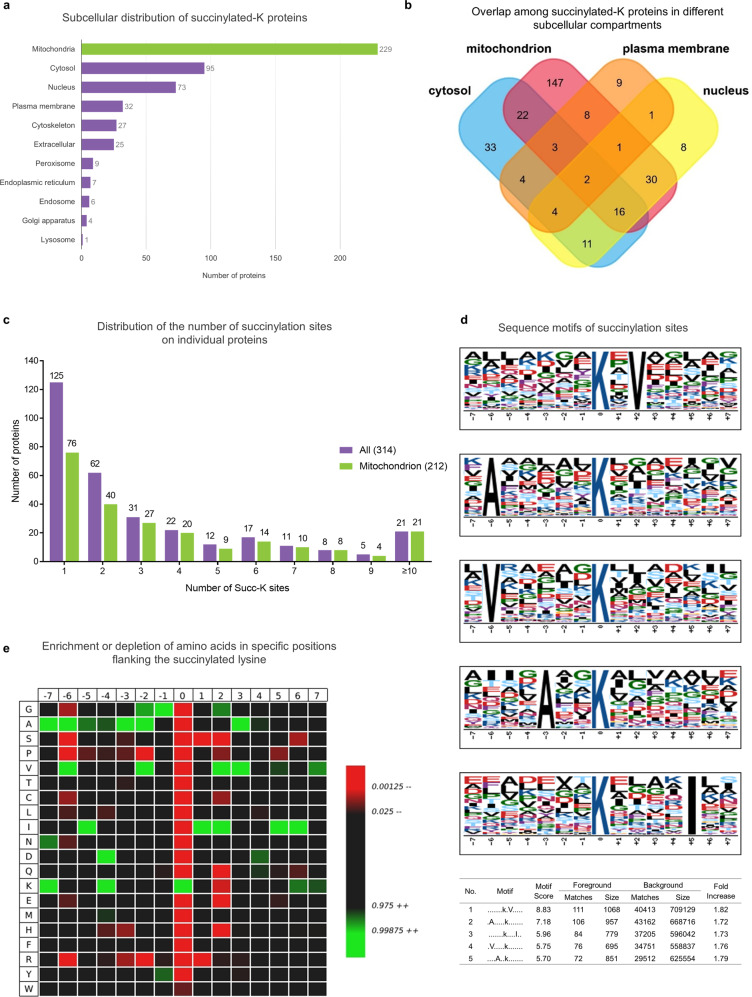
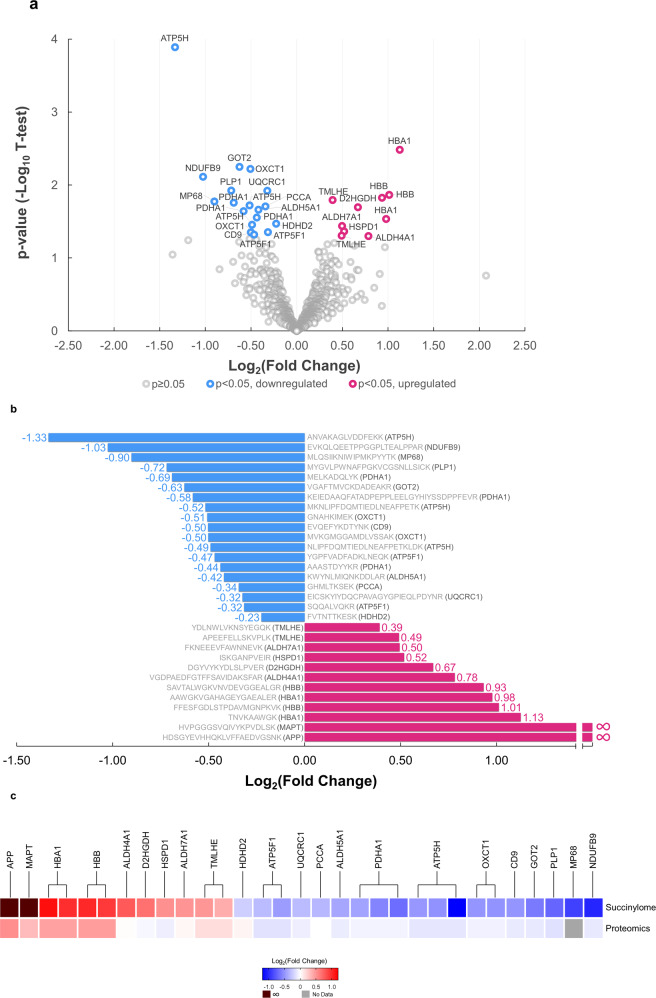
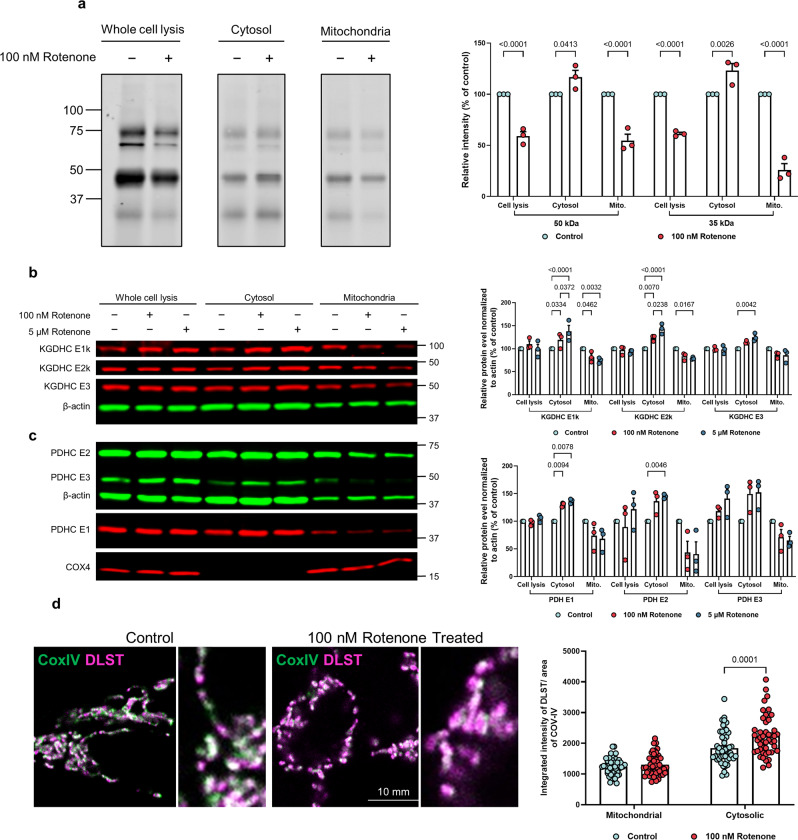
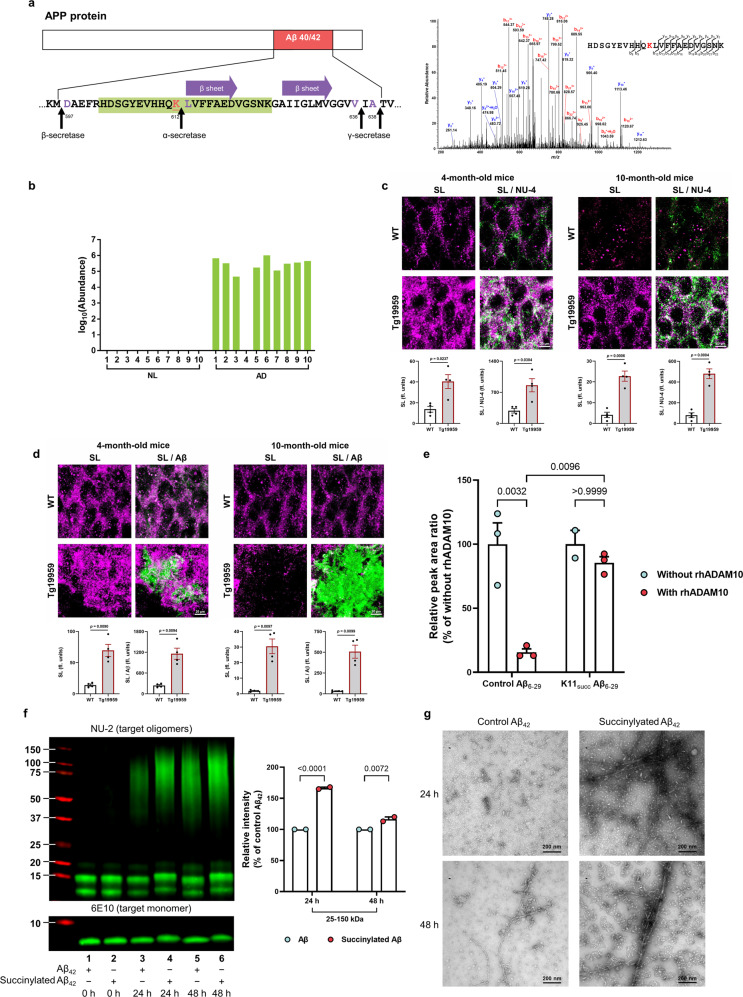
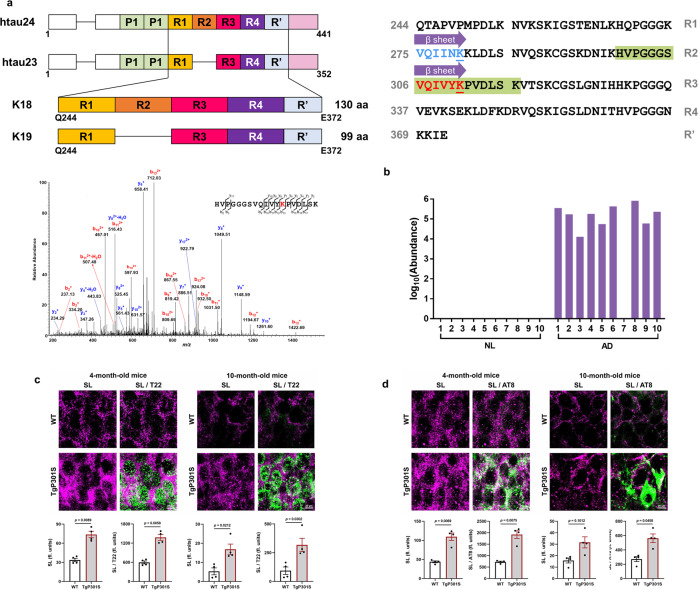
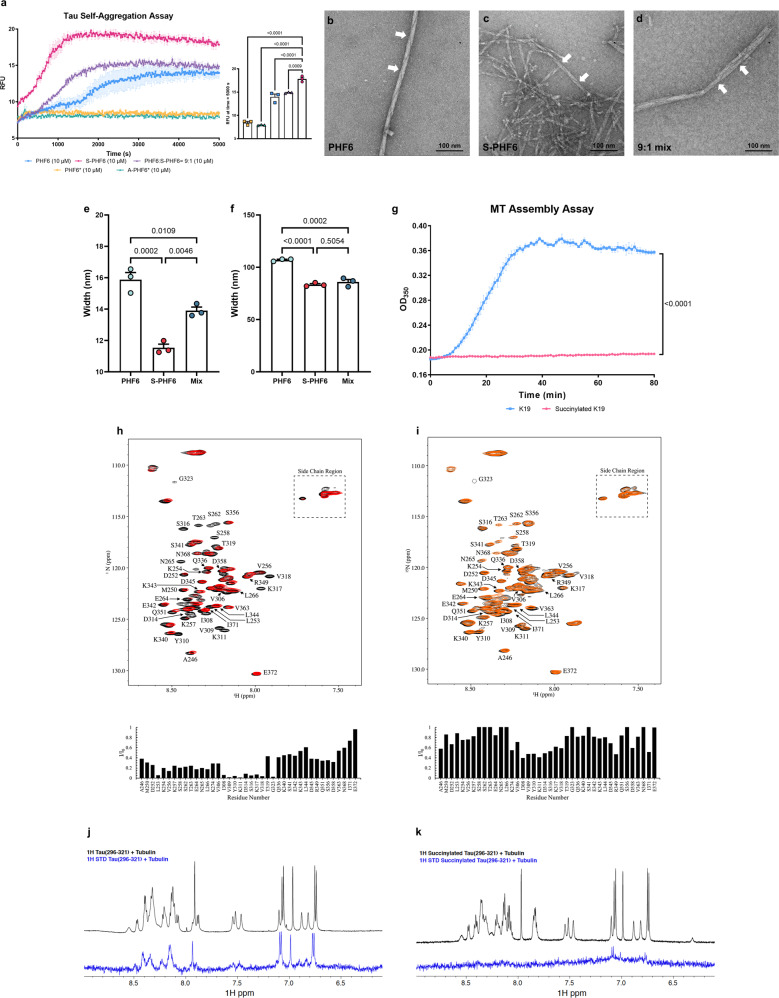
Abnormalities in brain glucose metabolism and accumulation of abnormal protein deposits called plaques and tangles are neuropathological hallmarks of Alzheimer's disease (AD), but their relationship to disease pathogenesis and to each other remains unclear. Here we show that succinylation, a metabolism-associated post-translational protein modification (PTM), provides a potential link between abnormal metabolism and AD pathology. We quantified the lysine succinylomes and proteomes from brains of individuals with AD, and healthy controls. In AD, succinylation of multiple mitochondrial proteins declined, and succinylation of small number of cytosolic proteins increased. The largest increases occurred at critical sites of amyloid precursor protein (APP) and microtubule-associated tau. We show that in vitro, succinylation of APP disrupted its normal proteolytic processing thereby promoting Aβ accumulation and plaque formation and that succinylation of tau promoted its aggregation to tangles and impaired microtubule assembly. In transgenic mouse models of AD, elevated succinylation associated with soluble and insoluble APP derivatives and tau. These findings indicate that a metabolism-linked PTM may be associated with AD.


Conflict of interest statement

The authors declare no competing interests.

Figures

Fig. 1
Fig. 1. Global analysis of protein lysine succinylation and proteomic profiles in human brains.
a A schematic diagram of the workflow for investigation of human brain lysine succinylome by label-free quantitation (See methods section). b After quantitative data screening and mining, the combined results from 20 brain samples in two batches revealed 932 common succinylated peptides quantified from 259 proteins (Supplementary Data 4). c A schematic diagram of the workflow for quantitative proteomics of human brain by Tandem mass tags (TMT) labeling analysis (See methods section). d After quantitative data screening and mining, the combined results from 20 brain samples in two batches revealed 4442 common proteins in both AD and controls (Supplementary Data  5). Eighty-one proteins showed significant alterations between samples patients with AD and controls. e The overlap between succinylomes and proteomes. Nearly all of the succinylated proteins were also identified in its global proteomic analysis. Source data are provided as a Source Data file.
Fig. 2
Fig. 2. Subcellular distribution of lysine-succinylation proteins in human brains.
a Subcellular distribution of succinylated-K proteins identified by Cytoscape and stringAPP software. The majority of succinylated-K proteins are mitochondrial. b Overlap of succinylated-K proteins located in the mitochondrion, nucleus, cytosol, and plasma membrane. The details of the subcellular distribution of individual proteins are shown in Supplementary Data 2. c The extent of succinylation of individual proteins and their enrichment in mitochondria. Distribution of the number of succinylation sites per protein in all of the succinylated proteins (purple bars) or succinylated mitochondrial proteins (green bars) as classified by Cytoscape and stringAPP. d The succinylation sites were analyzed for seven amino acids up- and downstream of the lysine residue using Motif-X. The height of each letter corresponds to the frequency of that amino-acid residue in that position. The central blue K refers to the succinylated lysine. e Heatmap of the 15 amino-acid compositions of the succinylated site showing the frequency of the different amino acids in specific positions flanking the succinylated lysine. The different colors of blocks represent the preference of each residue in the position of a 15 amino-acid-long sequence context (green indicates greater possibility, while red refers to less possibility). Source data are provided as a Source Data file.
Fig. 3
Fig. 3. Comparison of the succinylome of brains from ten controls and ten patients with AD reveal many specific differences (p < 0.05, two-sided Student’s t-test).
a Volcano plot of 932 brain protein peptide succinylation in controls and AD patients. The signal detection result shows the magnitude (log2Fold Change, x-axis) and significance (−log10 p-value, y-axis) for brain succinylation changes associated with AD. Each spot represents a specific succinylated peptide. Blue symbols to the left of zero indicate succinylated peptides that are decreased significantly while red symbols to the right of zero indicate succinylated peptides that are upregulated significantly in AD brains (p < 0.05, two-sided Student’s t-test). b Peptides with significant differences in succinylation between control and AD brains. Decreases (blue bars) or increases (red bars) from the control succinylome are depicted as relative fold change. The sequence of the peptide and the name of the gene to which the peptides belong is noted for each bar. c Comparison of the AD-related changes in global proteome and succinylome. The succinylated peptides from the succinylome were clustered based on their proteins. For each protein, its relative fold change in succinylome and global proteome of AD cases versus controls is shown. Source data are provided as a Source Data file.
Fig. 4
Fig. 4. Impairing mitochondrial function altered succinylation and protein distribution in the whole cell as well as in the mitochondria and non-mitochondrial fractions.
a The effects of rotenone (100 nM/20 min) on succinylation in HEK cells. After separation, mitochondrial and non-mitochondrial fractions were immune-precipitated with anti-succinyl lysine antibody and separated by SDS-PAGE followed by western blotting. The data from three different replicate experiments were expressed as the mean with error bars from standard error of the mean (SEM) (n = 3 independent experiments, two-way ANOVA followed by Bonferroni’s multiple comparisons test). b The effects of rotenone (100 nM or 5 μM/20 min) on the distribution of KGDHC protein between mitochondria and non-mitochondrial fractions. The data from three different replicate experiments were expressed as the mean with error bars from SEM (n = 3 independent experiments, two-way ANOVA followed by Tukey’s multiple comparisons test). c The effects of rotenone (100 nM, 5 μM/20 min) on the distribution of PDHC protein between mitochondria and non-mitochondrial fractions. The data from three different replicate experiments were expressed as the mean with error bars from SEM (n = 3 independent experiments, two-way ANOVA followed by Tukey’s multiple comparisons test). d Rotenone induces release of DLST into cytoplasm. In the control conditions, DLST (magenta) was concentrated inside mitochondria defined by COX-IV labeling (green). After 1 h of 100 nM Rotenone treatment, additional DLST labeling was found in the cytoplasm. Inserts on the right are magnified regions. Magenta: DLST; Green: COX-IV; Error bars represent SEM deviation from the mean (n = 98 fields from 19 dishes, two-way ANOVA followed by Bonferroni’s multiple comparisons test). Source data are provided as a Source Data file.
Fig. 5
Fig. 5. Succinylation occurs uniquely on APP from AD patients, in early stages of plaque formation in mouse models and disrupts APP processing.
a Location and identity of succinylation K612 near the Aβ region. Residues are numbered according to APP695 sequence. Purple amino acids refer to α- or β- or γ- cleavage sites. The red underlined lysine refers to succinylated K612. Purple arrow represents the two central strands of the β-sheet (Leu613-Asp619 and Ala626-Val632). Green highlights the peptide identified in the MS. MS2 spectrum of m/z 686.57444+ leads to confident identification of a succinylated peptide from APP protein with K612 succinylation site being highlighted in red text. b Abundance of succinylation K612 found in brains from 10 controls and 10 AD patients. Data transformed by log10 (abundance) for normalization purposes and to facilitate presentation. c Confocal microscope analysis of the colocalization of succinylation (magenta) and amyloid oligomers (green) in the hippocampal region of 4 and 10-month-old Tg19959 or wild-type (WT) mice (n = 4 per each group, two-tailed Student’s t-tests). d Brain sections were stained against Aβ plaques (green) and succinyl lysine (magenta). Quantitative analysis of the colocalization of succinylation and plaque pathology in the hippocampus of 4 and 10-month-old Tg19959 or WT mice (n = 4 per each group, two-tailed Student’s t-tests). e Succinylation blocks α-cleavage. Peptides were incubated for 24 h with or without rhADAM10. Peak area ratio values were calculated and are shown relative to corresponding controls without rhADAM10. Each sample was run in triplicate and data were expressed as the mean with SEM (n = 3 biologically independent samples, two-way ANOVA followed by Bonferroni’s multiple comparisons test; except for one sample from the group of succinylated peptide without rhADAM10 was damaged). f Western blot analysis of succinylated and control Aβ42 from aggregation assay showed that the succinylation generates more oligomerized Aβ even after a long incubation. The data were expressed as the mean with SEM (n = 2 biologically independent samples, two-way ANOVA followed by Bonferroni’s multiple comparisons test). g Two timepoints from aggregation assay were analyzed by negative-staining electron microscopy. This experiment was performed once. Source data are provided as a Source Data file.
Fig. 6
Fig. 6. The unique succinylation of K311 on tau in brains from patients with AD.
a Domain structure of tau and the location of succinylation K311. The diagram shows the domain structure of htau23 and 24, which contain three and four repeats, respectively. The constructs K18 and K19 comprise four repeats and three repeats, respectively. Residues are numbered according to tau441 sequence. Purple arrow represents the two central strands of the β-sheet (PHF6*: Val275-Lys280, highlighted in blue, the blue underlined lysine refers to acetylated K280; PHF6: Val306-Lys311, highlighted in red, the red underlined lysine refers to succinylated K311). Green highlights the peptide identified by MS. MS2 spectrum of m/z 694.04073+ leads to confident identification of a succinylated peptide from tau protein with K311 succinylation site being highlighted in red text. b Abundance of succinylation K311 found in brains from ten controls and ten patients with AD. Data transformed by log10 (abundance) for normalization purposes and to facilitate presentation. c High-resolution images acquired using confocal laser microscopy display the colocalization of succinylation(magenta) and tau oligomers(green) in the hippocampus of 4-month-old and 10-month-old Tg19959 or WT mice (n = 4 per each group, two-tailed Student’s t-tests). d Fluorescence micrographs obtained from the hippocampus of 4-month-old and 10-month-old Tg19959 or WT mice show the colocalization between succinylation(magenta) and NFTs (green) (n = 4 per each group, two-tailed Student’s t-tests). Source data are provided as a Source Data file.
Fig. 7
Fig. 7. The succinylation of K311 on tau promotes AD like features in tau pathology.
a Succinylation promotes self-aggregation of tau. Tau peptides (10 μM) were in presence of 2.5 μM heparin: PHF6 (blue squares), S-PHF6 (magenta circles), PHF6:S-PHF6 = 9:1 (purple triangle), PHF6* (yellow square), A-PHF6* (lake green triangle). Error bars represent SEM deviation from the mean. All statistical analysis was implemented at time = 5000 s (n = 3, one-way ANOVA followed by Tukey’s multiple comparisons test). Experiments repeated three times with similar results. bd Negative stain electron microscopy of in vitro polymerized PHFs after 24 h incubation. b 50 μM PHF6; c 50 μM S-PHF6; d 50 μM mixture (PHF6:S-PHF6 = 9:1). White arrows denote paired helical filaments. N = 3 independent biological replicates. Scale bar is 100 nm. e, f The width and height of the fiber helix found in polymerized PHFs after 24 h incubation in vitro. Error bars represent SEM deviation from the mean (n = 3 different fields per group, one-way ANOVA followed by Tukey’s multiple comparisons test). g Inhibition of assembly reaction of K19 and microtubules by succinylation of K19. Incubations (30 min) were with 30 μM succinylated K19 (magenta circles) or non-succinylated K19 (blue Squares). Error bars represent SEM deviation from the mean. All statistical analysis was implemented at time = 80 min (n = 3, two-way ANOVA followed by Bonferroni’s multiple comparisons test). Experiments repeated three times with similar results. h, i Succinylation of K19 weakens its interactions with T2R.1H,15N HSQC spectra were recorded for unmodified and succinylated K19 in the absence (black) and in the presence (red for unmodified K19, orange for succinylated K19) of T2R. Unmodified or succinylated 15N K19 spectra (assignments for well-resolved residues as indicated) exhibit intensity loss for multiple residues including Ile308, Val309, Tyr310, Lys311 in the presence of T2R. j, k Succinylation of K311 weakens the interactions of tau peptide (296–321) with tubulin. Comparison of 1D 1H spectra (black) and saturation transfer difference NMR spectra (blue) of unmodified tau peptide (296–321) or K311-succinylated tau peptide (296–321) in the presence of 20 μM tubulin. Source data are provided as a Source Data file.

Similar articles

Cited by

References

    1. Usui K, et al. Site-specific modification of Alzheimer’s peptides by cholesterol oxidation products enhances aggregation energetics and neurotoxicity. Proc. Natl Acad. Sci. USA. 2009;106:18563–18568. - PMC - PubMed
    1. Tjernberg LO, et al. Arrest of -amyloid fibril formation by a pentapeptide ligand. J. Biol. Chem. 1996;271:8545–8548. - PubMed
    1. Cohen TJ, et al. The acetylation of tau inhibits its function and promotes pathological tau aggregation. Nat. Commun. 2011;2:252. - PMC - PubMed
    1. Gordon BA, et al. Spatial patterns of neuroimaging biomarker change in individuals from families with autosomal dominant Alzheimer’s disease: a longitudinal study. Lancet Neurol. 2018;17:241–250. - PMC - PubMed
    1. Dumont M, et al. Mitochondrial dihydrolipoyl succinyltransferase deficiency accelerates amyloid pathology and memory deficit in a transgenic mouse model of amyloid deposition. Free Radic. Biol. Med. 2009;47:1019–1027. - PMC - PubMed

Publication types

MeSH terms